JAIST Repository: ラフ集合論を用いた感性評価モデリングとデザイン支援システム
70
0
0
全文
(2) Sensory Evaluation Modeling and Design Support Systems using Rough-Sets Theory By JU, Hongli. A thesis submitted to School of Knowledge Science Japan Advanced Institute of Science and Technology for the degree of Master of Knowledge Science. Written under the direction of Professor Yoshiteru Nakamori. September, 2009.
(3) Chapter 1 Introduction. This chapter describes the purpose of this study, describing why the Kutani-ware was chosen as the research object, why Kansei Engineering was considered as the methodology, and why Rough-Sets Theory was used among the lots of methods in Kansei Engineering. The chapter ends with the outline of the whole dissertation.. -1-.
(4) 1.1. Kutani-ware. Traditional craft is a very important industry in Japan, and the most famous traditional craft is Kutani-ware in Ishikawa prefecture. As explained on the Web site of The Association for the Promotion of Traditional Craft Industries 1, each of traditional craft products is “unique fostered through regional differences and loving dedication, and provides a continual wealth of pleasure.” However, due to the rapidly changing lifestyles of younger generations, plus the prevalence of modern industrial products with their advantages in cost and usability, the market for traditional crafts in Japan has been shrinking over recent years. In 1974, the Japanese government (METI) enacted the so-called Densan Law for the Promotion of Traditional Craft Industries2, as quoted below: Japan has a great number of items for daily use whose development reflects the country’s history, environment and lifestyle. Meanwhile, because of the factors such as changing lifestyle and the development of new materials, crafts manufactured with traditional methods and materials are having had times. Under the circumstances, METI enacted the above law in May 1974 with the objective of promoting the traditional crafts industry in order that traditional crafts bring richness and elegance to people’s living and contribute to the development of local economy, consequently, the sound development of nation’s economy. In addition, since 1984 METI has designated the month of November as Traditional Crafts Month, and conducted publicity and educational programs related to traditional crafts throughout Japan. All of these attempts have been important not only from the economic perspective, but also particularly important from the culture perspective in maintaining a spiritual heritage which makes the country unique. So it is so significant to reactivate the Traditional Industry such as Kutani-ware using a high technology (Huynh, 2009).. 1 2. http://www.kougei.or.jp/English/promotion.html http://.kansai.meti.go.jp/english/dentousangyou/top_page.html -2-.
(5) 1.2. Kansei Engineering. Recently, consumers and customers are quite demanding, not only regarding quality but also regarding their satisfaction in terms of psychological feeling about products and services to purchase. They have become more and more selective in their choices. Therefore, in an increasingly competitive world market, it is important for manufacturers to have a customer-focused approach in order to improve attractiveness in development of new products, which should satisfy not only requirements of physical quality, defined objectively, but also consumers’ psychological needs, by essence subjective (Yannou, 2004). This approach has actually received much attention since the 1970s from the research community of consumer-focused design and Kansei Engineering. Particularly, Kansei Engineering refers to the translation of consumers’ psychological feeling about a product into perceptual design elements and it is also sometimes referred to as “Sensory Engineering” or “Emotional Usability.” This technique involves determining which sensory attributes elicit particular subjective responses from people, and then designing a product using the attributes which elicit the desired responses (Nagamachi, 1995). It has been developed and successfully applied to a variety of industries, and especially in Japan it has been widely applied to the product design process in industries such as automotive industry, home electronics, office machines, food and drink, packaging, building products and other sectors (Childs, 2001). As well known, the artistic and aesthetic aspects play a crucial role in perception of traditional crafts, therefore Kansei data are essential and necessary for evaluation. Of course many studies of Kansei Engineering or other consumer-oriented design techniques have involved an evaluation process in which a design could be selected for production but Kansei-based evaluation of existing products have generally received less attention, in particular for traditional craft products (Mondragon, 2005). Since traditional crafts are very valuable, so we hope to sell the products by showing customers Kutani-ware samples. So we will carry out a Kansei Evaluation through Kansei Engineering in order to reactivate the traditional industry.. -3-.
(6) 1.3. Rough-Sets Theory. The main aim of many Kansei Engineering studies is to develop the product prototypes which would generate specific consumer feeling. In these studies, discovering relationships between Kansei data and design elements is essential and plays a crucial role. For this task, traditionally Kansei Engineering methods utilized multivariate statistical analysis such as principle component analysis and regression analysis, which typically treat Kansei data as numerical data, together with the assumption of the existence of linear relations between consumer affections and design elements. However it is also argued that assessments of some Kansei features may show non-linear characteristics compared to the horizontal numerical change on design elements, and therefore applying multivariate analysis to these Kansei data might not be appropriate (Nagamachi, 2006). Recently it has been shown that Rough-Sets Theory can be properly applied to analyze Kansei data in Kansei Engineering (Nishino, 2001), irrespective of linear or non-linear characteristic, in which Kansei data are conventionally treated as categorical data. The formal methods of Kansei Engineering have some deficiencies: When identifying relationship between a commodity and peoples emotions, we can just know the relationship between the emotion and the samples we used, and we can only recommend items included among the samples we demonstrated to participants. Sometimes people may want the color of sample A, the shape of sample B and the pattern of sample C. In other words we sometimes want new things which combine elements from the existing samples. When carrying out sensory evaluation experiment, as a result of ambiguous language and people’s subjective differences, the accuracy of the data may become lower, and there will be a bad effect on the analysis. Since many databases contain fuzzy, incomplete or identical datasets, certain tools must be deployed. The Rough-Sets Theory is one of these tools. This paper proposes a sensory modeling technique using Rough-Sets Theory, based on a set of evaluation data for Kutani-ware coffee cups. An important contribution of this paper is that the proposed technique can suggest new designs according to customers’ sensory requirements, which are not used in the evaluation experiment.. -4-.
(7) 1.4. The Structure of the Thesis. This dissertation is organized as the following 6 chapters: Chapter 1 explains the purpose of the research and reasons to use the Rough-Sets Theory. Chapter 2 presents a research review on Kansei Engineering; gives an introduction about the term “Kansei”, and tools for Kansei Engineering. Chapter 3 gives an introduction about Kutani-ware, and some researches on Kansei Evaluation and introduces a Kansei Evaluation experiment carried out in this study to asses how people feel about the Kutani-ware coffee cups. This experiment indicates peoples feeling to the samples. Chapter 4 proposes a new method to analyze the data we got from the experiment and presents some new rules obtained in this study, with which we could recommend new designs to designers of Kutani-ware. Chapter 5 shows some new samples according to the new rules and a simple evaluation on the new design of the samples, and then presents the structure of a design support system using the database aiming to support for the designers of Kutani-ware. Finally, Chapter 6 gives a conclusion of the study and the possible future works.. -5-.
(8) Chapter 2 Kansei Engineering. This chapter presents a research review on the Kansei Engineering through introducing the nature, the model and the type of Kansei Engineering and also gives an introduction of the “Kansei”, tools for Kansei Engineering. The tools we introduced are “Factor Analysis” and “Rough-sets Analysis”. It also gives an introduction on some researches about Kansei Evaluation.. -6-.
(9) 2.1 What is “Kansei”. 2.1.1 The Nature of Kansei The term “Kansei” is a Japanese expression with no direct corresponding term in English, and it is a multi-faceted expression which is not readily translated to other languages. This is a result of the fact that it is so closely connected to the Japanese culture. Kansei is an individual subjective impression from a certain artifact, environment or situation using all the senses of sight, hearing, smell, taste and the sense of balance as well as recognition (Schulte, 2005). Of course, this might seem irrational, but in most cases even your personal Kansei may not be so unique, and it can be grouped, categorized and measured in order to use it for product design and so on (Aarakawa, 1999). Kansei is the integrated function of the mind (see Fig.2-1).. Fig.2-1: Nature of Kansei 2.1.2 The Etymology of Kansei Japanese language possesses two different types of alphabets (Hiragana, Katakana) and Kanji characters. The Kanji has its roots in the Chinese culture, and each character expresses a whole meaning. However, a Kanji character usually has multiple meanings,. -7-.
(10) and only the combination and arrangement with other Kanji creates a definitive meaning (Schutte, 2005). The Japanese term ‘Kansei’ consists typically two different Kanji-signs, ‘Kan’ and ‘Sei’, which in combination mean sensitivity or sensibility (Lee et al., 2002). But first in a technical or psychological context, the expression receives the final meaning which is used here. Etymologically the term Kansei splits into two signs, of which the second sign is structured from two other signs as shown in Fig.2-2.. 感. 性. Kan sei. 感. +. (心 + 生). Feel, Heart, Be alive, Touch, Mind, Dynamic Tactile, Soul, Sensation, Emotion, Impression. Fig.2-2: Etymology of Kansei 2.1.3 Philosophical Definition According to Lee et al. (2002), the problem field of ‘Kansei’ was originally addressed by the German philosopher Baumgartner. In 1742 Baumgartner gave an initial lecture on aesthetics which was followed up eight years later when he published his unfinished Latin book ‘Aesthetics’ in 1750, in which he introduced the philosophical theoretical framework and an expression of Aesthetics. Baumgartner wanted not only to give a theory of fine arts, but also intended to enhance philosophy with a ‘Science of Sensual Awareness’ (Baumgartner, 1961). He argued in favor of two aspects of Aesthetics: the sensitive-theoretical and the more common artistic-rhetorical, i.e. the receptor and the productive meaning of Aesthetics. Originally Kansei is a term from the Japanese epistemology, which is a branch of Anglo-Saxon philosophy. It is the science of knowledge that tries to find principles and rules about how knowledge is gained (Brockhaus Universallexikon, 2000). Kansei is. -8-.
(11) seen as sensual intuition providing the material for understanding, and through this the mental ability of experiencing affective values like feeling emotion and desire. Someone states that the Kansei is processed by the right half of the brain, processing analogue and fuzzy data, whereas the understanding processing of a logical speculative nature is treated by the left brain, whose specialization is digital data processing (Nagamura, 1991). 2.1.4 Psychological Definition The expression Kansei itself did not exist in Japanese Psychology at all until recent years. It is connected to concepts such as sensation, perception and cognition, which are accepted psychological terms. They belong to a sequential process called the cognitive continuum. In this context, sensation, perception and cognition are processes which generally are independent but can be interconnected. Nagamura illustrates this in an example. He says that a light stimulus can be sensed and perceived without cognition. No cognition is required if somebody is asked whether she or he sees the light or not. If one is asked how it looks, cognition is required, and the three processes work together in the cognition continuum, previously mentioned. 2.1.5 Definition by Kansei Researchers Kansei incorporates the meaning of the words: sensitivity, sense, aesthetics, feelings, emotions affection and intuition (Lee, 2002). Shimizu sees Kansei as being closely related to sophisticated human abilities such as sensibility, recognition, identification, relationship, making and creative action, where the process of biding together these concepts also is part of the Kansei (Shimizu, 2004). According to the Japanese Society of Kansei Engineering, ‘Kansei is the integrated function of the mind, and various functions exist while receiving and sending signals. Filtering, acquiring information, estimating, recognizing, modeling, making relationships, producing, giving information, presenting etc. are the contents of Kansei. 2.1.6 Measuring the Kansei The Kansei is an individual mind structure. Understanding others’ Kansei is not always easy and involves a large amount of empathy and experience. Hence, it might be advantageous to find rules and methods for quantifying the Kansei structure in order to make individuals’ Kansei reasonably comparable. However, the question arising is how the individual Kansei can be grasped and converted into information useful for product development. Kansei is an internal sensation, but at present it can only be measured. -9-.
(12) using methods based on externalization. Therefore, a series of standard measurement methods have been developed, interpreting (Nagamachi, 2001): ● People’s behaviors and actions ● Words (spoken) ● Facial and body expressions ● Physiological responses Nagasawa agrees with Nagamachi regarding this categorization. He structures Nagamachi’s model and distinguishes between two principally different measures (Nagasawa, 2002). ●Physiological measures, which are measures of physiological responses, behaviors, and body expressions generated ’external stimulation’. ●Psychological measures, where he mainly refers to the Semantic Differential Scales Method (SD method). The most common way of measuring the Kansei is through words. The words reflect elements of the Kansei. They are just external descriptions of the Kansei within a person’s mind. Elements of the Kansei may be absent, because we do not have words to describe all emotions. The words are not the Kansei itself. Facial and body expressions have been used within emotional design outside Kansei Engineering as well. Most of the Kansei Engineering studies which have been published in English use words when measuring the Kansei. Here we will introduce the words collection and the words structuring: Collection of Kansei words The Kansei words are words that describe the product domain. These are collected from all available sources where words are used to describe the domain. This often includes: Magazines, Literature, Manuals, Experts, Experienced users, Ideas, and Vision Statements. It is important to also include words from ideas and vision statements so that potential new solutions also are included. This collection of words goes on until no new words occur. A good result depends on all important words being included, so it is better to include a few more words than necessary. The number of Kansei words generally varies between 50-600 words (Nagamachi, 1997).. - 10 -.
(13) Kansei word structuring The goal in Fig.2-3 was to end up with fewer than 30 words, to reduce evaluation time in the survey. The 112 words were first clustered in 56 initial groups. These were reduced in the second step to 38 groups or single words. Third, the most relevant ones representing the semantic space were chosen while others were excluded. The number of words was now reduced to a total of 77, spread over 37 groups or single words. One word was chosen to represent each group. These were candidates as Kansei words. Each word was evaluated, and 25 were chosen as Kansei words describing the semantic space of portable battery drills. These processes were carried out on paper notes and in Adobe in Design, where words could be arranged quickly into groups and evaluated. We were aided in this work by one additional design student.. Fig.2-3: Word Structuring. - 11 -.
(14) 2.2 Brief introduction to Kansei Engineering. 2.2.1 Introduction to Kansei Engineering Yamamoto used the term “Kansei Engineering” for the first time in 1986 when he gave a speech at Michigan University. Kansei Engineering methods build models in which people’s emotional responses to design are linked to the product properties. It is a methodology that integrates affective elements already in the developing process (Schütte, 2005). Kansei Engineering has been applied in the design of a variety of products. Two of the greatest examples are Mazda’s best selling roadster Miata and Sharp’s video camera with an external LCD display. Other areas where Kansei Engineering has been applied are home appliances, architecture, packaging design and work equipment (Nagamachi, 1994). A great benefit of Kansei Engineering is that it can be used to link a variety of product properties to omit emotions. Studies have been done on things like micro level surface finishes of glass materials (Barnes, 2004) and music genres for mobile phone ads (Deng and Kao, 2003). Kansei Engineering is today a well-established design methodology and commercial service available in Asia. Most Kansei studies are done in Japan and Korea. In fact, Kansei Engineering is a network (see Fig.2-4).. Fig.2-4: Nature of Kansei Engineering 2.2.2 Types of Kansei Engineering There are six types of Kansei Engineering. The last three are complex systems. These will only be described in a brief introduction because this study concentrates on. - 12 -.
(15) simple ways of integrating Kansei Engineering in the Japanese design process. The methods within the model of the proposed Kansei Process will mostly focus on methods within the first three types. Type I Category Classification This is the simplest and quickest method. A product strategy and market segment is identified. A tree structure identifying the customer’s affective needs is developed. The customer’s affective needs are then connected manually to the product properties. Type II Kansei Engineering System Mathematically, statistical tools are used to connect Kansei and product properties. This is a computer-aided system using inference engines and databases with Kansei words. The KE System typically consists of databases for Kansei words, images, design and color and knowledge about relations between the data (see Fig.2-5).. Kansei Word Database. Kansei Word Process. Image Database. Knowledge Database. Interface Engine. Design and Color Database. Graphic Display. Working Memory. System Controller. Client Interface. Design Elements Concepts. Kansei Words. Fig.2-5: Principle of Kansei Engineering System. - 13 -.
(16) Type III Hybrid Engineering System This is similar to Type II, but can also predict the feelings the product properties will elicit, and is called a hybrid system. The designer can feed his or her ideas into the inference engine, which links the ideas with Kansei words which are presented. Type IV Kansei Engineering Modeling Kansei Engineering Type IV builds a mathematical prediction model that even assesses the human feelings of series shown in words. Type V Virtual Kansei Engineering This type replaces the presentation of a real product with a VR representation by integrating Virtual Reality into standard data collection systems. Type Ⅵ Collaborative Kansei Engineering Design Collaborative Kansei Engineering Designing or Internet Kansei Design System (IKDS) is an Internet-supported Kansei Engineering System. Making the KES publicly assessable by using some kind of Group Ware System, i.e. the Internet, offers the opportunity to bring the viewpoints of customers and designers together (Nishino, et al., 1999). 2.2.3 Process of Kansei Engineering The different models within Kansei Engineering focus on translating the Kansei into product properties. The output does not necessarily reflect the true “Kansei” somebody has about a product. Schulte (2005) compares the outcome with a picture of the real thing that is flatter, with less contrast, and more static than the original. Schulte proposed a model with six step process where different methods may be used within each step. Some of the methods are not unique to Kansei Engineering, such as factor analysis and regression models. The Kansei Engineering process is rather a methodology that implements different techniques to link emotion of products with product properties. In the process, the chosen product domain is mapped from both a semantic and physical perspective. The Kansei is linked to corresponding physical properties. A prediction model is then built and validated (Murai, 2001).. - 14 -.
(17) 2.3 Tools for Kansei Engineering. 2.3.1 Factor Analysis Factor Analysis reduces a large number of variables into a smaller number of groups, so-called factors. Even mathematical relations between factors can be calculated. This analysis can be used in order to understand how low level Kansei Words are connected to high level Kansei Words. A Factor Analysis can be performed, either Explorative or Confirmative. The Explorative Factor Analysis is most commonly used because it matches the purpose of finding the Kansei structure better than Confirmative Analysis. Factor analysis requires carefully collected input data. The result is a matrix where the Kansei words are grouped into factors that reveal connections between the words. The semantic differential technique has been used for many decades within other fields where physical properties are linked to more emotional values. One example is acoustics, where factor analyses are used to find a connection between how sound quality is perceived by a musician in a room and the physical attributes of the room, like shape, material etc. Osgood developed factor analyses for semantic space in 1957. He found that the semantic space can be generalized into the three dimensions of Activity, Potency and Evaluation (see Fig.2-6).. Fig.2-6: Semantic Space. - 15 -.
(18) 2.3.2 Rough-Sets Theory Rough-Sets Theory is a method used for extracting precise data from vague datasets (Pawlak, 1992, 1997). It reveals connections between data which are only linked together by association (Nakamura, 1996). Rough-Sets Theory uses similar input data as Quantification Theory Type 1, but has a larger application area (Inuiguchi, 2001). This is because Rough-Sets Theory has no minimal requirements regarding number of samples, etc. The product attributes are treated as in Quantification Theory Type 1, but the Kansei ratings preferably be made on a three grade scale. This is because the interpretation becomes more complex with more sets for each dependent variable. For example: Schulte (2005) uses this theory on watches. The product samples are rated on a three grade scale. The value of one is “not”, two is “neutral” and three is “yes”. Here are the results of ratings for the Kansei word classic. The example may seem trivial, but is a simple explanation of the theory. Set 1 is associated with the property combinations: • Combined dial and round • Digital • Plastic Meaning watches that have a combination of these properties are perceived as “not classic” Set 2 is associated with the combinations: • Analogue and dark display • Analogue and round Watches with these properties are perceived as classic. Set 3 is the in-between case: • Combined display and rectangular shape This set is neither classic nor not classic. This interpretation is complicated. It seems that people have no idea about this concept. More sets would have resulted in even more complicated results. In the following we illustrate some concepts of Rough-Sets Theory. They are reduct attributes, discernibility and approximation spaces (Mori, 2002).. - 16 -.
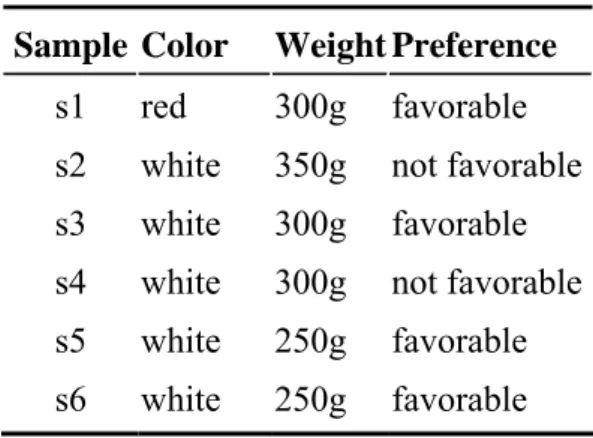
(19) ● Information table Let us consider a simple example shown in Table 2-1, in which we consider attributes of 6 coffee cups artificially:. {Color , Inside, Pattern, Mouth, Handle,Volume,Weight} The last column of Table 2-1 shows the preference of a person for the cups. The attribute values are transformed into symbols as shown in Table 2-2.. Table 2-1: Attribute information table of the coffee cups Condition Attributes Sample Color. Decision Attributes. Inside. Pattern Mouth Handle Volume Weight Preference. s1. red. white. figure. circular vertical medium 300g. favorable. s2. white. white. plant. circular sideways large. not favorable. s3. white. white. plant. circular vertical medium 300g. favorable. s4. white. white. plant. circular vertical medium 300g. not favorable. s5. white. white. figure. circular sideways small. 250g. favorable. s6. white. white. animal. circular sideways small. 250g. favorable. 350g. Table 2-2: Translation into symbols 1 Sample. A. B. C. D. E. F. G. Y. s1. A4. B4. C4. D1. E1. F2. G4. 1. s2. A2. B4. C1. D1. E2. F3. G5. 2. s3. A2. B4. C1. D1. E1. F2. G4. 1. s4. A2. B4. C1. D1. E1. F2. G4. 2. s5. A2. B4. C4. D1. E2. F1. G3. 1. s6. A2. B4. C3. D1. E2. F1. G3. 1. - 17 -.
(20) ● Approximation In the above case, the objects in the universe are a set of all samples: S= {s1, s 2, s3, s 4, s5, s 6} Denote by D a decision class, the set of samples which are favorable: D= {s1, s3, s5, s 6} When using the set of all attributes: AT= {color , inside, pattern, mouth, handle, volume, weight } We find the equivalence class or the basic set: R= {{s1}, {s 2}, {s3, s 4}, {s5}, {s 6}} This is the samples s3 and s4 cannot be distinguished with the attribute set AT. The lower approximation set is the union of all the equivalence classes that are fully contained in D. The upper approximation set is the union of all equivalence classes that intersect D. In this case, the lower approximation set L (D) of the decision class D means that the values of attributes in L (D) necessarily distinguish the decision class D: L (D) = {s ∈ S | R[e] ⊆ D} = {s1, s5, s 6} Here R[e] indicates any element set in R. On the other hand the upper approximation set U (D) of the decision class D means that the values of attributes in U (D) possibly distinguish the decision class D: U (D) = {s ∈ S | R[e] I D ≠φ} = {s1, s3, s5, s 6}. - 18 -.
(21) ● Discernibility A discernibility matrix means that each element of this matrix indicates the attributes which distinguish two samples. For the present case it is shown in Table 2-3, in which AC means A or C, for instance. Note that pairs of samples which should be distinguished are only considered here; the elements of pairs in the same decision class are indicated by an asterisk in Table 2-3. Table 2-3: Discernibility Matrix sample. 1. 2. 3. 4. 5. s1. *. s2. ACEFG. *. s3. *. EFG. *. s4. AC. *. Φ. *. s5. *. CFG. *. CEFG. *. s6. *. CFG. *. CEFG. *. 6. *. Now we consider distinguishing all samples using the attributes. For this we take the intersection of all elements in Table 2-3:. ( A ∨ C ∨ E ∨ F ∨ G ) ∧ ( A ∨ C ) ∧ (E ∨ F ∨ G ) ∧ (C ∨ F ∨ G ) ∧ (C ∨ E ∨ F ∨ G ) = ( A ∨ C ) ∧ (E ∨ F ∨ G ) ∧ (C ∨ F ∨ G ) = ( A ∨ C ) ∧ [E ∧ C ∨ E ∧ (F ∨ G ) ∨ (F ∨ G ) ∧ C ∨ (F ∨ G )] = ( A ∨ C ) ∧ [E ∧ C ∨ (F ∨ G )] = (C ∧ E ) ∨ ( A ∧ F ) ∨ ( A ∧ G ) ∨ (C ∧ F ) ∨ (C ∧ G ) We can shorten the information table into some simple ones which have the same meaning as the original one shown in Table 2-4 to Table 2-8. Using the lower approximation, we read these tables, for example, If (Pattern=figure) and (Handle=vertical) Then (Preference=favorable). If (Pattern=plant) and (Handle=vertical) Then (Preference=favorable). If (Pattern=figure) and (Handle=sideways) Then (Preference=favorable).. - 19 -.
(22) Table 2-4: Information table of “CE” Sample Pattern Handle. Preference. s1. figure. vertical. favorable. s2. plant. sideways not favorable. s3. plant. vertical. favorable. s4. plant. vertical. not favorable. s5. figure. sideways favorable. s6. animal sideways favorable. Table 2-5: Information table of “AF” Sample Color. Volume Preference. s1. red. medium favorable. s2. white. large. s3. white. medium favorable. s4. white. medium not favorable. s5. white. small. favorable. s6. white. small. favorable. not favorable. Table 2-6: Information table of “AG” Sample Color. Weight Preference. s1. red. 300g. favorable. s2. white. 350g. not favorable. s3. white. 300g. favorable. s4. white. 300g. not favorable. s5. white. 250g. favorable. s6. white. 250g. favorable. - 20 -.
(23) Table 2-7: Information table of “CF” Sample Pattern Volume Preference s1. figure. medium favorable. s2. plant. large. s3. plant. medium favorable. s4. plant. medium not favorable. s5. figure. small. favorable. s6. animal small. favorable. not favorable. Table 2-8: Information table of “CG” Sample Pattern Weight Preference s1. figure. 300g. favorable. s2. plant. 350g. not favorable. s3. plant. 300g. favorable. s4. plant. 300g. not favorable. s5. figure. 250g. favorable. s6. animal 250g. favorable. ● Minimal rules Next we will shorten the rules using the above tables. Here is an example using the table “C and F” (see Table 2-7). Table 2-9 shows the translation into symbols and Table 2-10 is the decision matrix, in which the samples of lower approximation are located in rows and the samples in other decision class (not favorable) are located in columns, and the elements of matrix is given by the attribute values of samples in the lower approximation, which differentiate the pairs of samples.. - 21 -.
(24) Table 2-9: Translation into symbols 2 Sample. C. F. Y. s1. C4. F2. 1. s2. C1. F3. 2. s3. C1. F2. 1. s4. C1. F2. 2. s5. C4. F1. 1. s6. C3. F1. 1. Table 2-10: Decision Matrix Y=2 s2. s4. s1. C4 or F2. C4. s5. C4 or F1. C4 or F1. s6. C3 or F1. C3 or F1. L(D). From Table 2-10 we can understand that the attribute C distinguish sample s1 from s2 and s4. In this way we can reduce 6 long rules into 3 short ones which have the same meaning as the original ones. From Table 2-10 we can obtain: s1: (C 4 ∨ F 2 ) ∧ C 4 = C 4 s5: (C 4 ∨ F1) ∧ (C 4 ∨ F1) = (C 4 ∨ F1) s6: (C 3 ∨ F1) ∧ (C 3 ∨ F1) = (C 3 ∨ F1) As there is a relationship “and” between s2 and s4, a relationship “or” among s1, s5 and s6, we describe the relationship using this formula:. - 22 -.
(25) s1行 ∨ s5行 ∨ s 6行 = C 4 ∨ C 3 ∨ F1 Rule 1: “If C4 Then favorable”: If (Pattern=figure) Then (Preference=favorable). Rule 2: “If F1 Then favorable”: If (Volume=small) Then (Preference=favorable). Rule 3: “If C3 Then favorable”: If (Pattern=animal) Then (Preference=favorable).. ● CI value In the field of Kansei Engineering, the most used concept is “decisive rule”. Within the plural rules, if we know which one is more important, and how much it is important then maybe it is more helpful to do the data analysis. So CI value is an important yardstick to judge the importance of each rule. In other words, CI value is a result from dividing (the samples which is applicable to the rule) plus (the number of the samples which are not applicable to the rule) with (the number of the samples which are applicable to the rule). See Table 2-11. As U (D )= {s ∈ S | R[e] I D ≠φ} = {s1, s3, s5, s 6} , so there are 4 samples in the decision class Y=1. As samples s1 and s5 are applicable to the rule C4, so the CI value of rule C4 is 2/4=0.5. Similarly, the CI value of rule F1 is 2/4=0.5 and the CI value of rule C3 is 1/4=0.25. Table 2-11: CI value when preference is “favorable” Y=1 Preference =favorable Rule 1 Rule 2 Rule 3. s1. s5. s6. CI. ○. ○. ×. 0.5. ×. ○. ○. 0.5. ×. ×. ○. 0.25. - 23 -.
(26) 2.4 Kansei Evaluation This section introduces two reports about Kansei Evaluation. They are: “Kansei Data Analysis and Traditional Crafts Evaluation in JAIST (Nakamori, 2008)” and “Report of Modeling the Evaluation Structure of Kansei in TSUKUBA University (Harada, 1999)”. Here we call them “Report in JAIST” and “Report in TSUKUBA”. A summary of report in JAIST: In order to revive traditional technical industry, various works have been done. As one city area industry-university-government cooperation promotion business, the “gain new insights by studying the past” project started. Its purpose is to revival the value of traditional technical art, using high technology and new methods (Nakamori, 2008). They did many research studies in the fields shown below: ●Kansei evaluation experiment using traditional crafts ●Construction of evaluation system ●Design of evaluation experiment ●Questionnaire making ●Data analysis using factor analysis and fuzzy analysis A summary of report in TSUKUBA: To investigate the sensory behavior of humans, the special project of TSUKUBA University focuses on how people view works of art. Plans were made to conduct an experiment in which actual works of art, design, etc., would be viewed from a distant location using the Internet to remotely control a robot equipped with a video camera, The data derived from this experiment were then stored in a server. These data included information on emotional changes in humans during appreciation of works of art. The purpose of Harada’s study is to analyze these art evaluation data in order to come up with a means for modeling the psychological and emotional behavior of people in appreciation of art (Harada, 1999).. - 24 -.
(27) Chapter 3 Data Collection. In chapter 3, we give some introduction about a Kansei Evaluation experiment carried on in May, 2009 to asses how people feel about the Kutani-ware coffee cups. In the experiment we used 10 prepared adjective pairs such as “simple-compound, pretty-austere” and the semantic differential method with 7 grades. At the same time we collected the feeling of participants whether they want to use them as gift or themselves to explore the relationship between such feeling and Kansei evaluation with words.. - 25 -.
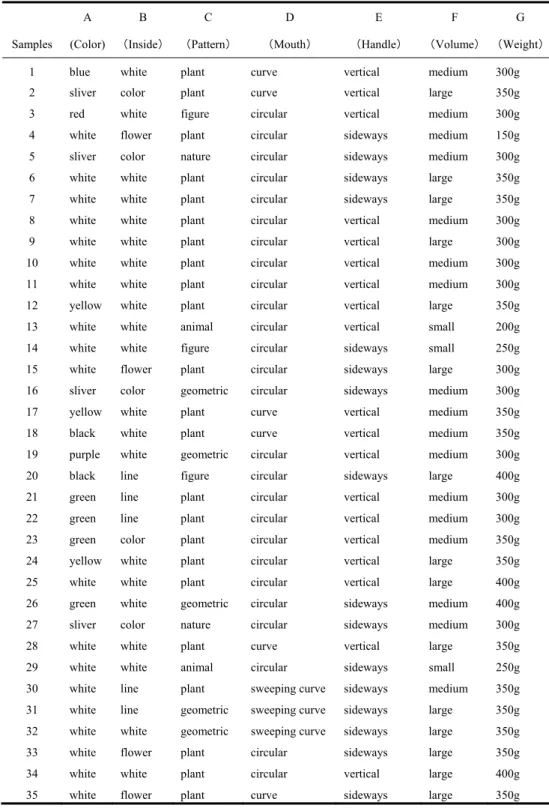
(28) 3.1 Samples Used in the Evaluation Experiment To know the customers’ feeling, an evaluation experiment is necessity. It is convenient that we have some Kutani-ware coffee cups in our Lab, and here we show the pictures of them in Fig.3-1. Here is the data of the experiment: Data: May, 18th, 2009 Place: Lecture room 1, JAIST Examinee: 45 master course students in JAIST Objects: 35 Kutani-ware coffee cups (see Fig.3-1). 1 (4). 2 (3). 3 (4). 4 (5). 5 (5). 6 (5). 7 (2). 8 (5). 9 (5). 10 (4). 11 (4). 12 (4). 13 (4). 14 (5). 15 (2). 16 (2). 17 (2). 18 (2). 19 (2). 20 (2). 21 (2). 22 (4). 23 (2). 24 (2). 25 (2). 26 (2). 27 (2). 28 (2). 29 (2). 30 (2). 31 (2). 32 (2). 33 (2). 34 (2). 1 35 (2). Fig.3-1: Objects used in the experiment Before doing the experiment, we should organize the data of the samples. Table 3-1 shows the physical data of samples. In order to make the data analysis easier to be understood, we translated physical data into symbols as shown in Table 3-2. According to the above table, we can describe cup number 35 as follows: “the color is white, the inside shows a flower, the pattern is plant, the mouth is curvilinear, the handle is sideways, the volume is large and the weight is 350g”, which is represented by “A2B2C1D2E2F3G5”.. - 26 -.
(29) Table 3-1: The original physical data of the samples A. B. C. D. E. F. G. (Color). (Inside). (Pattern). (Mouth). (Handle). (Volume). (Weight). 1. blue. white. plant. curve. vertical. medium. 300g. 2. sliver. color. plant. curve. vertical. large. 350g. Samples. 3. red. white. figure. circular. vertical. medium. 300g. 4. white. flower. plant. circular. sideways. medium. 150g. 5. sliver. color. nature. circular. sideways. medium. 300g. 6. white. white. plant. circular. sideways. large. 350g. 7. white. white. plant. circular. sideways. large. 350g. 8. white. white. plant. circular. vertical. medium. 300g. 9. white. white. plant. circular. vertical. large. 300g. 10. white. white. plant. circular. vertical. medium. 300g. 11. white. white. plant. circular. vertical. medium. 300g. 12. yellow. white. plant. circular. vertical. large. 350g. 13. white. white. animal. circular. vertical. small. 200g. 14. white. white. figure. circular. sideways. small. 250g. 15. white. flower. plant. circular. sideways. large. 300g. 16. sliver. color. geometric. circular. sideways. medium. 300g. 17. yellow. white. plant. curve. vertical. medium. 350g. 18. black. white. plant. curve. vertical. medium. 350g. 19. purple. white. geometric. circular. vertical. medium. 300g. 20. black. line. figure. circular. sideways. large. 400g. 21. green. line. plant. circular. vertical. medium. 300g. 22. green. line. plant. circular. vertical. medium. 300g. 23. green. color. plant. circular. vertical. medium. 350g. 24. yellow. white. plant. circular. vertical. large. 350g. 25. white. white. plant. circular. vertical. large. 400g. 26. green. white. geometric. circular. sideways. medium. 400g. 27. sliver. color. nature. circular. sideways. medium. 300g. 28. white. white. plant. curve. vertical. large. 350g. 29. white. white. animal. circular. sideways. small. 250g. 30. white. line. plant. sweeping curve. sideways. medium. 350g. 31. white. line. geometric. sweeping curve. sideways. large. 350g. 32. white. white. geometric. sweeping curve. sideways. large. 350g. 33. white. flower. plant. circular. sideways. large. 350g. 34. white. white. plant. circular. vertical. large. 400g. 35. white. flower. plant. curve. sideways. large. 350g. - 27 -.
(30) Table 3-2: The simplified physical data of the samples A. B. C. D. E. F. G. Samples. (Color). (Inside). (Pattern). (Mouth). (Handle). (Volume). (Weight). 1. A7. B4. C1. D3. E1. F2. G4. 2. A8. B3. C1. D3. E1. F3. G5. 3. A4. B4. C4. D1. E1. F2. G4. 4. A2. B2. C1. D1. E2. F2. G1. 5. A8. B3. C2. D1. E2. F2. G4. 6. A2. B4. C1. D1. E2. F3. G5. 7. A2. B4. C1. D1. E2. F3. G5. 8. A2. B4. C1. D1. E1. F2. G4. 9. A2. B4. C1. D1. E1. F3. G4. 10. A2. B4. C1. D1. E1. F2. G4. 11. A2. B4. C1. D1. E1. F2. G4. 12. A5. B4. C1. D1. E1. F3. G5. 13. A2. B4. C3. D1. E1. F1. G2. 14. A2. B4. C4. D1. E2. F1. G3. 15. A2. B2. C1. D1. E2. F3. G4. 16. A8. B3. C5. D1. E2. F2. G4. 17. A5. B4. C1. D3. E1. F2. G5. 18. A1. B4. C1. D3. E1. F2. G5. 19. A6. B4. C5. D1. E1. F2. G4. 20. A1. B1. C4. D1. E2. F3. G6. 21. A3. B1. C1. D1. E1. F2. G4. 22. A3. B1. C1. D1. E1. F2. G4. 23. A3. B3. C1. D1. E1. F2. G5. 24. A5. B4. C1. D1. E1. F3. G5. 25. A2. B4. C1. D1. E1. F3. G6. 26. A3. B4. C5. D1. E2. F2. G6. 27. A8. B3. C2. D1. E2. F2. G4. 28. A2. B4. C1. D3. E1. F3. G5. 29. A2. B4. C3. D1. E2. F1. G3. 30. A2. B1. C1. D2. E2. F2. G5. 31. A2. B1. C5. D2. E2. F3. G5. 32. A2. B4. C5. D2. E2. F3. G5. 33. A2. B2. C1. D1. E2. F3. G5. 34. A2. B4. C1. D1. E1. F3. G6. 35. A2. B2. C1. D3. E2. F3. G5. - 28 -.
(31) 3.2 Evaluation Sheet. Evaluation experiment(2009.5.14) Coffee cup No. 1. 2. simple ceremonious. 3. 4. ). name( Coffee cup No.. 5. 6. 7. 1. 2. 3. 4. 5. simple. rich. ceremonious. fun. 6. 7. rich fun. serene. powerful. serene. powerful. carousing. stillness. carousing. stillness. pretty hard. pretty. austere. hard. soft. austere soft. flowery. quiet. flowery. quiet. delicate. large-hearted. delicate. large-hearted. pithy reserved. will not use as gift. will not use oneself. pithy. gentle. reserved. imperious. use as gift. use oneself. will not use as a gift. will not use oneself. gentle imperious. use as gift. use oneself. Fig.3-2: Questionnaire used in the experiment We gave each student 9 both sides printed questionnaire sheets shown in Fig.3-2. We take cup NO.1 as an example. If they think the cup is simple, they can check the points from 1 to 3, and if they think the cup is rich, they can check the point from 5 to 7. If they can not decide or they have a neutral attitude, they can check point 4. They can evaluate 4 cups using 1 questionnaire sheet. We also divided the 35 coffee cups into 5 groups from A group to E group, and the 45 participants into 5 groups from 1 group to 5 group. They keep moving during the whole experiment in a way shown in Fig.3-3:. - 29 -.
(32) 18. 19. 17. 20 16. 15. 21. C group 25. 11. 26. 24. 27 23. 22. 12. 10. 13 9. 28. D group. 8. 14. B group. E group 32. A group 33. 31. 4 34. 30. 29. 5. 3. 35. 6 2. 1. 7. Fig.3-3: The way of moving in the experiment We also took some pictures during the evaluation experiment, and we just show some of them here in Fig.3-4:. Fig.3-4: Pictures of the experiment. - 30 -.
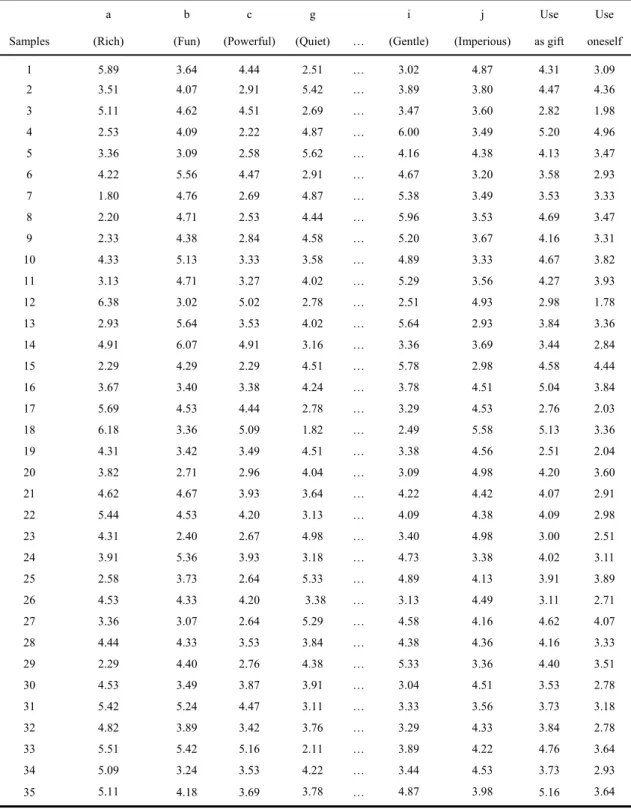
(33) 3.3 Summary of the Data To know all the examinees’ feeling, the average data is better than the separate data. So we show the average data from the experiment in Table 3-3 and Table 3-4. Table 3-3: The average data from the experiment a. b. c. g. Samples. (Rich). (Fun). (Powerful). (Quiet). 1. 5.89. 3.64. 4.44. 2.51. i. j. Use. Use. …. (Gentle). (Imperious). as gift. oneself. …. 3.02. 4.87. 4.31. 3.09. 2. 3.51. 4.07. 2.91. 5.42. …. 3.89. 3.80. 4.47. 4.36. 3. 5.11. 4.62. 4.51. 2.69. …. 3.47. 3.60. 2.82. 1.98. 4. 2.53. 4.09. 2.22. 4.87. …. 6.00. 3.49. 5.20. 4.96. 5. 3.36. 3.09. 2.58. 5.62. …. 4.16. 4.38. 4.13. 3.47. 6. 4.22. 5.56. 4.47. 2.91. …. 4.67. 3.20. 3.58. 2.93. 7. 1.80. 4.76. 2.69. 4.87. …. 5.38. 3.49. 3.53. 3.33. 8. 2.20. 4.71. 2.53. 4.44. …. 5.96. 3.53. 4.69. 3.47. 9. 2.33. 4.38. 2.84. 4.58. …. 5.20. 3.67. 4.16. 3.31. 10. 4.33. 5.13. 3.33. 3.58. …. 4.89. 3.33. 4.67. 3.82. 11. 3.13. 4.71. 3.27. 4.02. …. 5.29. 3.56. 4.27. 3.93. 12. 6.38. 3.02. 5.02. 2.78. …. 2.51. 4.93. 2.98. 1.78. 13. 2.93. 5.64. 3.53. 4.02. …. 5.64. 2.93. 3.84. 3.36. 14. 4.91. 6.07. 4.91. 3.16. …. 3.36. 3.69. 3.44. 2.84. 15. 2.29. 4.29. 2.29. 4.51. …. 5.78. 2.98. 4.58. 4.44. 16. 3.67. 3.40. 3.38. 4.24. …. 3.78. 4.51. 5.04. 3.84. 17. 5.69. 4.53. 4.44. 2.78. …. 3.29. 4.53. 2.76. 2.03. 18. 6.18. 3.36. 5.09. 1.82. …. 2.49. 5.58. 5.13. 3.36. 19. 4.31. 3.42. 3.49. 4.51. …. 3.38. 4.56. 2.51. 2.04. 20. 3.82. 2.71. 2.96. 4.04. …. 3.09. 4.98. 4.20. 3.60. 21. 4.62. 4.67. 3.93. 3.64. …. 4.22. 4.42. 4.07. 2.91. 22. 5.44. 4.53. 4.20. 3.13. …. 4.09. 4.38. 4.09. 2.98. 23. 4.31. 2.40. 2.67. 4.98. …. 3.40. 4.98. 3.00. 2.51. 24. 3.91. 5.36. 3.93. 3.18. …. 4.73. 3.38. 4.02. 3.11. 25. 2.58. 3.73. 2.64. 5.33. …. 4.89. 4.13. 3.91. 3.89. 26. 4.53. 4.33. 4.20. 3.38. …. 3.13. 4.49. 3.11. 2.71. 27. 3.36. 3.07. 2.64. 5.29. …. 4.58. 4.16. 4.62. 4.07. 28. 4.44. 4.33. 3.53. 3.84. …. 4.38. 4.36. 4.16. 3.33. 29. 2.29. 4.40. 2.76. 4.38. …. 5.33. 3.36. 4.40. 3.51. 30. 4.53. 3.49. 3.87. 3.91. …. 3.04. 4.51. 3.53. 2.78. 31. 5.42. 5.24. 4.47. 3.11. …. 3.33. 3.56. 3.73. 3.18. 32. 4.82. 3.89. 3.42. 3.76. …. 3.29. 4.33. 3.84. 2.78. 33. 5.51. 5.42. 5.16. 2.11. …. 3.89. 4.22. 4.76. 3.64. 34. 5.09. 3.24. 3.53. 4.22. …. 3.44. 4.53. 3.73. 2.93. 35. 5.11. 4.18. 3.69. 3.78. …. 4.87. 3.98. 5.16. 3.64. - 31 -.
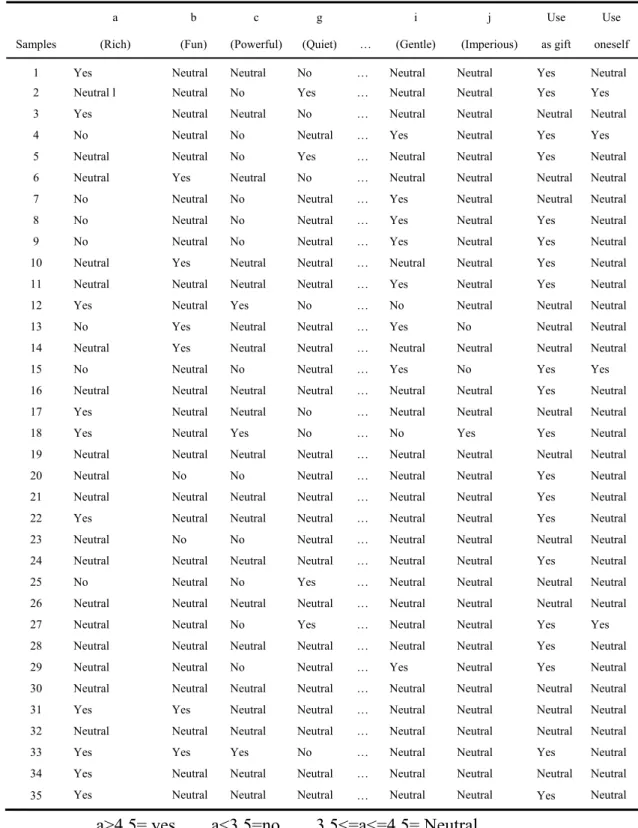
(34) Table 3-4: A translation of the average data. Samples. a. b. c. g. (Rich). (Fun). (Powerful). (Quiet). …. i. j. Use. Use. (Gentle). (Imperious). as gift. oneself. 1. Yes. Neutral. Neutral. No. …. Neutral. Neutral. Yes. Neutral. 2. Neutral l. Neutral. No. Yes. …. Neutral. Neutral. Yes. Yes. 3. Yes. Neutral. Neutral. No. …. Neutral. Neutral. Neutral. Neutral. 4. No. Neutral. No. Neutral. …. Yes. Neutral. Yes. Yes. 5. Neutral. Neutral. No. Yes. …. Neutral. Neutral. Yes. Neutral. 6. Neutral. Yes. Neutral. No. …. Neutral. Neutral. Neutral. Neutral. 7. No. Neutral. No. Neutral. …. Yes. Neutral. Neutral. Neutral. 8. No. Neutral. No. Neutral. …. Yes. Neutral. Yes. Neutral. 9. No. Neutral. No. Neutral. …. Yes. Neutral. Yes. Neutral. 10. Neutral. Yes. Neutral. Neutral. …. Neutral. Neutral. Yes. Neutral. 11. Neutral. Neutral. Neutral. Neutral. …. Yes. Neutral. Yes. Neutral. 12. Yes. Neutral. Yes. No. …. No. Neutral. Neutral. Neutral. 13. No. Yes. Neutral. Neutral. …. Yes. No. Neutral. Neutral. 14. Neutral. Yes. Neutral. Neutral. …. Neutral. Neutral. Neutral. Neutral. 15. No. Neutral. No. Neutral. …. Yes. No. Yes. Yes. 16. Neutral. Neutral. Neutral. Neutral. …. Neutral. Neutral. Yes. Neutral. 17. Yes. Neutral. Neutral. No. …. Neutral. Neutral. Neutral. Neutral. 18. Yes. Neutral. Yes. No. …. No. Yes. Yes. Neutral. 19. Neutral. Neutral. Neutral. Neutral. …. Neutral. Neutral. Neutral. Neutral. 20. Neutral. No. No. Neutral. …. Neutral. Neutral. Yes. Neutral. 21. Neutral. Neutral. Neutral. Neutral. …. Neutral. Neutral. Yes. Neutral. 22. Yes. Neutral. Neutral. Neutral. …. Neutral. Neutral. Yes. Neutral. 23. Neutral. No. No. Neutral. …. Neutral. Neutral. Neutral. Neutral. 24. Neutral. Neutral. Neutral. Neutral. …. Neutral. Neutral. Yes. Neutral. 25. No. Neutral. No. Yes. …. Neutral. Neutral. Neutral. Neutral. 26. Neutral. Neutral. Neutral. Neutral. …. Neutral. Neutral. Neutral. Neutral. 27. Neutral. Neutral. No. Yes. …. Neutral. Neutral. Yes. Yes. 28. Neutral. Neutral. Neutral. Neutral. …. Neutral. Neutral. Yes. Neutral. 29. Neutral. Neutral. No. Neutral. …. Yes. Neutral. Yes. Neutral. 30. Neutral. Neutral. Neutral. Neutral. …. Neutral. Neutral. Neutral. Neutral. 31. Yes. Yes. Neutral. Neutral. …. Neutral. Neutral. Neutral. Neutral. 32. Neutral. Neutral. Neutral. Neutral. …. Neutral. Neutral. Neutral. Neutral. 33. Yes. Yes. Yes. No. …. Neutral. Neutral. Yes. Neutral. 34. Yes. Neutral. Neutral. Neutral. …. Neutral. Neutral. Neutral. Neutral. 35. Yes. Neutral. Neutral. Neutral. …. Neutral. Neutral. Yes. Neutral. a>4.5= yes. a<3.5=no. 3.5<=a<=4.5= Neutral. Similarly, in order to make the table simpler, we simplified it as shown in Table 3-5.. - 32 -.
(35) Table 3-5: Another translation of the average data a. b. c. g. i. j. Use. Use. Samples. (Rich). (Fun). (Powerful). (Quiet). …. (Gentle). (Imperious). as gift. oneself. 1. a1. b2. c2. 2. a2. b2. c3. g3. …. i2. j2. 1. 2. g1. …. i2. j2. 1. 1. 3. a1. b2. 4. a3. b2. c2. g3. …. i2. j2. 2. 2. c3. g2. …. i1. j2. 1. 1. 5. a2. 6. a2. b2. c3. g1. …. i2. j2. 1. 2. b1. c2. g3. …. i2. j2. 2. 2. 7 8. a3. b2. c3. g2. …. i1. j2. 2. 2. a3. b2. c3. g2. …. i1. j2. 1. 2. 9. a3. b2. c3. g2. …. i1. j2. 1. 2. 10. a2. b1. c2. g2. …. i2. j2. 1. 2. 11. a2. b2. c2. g2. …. i1. j2. 1. 2. 12. a1. b2. c1. g3. …. i3. j2. 2. 2. 13. a3. b1. c2. g2. …. i1. j3. 2. 2. 14. a2. b1. c2. g2. …. i2. j2. 2. 2. 15. a3. b2. c3. g2. …. i1. j3. 1. 1. 16. a2. b2. c2. g2. …. i2. j2. 1. 2. 17. a1. b2. c2. g3. …. i2. j2. 2. 2. 18. a1. b2. c1. g3. …. i3. j1. 1. 2. 19. a2. b2. c2. g2. …. i2. j2. 2. 2. 20. a2. b3. c3. g2. …. i2. j2. 1. 2. 21. a2. b2. c2. g2. …. i2. j2. 1. 2. 22. a1. b2. c2. g2. …. i2. j2. 1. 2. 23. a2. b3. c3. g2. …. i2. j2. 2. 2. 24. a2. b1. c2. g2. …. i2. j2. 1. 2. 25. a3. b2. c3. g1. …. i2. j2. 2. 2. 26. a2. b2. c2. g2. …. i2. j2. 2. 2. 27. a2. b2. c3. g1. …. i2. j2. 1. 1. 28. a2. b2. c2. g2. …. i2. j2. 1. 2. 29. a3. b2. c3. g2. …. i1. j2. 1. 2. 30. a2. b2. c2. g2. …. i2. j2. 2. 2. 31. a1. b1. c2. g2. …. i2. j2. 2. 2. 32. a2. b2. c2. g2. …. i2. j2. 2. 2. 33. a1. b1. c1. g3. …. i2. j2. 1. 2. 34. a1. b2. c2. g2. …. i2. j2. 2. 2. 35. a1. b2. c2. g2. …. i2. j2. 1. 2. According to the Table 3-5, we can describe cup number 35, which is “rich, fun or not fun, powerful or not powerful, quiet or not quiet…gentle or not gentle, imperious or not imperious, will use as gift and will or will not use oneself” like “a1b2c2d2…i2j2”.. - 33 -.
(36) Chapter 4 Data Analysis. In chapter 4, we propose a new method to analyze the data we got from the experiment and we perform both Factor Analysis and Rough-sets Analysis to do a comparison. Through Factor Analysis we explore the styles of the coffee cups that people prefer to use themselves, or to give to others as gifts. Through Rough-sets Analysis we aim to identify the relationship between the physical data of the samples and the preferences of the customers to do new recommendations. Fortunately, we found some new rules and we will use it to do new recommendations and support for designers of Kutani-ware.. - 34 -.
(37) 4.1 Findings by Factor Analysis. The Explorative Factor Analysis is most commonly used because it matches the purpose of finding the Kansei structure better than Confirmative Analysis (Dillon, 1984). This section introduces the software named SPSS. SPSS(Statistical Package for Social Science)is a software which is best utilized in order to analyze the social investigation data. It is much more reliable and easy to use than Excel. Here we explore the styles of the coffee cups that people prefer to use themselves, or to give to others as gifts. We performed Factor Analysis using the software SPSS and the process of Factor Analysis shown as follows: First, A Factor Analysis reduces a large number of variables into a smaller number of groups, in order to describe the 10 Kansei words by one word or two words, we must find the factors. We input Table 3-3 shown in Fig.4-1 and click Factor (F) button shown in Fig.4-2.. Fig.4-1: Input table for SPSS analysis. - 35 -.
(38) Fig.4-2: Factor Analysis Step 1 Then, we put the 10 Kansei words into the Variable box shown in Fig.4-3, set the dialogue box shown as Fig.4-4 and click OK button to start the analysis. The result is shown in Fig.4-5.. Fig.4-3: Factor Analysis Step 2. - 36 -.
(39) Fig.4-4: Factor Analysis Step 3. Fig.4-5: Factor Analysis Result 1 From Fig.4-5 we can identify Factor 1 and Factor 2 as this: Factor 1 has a meaning which is close to “powerful” and “rich” but opposite to “quiet” and “stillness”. Similarly, Factor 2 has a meaning which is close to “austere” and “imperious” but opposite to “fun” and “soft”.. - 37 -.
(40) In order to know the styles of the coffee cups that people prefer to use themselves, or to give to others as gifts, we must performed Correlation Analysis. We set the dialogue box shown in Fig.4-6, put “use as gift”, “use oneself”, “Factor 1” and “Factor 2” into the Variable box shown in Fig.4-7 and click OK to start the analysis. The result is shown in Fig.4-8.. Fig.4-6:. Factor Analysis Step 4. Fig.4-7: Factor Analysis Step 5. - 38 -.
(41) Fig.4-8: Factor Analysis Result 2 From Fig.4-8 we can see the correlation coefficient between Factor 1 and preference “use as gift” is “-0.338” , and the one between Factor 1 and preference “use oneself” is “-0.585”, so we can say the cups which people prefer to use as gift, or use themselves have an opposite image to Factor 1. Similarly, the correlation coefficient between Factor 2 and preference “use as gift” is “0.230”, and the one between Factor 2 and preference “use oneself” is “-0.324”, so we can say people prefer to use the cups as gift which have a same image with Factor 2, but prefer to use the cups themselves which have an opposite image to Factor 2.. - 39 -.
(42) 4.2 Findings by Rough-Sets Theory Through Factor Analysis, we can only identify the relationship identification between the words and the samples. Sometimes customers want a new cup which has same color as sample 1, same inside as sample 19, same mouth as sample 35. So it is necessary to identify the relationship identification between the physical data of the samples and the preferences of the customers. We used Rough-Sets Theory as showing in the next section, and we made new recommendations from the samples. There is a particular introduction on Rough-Sets Theory in section 2.3, and you can see the mathematics process is very complex. So we must use software for convenience. This section also introduces software frequently used in Rough Sets analysis, which is developed by HOLON CREATE Inc. We performed Rough Sets Analysis using the software as shown bellow. Relationship identification between product and feeling using the former method is shown in Fig.4-9. Rough-Sets Theory can also do this. So we identified the relationship between the physical data and the evaluation data using the software of Rough-Sets Theory and the results are shown in Fig.4-10:. Physical Data of the Samples. P. Evaluation of customers’. Relationship Identification. E. Fig.4-9: Relationship Identification between P and E. - 40 -.
(43) Fig.4-10: Output rules 1 Through Relationship Identification between Physical data and Evaluation data using the former method, we got a lot of rules: If (Pattern=plant) and (Weight=300g) Then (Preference=use as gift) If (Color=White) and (Weight=300g) Then (Preference=use as gift) If (Color=sliver) Then (Preference=use as gift) If (Weight=150g) Then (Preference=use oneself) If (Color=sliver) and (Mouth=curve) Then (Preference=use oneself) If (Color=sliver) and (Handle=vertical) Then (Preference=use oneself). - 41 -.
(44) Through the rules we can see the disadvantages like these: First, there is no new rule! Second, there is no straight relationship with Kansei! Third, there is no particular information about the rules. For example, we take the rule “A2G4” in Fig.4-10 to do explanations. In fact, the rule “A2G4” is equal to “A2BxCyDzEmFnG4”, so there are too much things un-known! If we know more, we can get much more information and we can know better about the samples. By now we identified the relationship with the usual method. In order to make people's choice closer to their perception, simultaneously in order to obtain the new deduction, we combined the Kansei data into the entire analysis process. Like our new method shown next page, we have constructed a triangle which is composed of the physical data, the Kansei data and the customers’ preferences. Here we propose the new method to solve the questions above. The new method is easy to understand. For example, student A, student B and student C are in the same school. Because the school is too big, they do not have a good communication space, so they have a relationship like this: A and B are good friends, A and C are friends, but B and C are strangers! It is so easy to know that B and C are schoolmates! And student A is the intermediary between B and C. In our thesis, we use the Kansei data from the experiment as the intermediary in order to identify the relationship between the physical data of the examples and the preferences of the examinees’ in three steps:. - 42 -.
(45) First step we perform relationship identification between P and K shown in Fig.4-11 and the results are shown in Fig.4-12.. Kansei Data from the Experiment. K 1 Relationship Identification Physical Data of the Samples. Evaluation of customers’. E. P. Fig.4-11: Relationship Identification between P and K. Fig.4-12: Output rules 2. - 43 -.
(46) See Fig.4-12. These are the results of words “powerful” and “not powerful”. The first column on the left is the rule, the second one is the CI, and the third one is the suitable sample. The column is in CI order. We would like to give you a particular explanation. The highest score of CI about the word “powerful” is 0.272727, and the suitable rules are “D3F2”. Similarly the highest score of CI about the word “not powerful” is 0.333333, and the suitable rules are “A2E1”. Because there are too many Kansei words, there are too many rules so we just selected the top rules from the CI for our analysis. We analyzed all the words and we put all the rules in the Appendix. We just write a few of them down here: If (Mouth=curve) and (Volume= medium) Then (Preference=powerful) If (Inside=white) and (Pattern=figure) Then (Preference=powerful) If (Inside=white) and (Volume=medium) and (Weight=350g) Then (Preference=powerful) If (Color=white) and (Handle=vertical) then (Preference=not powerful) If (Inside=color) Then (Preference=not powerful) If (Color=white) and (Volume=medium) Then (Preference=not powerful). - 44 -.
(47) Second step, we perform relationship identification between K and E shown in Fig.4-13 and the results are shown in Fig.4-14.. Kansei Data from the Experiment. K. 2. Relationship Identification Physical Data of the Samples. Evaluation of customers’. E. P. Fig.4-13: Relationship Identification between K and E. Fig.4-14: Output rules 3. - 45 -.
(48) Here we also have a lot of rules, and we will just give you an example in the figure above. See Fig.4-14. These are the results of preferences “use oneself” and “use as gift”. The first column on the left is the rule, the second one is the CI, and the third one is the suitable sample. The row is in CI order. We would like to give you a particular explanation. The highest score of CI about the preference “use as gift” is 0.400000, and the suitable rules are “e3h3 and fih3”. Similarly the highest score of CI about the preference “use oneself” is 0.500000 and the suitable rules are”g1h3j3 and b2g1j3”. We just selected the top scores of the CI for my analysis. We put all the rules in the appendix. We just write some down here: When preference is “use as gift”, the highest CI value is 0.4, and the rules are “e3h3” and “f1h3”: If (not austere) and (not large-hearted) Then (Preference=use as gift) If (soft) and (not large-hearted) Then (Preference=use as gift) When preference is “use oneself”, the highest CI value is 0.5, and the rules are “g1h3j3” and “b2g1j3”: If (quiet) and (not large-hearted) and (not imperious) Then (Preference=use oneself) If (fun) and (quiet) and (not imperious) Then (Preference=use oneself). - 46 -.
(49) Third step, we perform Relationship identification among K, P and E shown in Fig.4-15 by translating some results which are from the relationship identification between Kansei word and Evaluation of customers. We take rules “c3d1g2” and “g1h3j3” in Fig.4-14 as examples: According to tables 3-4 and 3-5, c3 means “not powerful”, d1 means “stillness”, and g2 means “un-decided”. Similarly g1 means “quiet”, h3 means “not large-hearted” and j3 means “not imperious”. We show the relationships using Fig.4-15:. Kansei Data from the Experiment. K 3 Relationship Identification Physical Data of the Samples. Evaluation of customers’. E. P. Fig.4-15: Relationship Identification between P, K and E As c3d1g2 means “not powerful” and “stillness”, we transform the rule into the Fig.4-16:. Fig.4-16: Output rules 4. - 47 -.
(50) We combined the rules on the left and on the right, and we got a new one “if A2B3G4 then use as gift” among lots of rules. In other words, it is “if the background color is white, the inside is colorful and the weight is 300g, then the cup will be popular”. This rule was obtained using our new method. It is new and it answered the question “A2BxCyDzEmFnG4”. Similarly as g1h3j3 means “quiet” and “not large-hearted” and “not imperious”, we transform the rule into Fig.4-17:. Fig.4-17: Output rules 5 We combined the rules on the left and on the right in Fig.4-17, and got the new rule “if A2B3C1F3G4 then use oneself”. In other words, it is “if the color is white, the inside is colorful, the pattern is a plant, the volume is large and the weight is 300g, then the cup will be liked” This rule was also obtained using our new method. It is also new and it answered the question “A2BxCyDzEmFnG4”.. - 48 -.
(51) Chapter 5 A design Support System. In chapter 5, we redesign some samples according to the new rules we got and do a simple evaluation on the new design of the samples. The new rules are “A2B3C1F3G4” and “A2B3G4” which we got through Rough-sets Analysis. We redesigned the samples NO.9, NO.15 NO.3, NO.19 and NO.20 using PHOTOSHOP7.0 software according to the new rules. We also. structure a design support system based on the database using DREAMWEAVER2004 aiming to support designers of Kutani-ware.. - 49 -.
(52) 5.1 Examples of New Designs. In this section, we redesigned some of the samples. According to the new rules “A2B3C1F3G4” and “A2B3G4” which we got through Rough-sets Analysis, we redesigned the samples NO.9, NO.15 NO.3, NO.19 and NO.20 using PHOTOSHOP7.0 software. We performed the simulation in three sets: set 1 using rule “A2B3C1F3G4”, set 2 using rule “A2B3G4” and set 3 using core rule “A2B3”. In set 1, the new rule “A2B3C1F3G4” tells us that if we change the B4 of cup NO.9 into B3, and B2 of cup NO.15 into B3, then the cups will be more likely to be used as gifts. So we changed the B4 and B2 into B3, in other words, we made the inside of the cup colorful, using a color which meets with the external wall. In set 2, according to the new rule“A2B3G4”, if we change the A4 of cup NO.3 and A6 of cup NO.19 to A2, and the B4 of cups NO.3 and NO.19 into B3, then the cups will be more likely to be used by customers themselves. So we changed the A4 and A6 to A2, and the B4 into B3, in other words, we changed the background color of the outside of the cups to white keeping the formal pattern, and the made the inside of the cups colorful using a color which is suitable with the external wall. In set 3, according to the new rules “A2B3C1F3G4” and “A2B3G4”which we got from Rough-sets Analysis using the new method, we can see that “A2B3” is the core. So if we change the A1B1of cup NO.20 to A2B3 then the cup will be more preferential. So we changed the A1B1 to A2B3, in other words, we changed the background color of the outside of the cup keeping the formal pattern, and made the inside of the cup colorful, using a color which is suitable with the external wall. The flowchart is shown on the next page from Fig.5-1 to Fig.5-5.. - 50 -.
(53) Set 1 In this set, the new rule “A2B3C1F3G4” tells us that if we change the B4 of cup NO.9 into B3, and B2 of cup NO.15 into B3, then the cups will be more likely to be used as gifts. So we changed the B4 and B2 into B3, in other words, we made the inside of the cup colorful, using a color which meets with the external wall.. NO.9 Original picture (with a white inside wall, a white background color and a flower pattern). Open the picture through Photoshop software. A2B4C1D1E1F3G4 (old rule). Click Marquee (M) key to select the mouth and save it as layer 1, and adjust the saturation ratio using the gradation (G) key to make the cup looks more natural.. Save the new picture as new 9.JPEG(with a colorful inside wall). A2B3C1D1E1F3G4 (new rule). Fig.5-1: Flow chart of Cup NO.9. - 51 -.
(54) NO.15. Original picture (with a white inside wall, a white background color and a flower pattern). A2B2C1D1E2F3G4 (old rule) Open the picture through Photoshop software. Click Marquee (M) key to select the mouth and save it as layer 1, and adjust the saturation ratio using the gradation (G) key to make the cup looks more natural.. Save the new picture as new 9.JPEG(with colorful inside). A2B3C1D1E2F3G4 (new rule). Fig.5-2: Flow chart of Cup NO. 15. - 52 -.
(55) Set 2 In this set, according to the new rule“A2B3G4”, if we change the A4 of cup NO.3 and A6 of cup NO.19 to A2, and the B4 of cups NO.3 and NO.19 into B3, then the cups will be more likely to be used by customers themselves. So we changed the A4 and A6 to A2, and the B4 into B3, in other words, we changed the background color of the outside of the cups to white keeping the formal pattern, and the made the inside of the cups colorful using a color which is suitable with the external wall. NO.3 Original picture 3 (with a red background color, a white inside wall and a figure pattern). Open the picture through Photoshop software. Click the lasso (L) key and copy the outside of the cup. A4B4C4D1E1F2G4 (old rule). and save it as layer 1. Copy the color of the inside wall and stamp (S) the outside wall with the same color as the inside wall.. Copy the red part of the cup and save it as layer 2 then erase the background color wall keeping the pattern using eraser (E). Click Marquee (M) key to select the inside wall and save it as layer 3, and adjust the saturation ratio using the gradation (G) key to make the cup looks more natural.. Save the new picture as new 3.JPEG(with a white background color, a colorful inside wall keeping the original pattern).. A2B3C4D1E1F2G4 (new rule). Fig.5-3: Flow chart of Cup NO.3. - 53 -.
(56) NO.19 Original picture (with a purple background color, a white inside wall and a geometric pattern). Open the picture through Photoshop software. A6B4C5D1E1F2G4 (old rule) Click the lasso (L) key and copy the outside of the cup and save it as layer 1. Copy the color of the inside wall and stamp (S) the outside wall with the same color as the inside wall.. Copy the red part of the cup and save it as layer 2 then erase the background color keeping the pattern using eraser (E). Click Marquee (M) key to select the mouth and save it as layer 3, and adjust the saturation ratio using the gradation (G) key to make the cup looks more natural.. Save the new picture as new 3.JPEG(with a white background color,. a colorful inside wall keeping the original pattern).. A2B3C5D1E1F2G4 (new rule). Fig.5-4: Flow chart of Cup NO.19. - 54 -.
(57) Set 3 In this set, according to the new rules “A2B3C1F3G4” and “A2B3G4”which we got from Rough-sets Analysis using the new method, we can see that “A2B3” is the core. So if we change the A1B1of cup NO.20 to A2B3 then the cup will be liked more. So we changed the A1B1 to A2B3, in other words, we changed the background color of the cup keeping the formal pattern, and made the inside of the cup colorful, using a color which is suitable with the external wall. The flowchart is shown on the next page. NO.20 Original picture (with a black background color, a white inside wall and a figure pattern). Open the picture through Photoshop software. Click the lasso (L) key and copy the outside of the cup then save it as layer 1. A1B1C4D1E2F3G6 (old rule). Copy the color of the inside wall and stamp (S) the outside wall with the same color as the inside wall.. Copy the red part of the cup and save it as layer 2 then erase the background color keeping the pattern using eraser (E). Click Marquee (M) key to select the mouth and save it as layer 3, and adjust the saturation ratio using the gradation (G) key to make the cup looks more natural.. Save the new picture as new 20.JPEG(with a white background color and a colorful inside wall keeping the original pattern).. A2B3C4D1E2F3G6 (new rule). Fig.5-5: Flow chart of Cup NO.20. - 55 -.
(58) 5.2 A Design Support System. In this section we will develop a simple system to support the designers of the Kutani-ware by summarizing all the results from the data analysis. The designers of the Kutani-ware can design the products which can satisfy the customers, and customers themselves also can choose the design they prefer using the system. Here we give some data and pictures of the system shown from Fig.6-1 to Fig.6-9: URL: http://79365.218219.06la.com.cn/. Three levels: Level 1: menu Level 2: rule Level 3: picture If you click the URL, you will see this:. Fig.6-1: Level 1 of word “soft”. - 56 -.
(59) If you click the word “soft”, you will see these rules:. Fig.6-2: Level 2 of word “soft” If you click the rule like above, you will see this:. Fig.6-3: Level 3 0f word “soft”. - 57 -.
(60) Come back to the menu, you will see this:. Fig.6-4: Level 1 of word “use oneself” If you click the word “use oneself”, you will see these rules:. Fig.6-5: Level 2 of word “use oneself”. - 58 -.
(61) If you click the rule like above, you will see this:. Fig.6-6: Level 3 of word “use oneself If you click the word “use as gift”,. Fig.6-7: Level 1 of word “use as gift”. - 59 -.
(62) You will see these rules:. Fig.6-8: Level 2 of word “use as gift” If you click the rule like above, you will see this:. Fig.6-9: Level 3 of word “use as gift”. - 60 -.
(63) Chapter 6 Conclusion and further works. In Chapter 6, we present our general conclusion of the study and list further works which should be done.. - 61 -.
(64) 6.1 Conclusion. This paper proposed a new method of design support using Kansei Engineering and Rough-Sets Theory. We explained the study from the following four aspects: 1. Evaluation Experiment: In this part, we gathered 45 master students in JAIST to ask their opinions on Kutani-ware. We prepared 35 Kutani-ware coffee cups, and the physical data of the cups. We also made a questionnaire to carry out the experiment. As a result, we summarized the examinees’ opinions into three tables to be used in Kansei Engineering and Rough-Sets Analysis. 2. Kansei Engineering: As we explored the styles of coffee cups that people prefer to use themselves, or to give to others as gifts, Factor Analysis was performed using the sensitivity data from our experiment, with the help of SPSS software. As a result, we knew that the cups with images like “powerful”, “rich”, “flowery” and “carousing” were preferable to use oneself. Similarly, the cups with images like “austere”, “imperious”, “ceremonious” and “hard” were preferable for use as gifts. 3. Rough-Sets Analysis: We proposed a new method to study the relationships between people’s preferences and the physical data of the samples. Through previous research, the originality and the advantages of Rough-Sets Theory were recognized. We got two new rules, and performed some new recommendations. They are: “if the background color is white, the inside is colorful and the weight is 300g, then the cup will be popular” and “if the color is white, the inside is colorful, the pattern is a plant, the volume is large and the weight is 300g, then the cup will be liked”. 4. Design Support: According to the two new rules, we performed simulation to redesign some of the cups. We changed the inside into colorful for cups NO. 9 and NO.15 changed the background color into white keeping the pattern, and the inside into colorful for cups. - 62 -.
(65) NO.3, NO.19, and NO.20. We also evaluated the new cups, which were well-liked by 80% of the participants.. 6.2 Further Works. Here, we declare three questions for future study: 1. Rough-Sets Analysis The Rough-Sets Theory is really a good method for relationship identification, and we surely got new rules and performed new recommendations using it. But there are still some questions. Among the many rules we got from the Rough-sets Analysis, there are some insignificant ones like G1, G2 and F1. G1 means if the weight is 150g then the cup is preferred by customers, and G2 means if the weight is 200g then the cup is preferred, and F1 means if the volume is small then the cup is preferred. These rules are so far away from Kansei. So we should develop some new methods to distinguish positive-rules and negative-rules to make the data analysis more efficient. Anther question is the accuracy. According to the results of the questionnaire, there are a lot of preferences like “neutral”. When we did the data analysis, we take them all off. In the future we should develop some new methods to maintain the accuracy of the data analysis. 2. Kutani-ware Kutani-ware is a representative traditional craft in Ishikawa Prefecture, which is based on advanced techniques, and has priceless cultural value. The Kutani industry was promoted at a summit by Syoza Kutani, who pushed for the mass production of Kutani Ware for export to the whole world. But because of mass production and changes of lifestyle, the market for Kutani-ware has been shrinking recently. When a thing is rare, it becomes precious. Kutani-ware should move towards the world as a Japanese culture representative art, not just as pottery. So we should do some research on the marketing of Kutani-ware, like giving some advice on cultivating successors and consumers, opening up overseas markets, developing new techniques and proposing new designs.. - 63 -.
(66) 3. Evaluators In this paper, we performed an evaluation experiment among the students in JAIST. Maybe they are not true customers. So if possible, we should gather people from different places, different countries, and different occupations and interview some craftsmen. Another question in this thesis is that when we identified relationships among the physical data, the Kansei data and preferences, we chose the top 3 of the CI from a large number of rules. In further research, we want to develop software to process all the rules, and there may be more new combined rules and new recommendations.. - 64 -.
図


+7


関連したドキュメント
Keywords: continuous time random walk, Brownian motion, collision time, skew Young tableaux, tandem queue.. AMS 2000 Subject Classification: Primary:
Inside this class, we identify a new subclass of Liouvillian integrable systems, under suitable conditions such Liouvillian integrable systems can have at most one limit cycle, and
“Breuil-M´ezard conjecture and modularity lifting for potentially semistable deformations after
Greenberg and G.Stevens, p-adic L-functions and p-adic periods of modular forms, Invent.. Greenberg and G.Stevens, On the conjecture of Mazur, Tate and
Then it follows immediately from a suitable version of “Hensel’s Lemma” [cf., e.g., the argument of [4], Lemma 2.1] that S may be obtained, as the notation suggests, as the m A
Our method of proof can also be used to recover the rational homotopy of L K(2) S 0 as well as the chromatic splitting conjecture at primes p > 3 [16]; we only need to use the
The proof uses a set up of Seiberg Witten theory that replaces generic metrics by the construction of a localised Euler class of an infinite dimensional bundle with a Fredholm
This paper presents an investigation into the mechanics of this specific problem and develops an analytical approach that accounts for the effects of geometrical and material data on
