要旨
製品開発上流での品質向上を加速する為,構想設計段 階で製品画質の検討を可能とする,シミュレーションを 用いた画質評価技術の改良を行った。既報の画像処理,露 光,潜像形成,現像の影響を考慮したシミュレーション に対して,トナー分光特性・転写・定着の影響を考慮し て出力画像の色を予測する計算モデルを追加することで, 電子写真プロセス特性を網羅し,幅広い誤差要因を考慮 できる色再現性シミュレーション評価技術を構築した。 この評価技術を用いた事例として,品質工学を活用し たL18×L8直交実験のシミュレーションを実施し,Japan Color2001チャート(IT8.7/3)のGamut体積カバー率 で色域安定性を評価した。最適設計条件では,SN比で 14.4dBという大きな利得が得られ,色域の安定化設計 という観点での妥当性を考察し,今後の実用化への課題 を示した。 この事例結果から,実機を用いずに製品開発の早期段 階で,多くの設計パラメータを考慮しながら,複数の評価 項目に対してバランスの取れた条件をフレキシブルに選 択し,システム全体の最適化を図ることが可能であるこ とを示した。また,実機実験と比較した場合,約30倍の 効率で試作から実験評価を行う期間の短縮が期待できる。Abstract
In order to accelerate quality improvements in an early de-velopment stage, image quality evaluation technique using numerical simulation has been improved toward the usage for designing image quality of a product in a conceptual de-velopment stage. Whereas the previously reported model includes modules for image processing, exposure, latent im-age formation and development, the new model adopted calculation modules for toner spectral characteristics, trans-fer sub-process and fusing sub-process to predict mixed col-or. By using the model, an evaluation system of color repro-duction by simulation has been constructed with much wider consideration of relevant design factors of electoro-photographic process.
As a practical example, design parameters for robust re-production in gamut volume cover ratio to Japan Color 2001 chart was studied using L18xL8 orthogonal array experi-ments of quality engineering. The optimized result showed improvement of gain in 14.4dB. Validity of the result was dis-cussed and several challenges for the future were suggested with a view toward practical tools of robust design for gamut reproduction.
From this result, possibility for optimization of whole sys-tem design with balanced condition selected flexibly from various evaluation factors by considering many design pa-rameters has been expected without using an actual ma-chine at early development stage. The result also showed expectation to 30 times efficiency in development period from trial production design to examination and evaluation.
シミュレーションを用いた色再現性評価技術の検討と
品質工学への適用
Investigation of Image Quality Evaluation Technique for Color Reproduction Using Numerical Simulation, and Application to Quality Engineering
近 藤 芳 昭
Yoshiaki KONDOH 一 谷 修 司Shuji ICHITANI 牧 野 徹Tohru MAKINO 服 部 好 弘Yoshihiro HATTORI
*品質保証統括部 品質企画推進部 **開発統括本部 第3技術開発センター ***品質保証統括部 評価技術部
1 はじめに
製品開発上流での品質向上を加速し,試作手戻りの低 減で開発期間を短縮することは,他社に先駆けて低コス トかつ質の高い製品リリースを行い,顧客の獲得に繋げ ることができる。そのための手段として,製品構想段階 の作像プロセス個々のサブプロセスを物理モデル計算で 追跡して最終出力画質を予測する,シミュレーションを 用いた画質評価技術が有効である。この技術の実用化に 求められるレベルは,品質工学と組み合わせたパラメー タ設計で改善効果の高い因子の絞り込みや,最適条件で 到達可能な品質の予測が可能となることである。 筆者らはこれまで画像処理,露光,潜像形成,現像の 影響を考慮した画像シミュレーションを構築し報告した。 今回はトナー分光特性と転写及び定着の影響を考慮して 出力画像の色を予測する計算モデルを追加することで, 重要な電子写真プロセス特性を網羅し,より実機に近い 結果が得られるシミュレーション評価システムを構築し た。本報告では構築したシステムの事例適用を行ない,こ の技術の有効性と課題について考察した。2 シミュレーションフロー
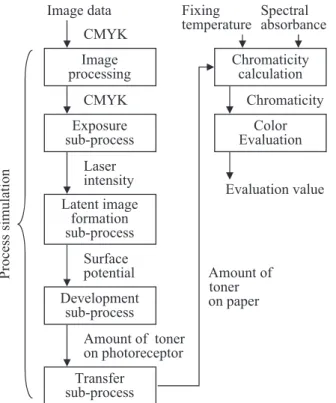
シミュレーションフローをFig. 1 に示すように,電子 写真プロセスのシミュレーション部,色度算出部,色評 価部の3つの構成に分けて説明する。計算原理等の詳細 については,参考文献(1), (2), (3)に記載されているた め,本稿では概略を述べるに留める。 電子写真プロセスのシミュレーション部は,画像処理 部,露光部,潜像形成部,現像部,転写部に分かれる。画 像処理部では,プリントされる画像データに対し,実機 相当のガンマ補正とスクリーン処理を適用する。露光部 では,レーザーパワーとビーム径,パルス幅,及び走査 速度をパラメータとして感光体表面上に形成される露光 エネルギー分布を算出する。潜像形成部では,露光エネ ルギー分布から感光体の光放電特性曲線を用いて表面電 位分布を求める。現像部では,表面電位分布を現像電位 差に変換し,現像特性曲線によって現像されるトナー量 分布の情報へ変換する。転写部は一般的なタンデムエン ジンの中間転写方式を想定し,1次転写部として感光体-中間転写ベルト間の1次転写効率と中間転写ベルトから 感光体に戻る逆転写効率,そして2次転写部として中間 転写ベルト-紙の間での2次転写効率を考慮した計算を行 なう。ただし,1次逆転写は,感光体から中間転写ベル トに転写するトナーが存在する時は適用しない。色度算出部は,面積率100%のCyan, Magenta, Yellow, Black各トナーの分光吸光度を定着温度に応じて変化さ せる定着部と,任意の面積率の各トナーの重ね合わせに よる画像の色度を各分光吸光度間の演算結果から算出す る色導出部で構成される。この計算モデルから,電子写 真プロセスのシミュレーション部で予測した紙上のト ナー量に対する色度(L*, a*, b*)を求める。 最後に色評価部で種々の評価値を算出する。 本シミュレーションで取り扱うパラメータについて, 過去の計算モデルとの比較をTable 1 に示す。新しい計算 モデルは,扱える電子写真プロセス特性のパラメータを 拡張した。
Fig. 1 Flow chart of numerical simulation-aided color evaluation. The flow chart is composed of a process simulation, a chromaticity calculation, and a color evaluation.
Table 1 Functional specifications of the simulation system. Image processing Exposure sub-process Latent image formation sub-process Image data CMYK CMYK Laser intensity Surface potential Amount of toner on photoreceptor Transfer sub-process Development sub-process Amount of toner on paper Fixing
temperature Spectralabsorbance Chromaticity calculation Color Evaluation Chromaticity Evaluation value Process simulatio n Conventional New system Screening Transfer efficiency Friction noise Light emission char.Exposure position
Beam profile
Fuser Color / Temperature Max density correction
Discharging noise Toner scattering Particle char. Charging char. PIDC Internal diffusion Developing char. Edge effect Development Exposure Control Transfer Density / Mass Toner Photoconductor
Sub process Parameter
Surface profile Internal diffusion
Surface profile Paper
Electric char. Heat transfer char.
3 品質工学への適用
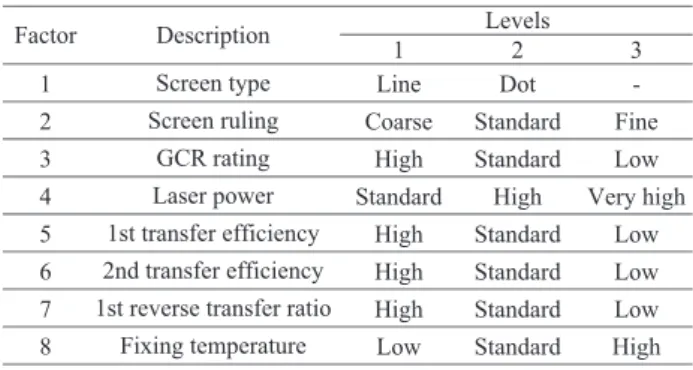
上述したシミュレーションモデルを品質工学の直交実 験に適用し,体積カバー率に関して色域を最適化する検 討を行なった。色再現性への影響力を各プロセス間で比 較を行い,改善効果の高い因子を明らかにするため,以 下に説明するL18×L8直交表を作成した。 Table 2 に制御因子としてL18直交表へ割り当てた項 目を示す。因子1~3は入力画像処理で階調性能に関わる, スクリーン線種(Line, Dot),スクリーン線数(粗密), Gray-Component Replacement(GCR)設定をそれぞ れ割り当てた。因子4は濃度再現域に影響するレーザー パワーを割り当てた。残りの因子5~7に転写部,因子8 に定着部のパラメータを割り当てた。 誤差因子はTable 3 に示すL8直交表(2水準系)を用 い,製造個体差や出力環境による誤差を割り付けた。因 子1,2はそれぞれ主/副方向の露光LDビーム径の誤差 を割り当てた。因子3は現像DCバイアス電源の出力誤 差を割り当て,因子4~6は転写部の1次転写効率,2次 転写効率,逆転写効率のばらつきをそれぞれ割り当てた。 因子7は定着部の定着温度誤差を割り当てた。今回の事 例では,CMYK各色で同一誤差として計算した。4 画質評価項目
Japan Color2001チャート(IT8.7/3)に含まれる各パッ チの平均色度で形成された Gamut の体積カバー率で色 域安定性を評価した。L18×L8直交実験シミュレーショ ンの結果得られた各Gamutに対して,Japan Color2001 チャートで表されるGamutとの間で,体積カバー率を算 出した。計算式を式(1)で示す。ここで,VTargetは,Japan Color2001チャートのGamut体積であり,VOverlapは各計 算結果のGamutがVTargetをカバーしている部分の体積で ある。 Target Overlap V V = Volume Coverage (1)5 計算結果
L18×L8直交実験をシミュレーションで実施した結果 の,要因効果図をFig. 2 に示す。ここでSN比は,体積カ バー率について100%から差をとった値を用いて望小特 性で評価した。 Fig. 2 に示した現行条件と最適条件で,確認実験を実 施した結果をTable 4 に示す。Table 4 では,推定値と確 認実験値で2dB以下の差となり,利得再現性のある結果 が得られた。また,SN比で14.4dBという大きな利得を 持つ結果が得られた(このときの体積カバー率は現行条 件で88.3%,最適条件で98.0%が得られた)。Fig. 2 Simulation results of L18xL8 orthogonal arrays are shown as graph of factorial effects. Factorial effects with volume coverage are plotted by SN ratio. Those are representing smaller-is-better response.
Table 2 Control factors for L18 orthogonal array.
1 2 3 3 1 2 4 5 6 7 -Fine Low Very high Low Low Low High Dot High Standard Standard Standard Standard Standard Standard Line Coarse High High High High Standard Low 8 Description Factor Levels Screen type Screen ruling GCR rating Laser power 1st transfer efficiency Fixing temperature 2nd transfer efficiency 1st reverse transfer ratio
Table 3 Noise factors for L8 orthogonal array.
1 2 3 4 5 6 7 Factor 1 2 Large Small Large Small High Low High Low High Low High Low High Low
Laser beam diameter x (main) Laser beam diameter y (sub)
Developing bias 1st transfer efficiency
Fixing temperature 2nd transfer efficiency 1st reverse transfer ratio
Description Levels 13 16 19 22 25 Lin e Do t -Coars e Standard Fine High Standard Lo w Standard High Very high High Standard Lo w High Standard Lo w High Standard Lo w Lo w Standard High
Screen ruling GCR rating Laser power 1st transfer
efficiency 2nd transfer efficiency transfer ratio1st reverse temperatureFixing
SN ratio [dB]
: Standard condition : Optimum condition
6 考察
今回の数値実験の結果から,各因子の効果を考察し,得 られた知見を確認する。 Fig. 2 について,レーザーパワーの向上がトナー付着 量の増加に繋がり,色域の安定化や拡大に寄与すると考 えられる。そして,今回の計算条件における因子間の影 響度合いでは,レーザーパワーの影響は1次転写効率及 び2次転写効率と同等であり,定着温度よりも小さいこ とが分わかった。また,1次及び2次転写効率を上げ,逆 転写効率を下げる事が色再現性に有利になると考えられ る。しかし,現実には1次転写効率が上がると,逆転写 効率も比例して上がる,トレードオフの関係がある。今 回用いた計算モデルは,この様な電子写真プロセスのメ カニズムは考慮していないため注意が必要であり,今後 の課題点である。Fig. 2 で定着温度は,今回の因子の中 で最も大きく色域の変動に影響した結果が示された。定 着温度の誤差に強くなる事は,実際にはページ間での定 着温度変動への耐性獲得や光沢度の制御につながること が想定される。定着温度を上げる事が色域安定・拡大に 寄与したのは妥当な結果と考えられる。 最適条件がGamutに及ぼす効果を確認するため,Fig. 3にL*-C*断面図,Fig. 4 にa*-b*断面図を示す。Fig. 3, Fig. 4
のそれぞれで,比較的大きい変化の見られた Red と Greenについて,誤差因子のL8直交実験数に対応した各 色8本の計算結果を重ねて示した。現行条件と比べて最 適条件はばらつきが抑制され,さらにGamut最外郭色域 を拡大する結果が得られていることを確認できた。 今回の計算事例で,我々のシミュレーション画像評価 技術が,製品開発の早い段階から有用な設計情報を得て システム全体の最適化に活用できることが示せた。
Fig. 3 Color distribution of Red and Green in L*-C* plane, with standard and with optimum condition. Simulation results added various noise factors are plotted. Chroma C* is calculated from the square root of the sum of (a*) ^2 and (b*) ^2.
Fig. 4 Outermost edge of Gamut surface in a*-b* plane, with standard and with optimum condition. Simulation results added various noise factors are plotted.
Table 4 Confirmation experiment.
Optimum Standard 13.0 31.7 18.7 Expection 14.4 32.7 18.3 Confirmation Volume coverage SN ratio [dB] Gain Description Evaluation item
L*
Standard
condition
C*
L*
Red
Green
100
0
100
0
0
100
100
0
Optimum
condition
C*
Red
Green
b*
a*
b*
120
100
-80
-80
Standard
condition
a*
Optimum
condition
120
100
-80
-80
7 まとめ
我々の構築した電子写真プロセスのシミュレーション 画像の評価システムが,開発の早い段階から製品設計の 目標設定に実用的に利用できることを,品質工学を用い たパラメータ設計の事例で示した。設計に有用な情報提 供を開発上流から行うことで,製品品質向上を実現し,顧 客へ提供する価値向上に貢献可能であると考える。 品質工学を組み合わせたシミュレーション評価を実施 し,体積カバー率に対する最適ロバスト設計条件を見出 した。最適条件では大きな利得が得られ,色域の安定化 という観点では良好な結果が得られたと考える。 この技術により,因子の寄与度を比較して,効率的に 重要課題へ注力することで,トナー及び作像部の設計が 機能的かつ効率的に推進可能となる。また,多くの設計 パラメータを考慮しながら,複数の評価項目に対してバ ランスの取れた条件をフレキシブルに選択し,システム 全体の最適化を図ることができる。 検討期間短縮の効果を試算した。実機評価を1条件2 時間とすると,L18×L8条件の実験日数は36日に相当す る。さらに設計に50日,実験データ解析に5日必要とす ると,実機実験では 91 日必要となる。それに対し,シ ミュレーション評価では3日(1PC)という結果であっ た。91/3=30.3倍の効率で,試作から実験評価する期間 の短縮が出来た。 課題としては,より実機で扱うパラメータに近づくこ とがあげられる。トナー帯電量や粉体特性など電子写真 プロセスのメカニズムに関わる基本機能をモデル化し, その成果をシミュレーション評価技術に盛り込んでいく 必要がある。 今後の展開として,構想段階の新製品展開に対する実 際の設計へのシミュレーション評価適用や,問題発生時 における感光体特性・定着・転写特性などの影響把握へ の適用があげられる。また,生産工程における画質変化 原因となる因子のキャッチアップや市場問題の流出阻止 展開への活用も考えられる。 ●参考文献1) S. Ito, T. Makino, and M. Umetsu, Numerical Simulation and Evaluation of Image Defects in Color Electrophotography, KONICA MINOLTA Tech. Rep., Vol.5, 50-56 (2008) [in Japanese].
2) S. Ito, Y. Kondoh, K. Ishige, and T. Makino: Proceeding of Imaging Conference JAPAN 2010, 11-14 (2010), [in Japanese]. 3) S. Ichitani, T. Makino, Y. Kondoh and T. Harashima: Study
of a Simulation for Color Reproduction of Electrophoto-graphic Image Based on Arithmetic Processing of Spectral Absorbance, KONICA MINOLTA Tech. Rep., Vol.10, 24-29 (2013) [in Japanese].
●出典
本稿は日本画像学会 “Imaging Conference JAPAN 2013” 論文集 の予稿を加筆修正して転載したものである。本稿の著作権は日本 画像学会が有する。