Verification of POI and Location Pairs via Weakly Labeled
Web Data
Hsiu-Min Chuang
Dept. of Computer Science and Engineering National Central University
Taoyuan, Taiwan
[email protected]
Chia-Hui Chang
Dept. of Computer Science and Engineering National Central University
Taoyuan, Taiwan
[email protected]
ABSTRACT
With the increased popularity of mobile devices and smart phones, location-based services (LBS) have become a common need in our daily life. Therefore, maintaining the correctness of POI (Points of Interest) data has become an important issue for many location-based services such as Google Maps and Garmin navigation systems. The simplest form of POI contains a location (e.g., represented by an address) and an identifier (e.g., an organization name) that describes the location. As time goes by, the POI relationship of a location and organization pair may change due to the opening, moving, or closing of a business. Thus, effectively identifying outdated or emerging POI relations is an important issue for improving the quality of POI data. In this paper, we examine the possibility of using location-related pages on the Web to verify existing POI relations via weakly labeled data, e.g., the co-occurrence of an organization and an address in Web pages, the published date of such pages, and the pairing diversity of an address or an organization, etc. The preliminary result shows a promising direction for discovering emerging POI and mandates more research for outdated POI.
Categories and Subject Descriptors
H.4 [Information Systems Applications]: Miscellaneous
General Terms
Measurement; Experimentation; Verification.
Keywords
Location-based service; Crowdsourcing; Weakly labeled data; Geographic information retrieval; Semi-supervised learning.
1. INTRODUCTION
Today, Google Maps and yellow-page websites (e.g., YP.com) have replaced paper maps and telephone directories because they can accommodate an unlimited number of points of interest (POI), which is not possible for traditional services. According to a market research report conducted by comScore in 2014, surveying 5000 Americans, 90% of users have used a “local search” for finding a business with certain products/services, locating the address of a given business, or querying the phone number of a business [13]. Therefore, POI data has received increased attention.
As defined in POI Core by WWW Consortium1, a point of interest is basically a location about which information is available. In a broad sense, the term POI refers to the coupling of a location and a POI, where a location is a physically fixed point and POI are human constructs identified by name and characterized by type, such as organization names, building names, and places. Note that multiple POI may share the same location, whereas a place can contain multiple POI and also be coterminous with the POI. For example, “Yellowstone National Park” is both a place and POI located in “Wyoming, Idaho, and Montana, USA.”
State-of-the-art search engines like Google and Yahoo began their map services in 2005 and 2002, respectively. To provide POI searches on maps, some research has been focused on deriving spatial context [1] or geographic entities [14] from unstructured Web resources. For example, Jones and Purves proposed research on geographic information retrieval (GIR). Ahlers and Boll adopted focused crawling to collect pages with full addresses in Germany using a human-edited dictionary and address database [1]. Recently, Chuang et al. crawled yellow-page websites and address-bearing pages to extract business POI on the Web [9]. Although construction of POI databases from business entity databases, organization directories, and open government data can be technically achieved, maintenance of the crawled POI presents a new challenge. As time goes by, a POI may acquire a new location due to the opening, moving, or closing of a business creating an emerging POI or invalidating an existing POI. In fact, when the same address maps to multiple stores (1-to-many) or the same store maps to multiple addresses (many-to-1), they could be either all correct or all wrong.
For example, the five POI relations for the same address “台北市 士林區延平北路六段436 號 4 樓”(4F., No. 436, Sec. 6, Yanping N. Rd., Shilin Dist., Taipei) in Figure 1(a) from the yellow-page website are outdated POI. However, all POI relations for the same shopping mall TaiMall at address “No. 112, Section 1, Nankan Road, Luzhu Township, Taoyuan City, 338” are correct. On the other hand, the chain store “SUBWAY” has five POI near Taoyuan from Google Maps, as shown in Figure 1(b). Although most of them are correct, the store “ 內 壢 家 樂 福 店 ” is permanently closed. In general, if an address corresponds to a department store or shopping mall, most of the POI could be correct. In contrast, if the address is not a department store or shopping mall, most of the POI could be outdated except for the emerging POI.
According to [9], 15% (i.e. 116,000) of POI crawled from yellow pages present 1-to-many or many-to-1 mapping, and an additional
1 http://www.w3.org/2010/POI/documents/Core/latest Copyright is held by the International World Wide Web Conference
Committee (IW3C2). IW3C2 reserves the right to provide a hyperlink to the author's site if the Material is used in electronic media.
WWW 2015 Companion, May 18–22, 2015, Florence, Italy. ACM 978-1-4503-3473-0/15/05.
http://dx.doi.org/10.1145/2740908.2741715
430,000 POI obtained from the surface Web all require further verification. Therefore, detecting emerging and outdated POI relations is an important task for POI data quality assurance.
Figure 1. 1-to-many and many-to-1 POI mapping. (a) The same address maps to five different stores simultaneously in the same yellow-page website. (b) The chain business
“SUBWAY” with several stores near Taoyuan.
Existing location-based services like Google Maps and Wikimapia rely on users’ feedback and manual verification to maintain their POI database, which is costly and slow. Due to the popularity of the Web, most businesses have their own official websites or “Ads and Pages” on Facebook. A large amount of user-generated content (UGC) from blogs as well as open government data also contributes to the coupling of POI and locations. Hence, we denote these pages with implicit POI relations as weakly labeled Web data.
In this paper, we examine the possibility of detecting outdated POI relations from these weakly labeled Web data based on machine learning. We utilize the Google search engine to acquire search results pertaining to the given POI and address pair and individual queries. We then use the number of search results, the number of snippets containing POI, and the published date of POI pages to generate features for model training. Furthermore, we adopt a semi-supervised learning approach with a small amount of labeled data and large volume of unlabeled data to improve the performance of basic classifiers. The experimental results show that the proposed model performs better on emerging POI detection than outdated methods of POI identification.
The rest of the paper is organized as follows. Section 2 describes related work on data quality assurance for geographic information retrieval. Section 3 introduces our POI database source and our approach for verification of POI relations. This section focuses on training models via weakly labeled Web data. The experimental results are presented and analyzed in Section 4. Finally, we conclude this paper and provide a road map for future work in Section 5.
2. RELATED WORK
With the popularity of wireless networks and mobile devices, the topic of GIR (Geographic Information Retrieval) began to gain increasing attention. According to Sanderson and Kohler [16] in 2004, as much as 20% of Web queries have a geographic relation, with 15% directly mentioning a specific place. As Chitka2 noted in 2012, “43% of total Google search queries are local.”Indeed,
2 http://searchengineland.com/study-43-percent-of-total-google-search- queries-have-local-intent-135428
the requirements for location-based services have increased significantly over the past three years [13]. Therefore, we have seen investment in maps from firms like Google and Nokia (HERE HD) as well as public efforts like OpenStreetMap, Wikimapia, and OpenPOI for the construction and maintenance of POI databases. Because crowdsourcing has been the major force for POI generation (e.g., through check-in locations on Facebook), the resulting problem of managing the quality of often inconsistent and outdated POI from user-generated contents on the Web has become an emerging research topic.
2.1 Geographic Database Construction
Much current research in GIR can be regarded as an extension of the field of information retrieval (IR) [6]. Actually, the major difference between IR and GIR is the detection of geographic entities. According to research by Jones and Purves [14], GIR is concerned with improving the quality of geographically specific information retrieval. The major challenges in this field include detecting geographic references, disambiguating place names, interpretation of vague place names, indexing documents with respect to their geographic context, ranking the relevance of documents with respect to geography, and developing effective user interfaces that help users to find what they want. In summary, GIR is similar to traditional IR and the index is built on the corpus of Web documents.
In contrast, POI searches on maps focus on locating business or organization entities providing a specific product or service; thus, the index is built on a database of POI with unstructured page segments where POI originate. For example, Ahlers and Boll proposed a location-based search engine that automatically derived spatial context from unstructured Web resources [1]. They used directory-based seeds (e.g., category names) from dmoz and keyword-based queries (e.g., using street name as queries) from an address database for geospatially focused crawling in Germany. Their recent research has been focused on location entity extraction from the deep Web, such as yellow pages and Wikipedia, for more POI [2][3]. Chuang, et al., on the other hand, proposed the idea of address-bearing pages via query-based crawler using address keywords to efficiently obtain large numbers of POI in Taiwan [9].
2.2 Data Quality Assurance
Volunteered geographic information (VGI) refers to geographic data that are produced by volunteers who are not necessarily educated surveyors or cartographers. Although the cost to accumulate such geographic information by crowdsourcing is quite low, it may present a significant challenge for data quality assurance, including issues with completeness, positional accuracy, attribute consistency, logical consistency, and lineage. Hence, the assessment of VGI quality has become a focus in VGI- related research [12]. For example, Ali and Schmid proposed methods to check the integration of VGI data with respect to hierarchical consistency and classification plausibility [4][5]. The verification problem of VGI data is similar to the tagging problem presented by images with user-provided-tags. Due to the arbitrariness of the tagging activities, these tags are often imprecise and incomplete. Thus, a great variety of applications have been developed to improve the quality of user-provided tags, such as automatic tag annotation, image and tag clustering, tag recommendation, and tag refinement. Wang et al. [17] proposed an effective unsupervised label refinement (ULR) approach for refining the labels of Web facial images using machine learning 1(a) 1(b)
techniques. They formulated the problem as one of convex optimization and developed effective optimization algorithms to efficiently solve the large-scale learning task.
Another problem in VGI is the duplication of data in databases, e.g., check-in locations on Facebook. Dalvi et al. proposed an Expectation-Maximization (EM) algorithm to distinguish core and background words of place names [10]. Based on the distribution of terms for the background model (combining the global and local background models), they could estimate the probability of two places with the same core words and achieved an F-measure of 0.9 for de-duplication.
3. POI RELATION VERIFICATION
In this paper, we use a POI database of 1.2 million address-and- store-name pairs crawled from two yellow-page websites (Hipage3 and iPeen4) and general pages on the surface Web crawled by Chuang, et al [9]. We focus on the problem of verifying POI relations to identify incorrect or outdated address and store name pairs for the 116,000 1-to-many or many-to-1 mappings crawled from yellow-page websites and the 430,000 POI from the unstructured Web. We consider the 1-to-many POI relation verification as a binary classification problem for multiple address-and-store pairs.
Formally, a POI relation is said to be positive if the address and store name pair (a, s) is incorrect or outdated; otherwise, the POI is said to be negative. We use the Google search engine to collect search results for three queries including two individual queries of a and s, and one composite query, a+s. To obtain features for binary classification, we consider the following information: 1) the number of search results for three queries, e.g., C(a), C(s), C(a+s). 2) the top ten snippets from individual query Ta, Ts, Ta+s. 3), and the date of the most recent post from the top ten snippets that contains a+s, e.g., Da+s (see Figure 2 below).
Figure 2. An example of a Google search result containing weakly labeled Web data. Given an address-and-store-name as queries, we can obtain information such as the number of search results, the top ten snippets, and the publishing dates of pages.
Based on the number of search results from three queries, we define the first five features as shown in Table 1. Features 1 to 3 are the number of search results for three queries in log scale. Features 4 and 5 are the ratio of C(a+s) to C(a) and C(s), respectively.
3 hipage, https://www.iyp.com.tw/
4 iPeen, http://www.ipeen.com.tw/
Subsequently, we define the next six features based on the top ten snippets from individual queries Ta, Ts, Ta+s. Features 6 to 8 denote the percentage of top ten snippets from Qs, Qa, and Qa+s
that support the POI relation (a,s) pair. That is, the number of snippets that contain both a and s, divided by 10. Feature 9 computes the discounted cumulative gain (DCG) based on the rank of store s in the top ten snippets Ta+s. Similarly, Feature 10 computes DCG based on the rank of address a in Ta+s. The following feature computes the cosine similarity between the top ten snippets Ta and Ts.
Finally, the last feature concerns the validity of the POI relation in the time dimension. It computes the duration of the POI relation up to the present moment. We expect the value to be close to zero for a stationary POI and nonzero for outdated or incorrect POI.
Table 1. Features of weakly labeled Web data
id Name Descriptions
1 log C(a) # of search results for query a in log scale 2 log C(s) # of search results for query s in log scale 3 log C(s,a) # of search results for query a+s in log scale 4 R(a+s|a) the ratio of C(a+s) to C(a)
5 R(a+s|s) the ratio of C(a+s) to C(s)
6 P(a+s|Ta) the percentage of top 10 snippets from Qa that support the POI relation (a,s)
7 P(a+s|Ts) the percentage of top 10 snippets from Qs that support the POI relation (a,s)
8 P(a+s|Ta+s) the percentage of top 10 snippets from Qa+s that support the POI relation (a,s)
9 DCG(s|Ta) the rank of s in top 10 snippets from Ta
10 DCG(a|Ts) the rank of a in top 10 snippets from Ts
11 cos(Ta,Ts) the cosine similarity for snippet Ta and Ts 12 D(a+s) Today-Da+s in log scale
3.1 Semi-Supervised Verification
To reduce the effort of labeling, we adopt semi-supervised learning to make use of both labeled and unlabeled POI relations for model training. In this paper, we apply tri-training, which uses a limited number of annotated examples (L) to train three classifiers and co-label unannotated examples based on a voting mechanism [18]. Formally, tri-training uses two of the three classifiers , , and ( ) to label an answer for an instance in unlabeled dataset U. If two classifiers give the same answer, we could trust the answer to be correct and put the newly labeled example for learning in the next iteration. To ensure the decreasing of errors across each iteration ( ), the number of examples that can be added for new iteration is bounded by
(1)
where denotes the error rate of classifier at iteration t and denotes the number of examples added for classifier at iteration t-1.
In this paper, we use a modified version of the tri-training algorithm by Chou and Chang, who proposed an estimation of the number of training examples that can be added for the first iteration [8].
(2) where
(3)
(4)
(5)
Compared with the estimation by Zhou et al. for UCI data with a smaller labeled training set, the number of examples that can be added for the first iteration is more adequate for a larger labeled training set, avoiding the problem of premature termination due to insufficient training examples.
Note that, for a tri-training algorithm to work, the initial classifiers should be diverse to avoid degeneration to self-training. There are three alternatives to obtain diversity in classifiers, including different combinations of features, bootstrap sampling of training examples, and different supervised learning algorithms. In this paper, we conduct experiments for each of these three alternatives. We first follow [8] to train three SVMs from data sets generated via bootstrap sampling. Second, we try three different classifiers, i.e., SVM, C4.5 [15], and bagging [7]. Finally, we train three classifiers from datasets with different views toward confidence of classification.
4. PERFORMANCE EVALUATION
In this paper, we prepare two datasets for the following experiments. The first dataset consists of the 116,000 1-to-many and many-to-1 addresses and store mappings from yellow-page websites crawled by Chuang et al [9]. We labeled 6,640 1-to-m pairs (by 12 students), including 3,412 outdated POI and 3,228 existing POI. The second dataset is a business directory update (open government data) from the Commerce Industrial Services Portal5, which contains 6,780 closed business POI and 3,842 new business POI in Taiwan from the years 2010 to 2014.
We consider the following measures including accuracy, area under ROC curve (AUC), precision, recall, and F1-measures for outdated POI to evaluate the prediction performance. Let A denote the quantity of the POI pairs that are predicted as outdated, and B denote the quantity for the outdated POI pairs. Then, the measures can be calculated by the following equations:
ACC= # of correct prediction / # of testing examples (6)
P= (A∩B) / A (7)
R= (A∩B) / B (8)
F1 = 2(P*R)/(P+R) (9)
4.1 Semi-Supervised Learning
Three experimental results are presented for the first dataset on 1- to-m POI as introduced below. First, we try supervised learning on the first dataset using three-fold cross validation. Next, we apply the tri-training approach using 110,000 unlabeled data to improve the performance over supervised learning. We also compare the performance of three alternative methods for preparing classifiers for tri-training.
First, we conduct three-fold cross validation and average the performance with different learning algorithms including RBF Network, AdaBoost, SVM, and Bagging. As shown in Table 2, Bagging has the best performance in terms of accuracy and AUC,
5 Commerce Industrial Services Portal, Ministry of Economic Affairs, R.O.C, http://gcis.nat.gov.tw/
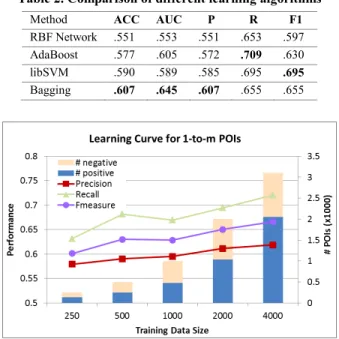
whereas libSVM performs best in terms of F1-measure for outdated POI. We also examine the learning curve for libSVM as shown in Figure 3. The result show that the F1-measure improved from 0.601 to 0.666 with the number of labeled training examples increased from 250 to 4000. As we can see, if more training examples are available, improvements in performance become more likely. Unfortunately, more labeled data are expensive. Thus, we will use the limited labeled data and the larger pool of unlabeled data from our POI database to improve the performance as shown next.
Table 2. Comparison of different learning algorithms
Method ACC AUC P R F1
RBF Network .551 .553 .551 .653 .597 AdaBoost .577 .605 .572 .709 .630
libSVM .590 .589 .585 .695 .695
Bagging .607 .645 .607 .655 .655
Figure 3. Learning curve for SVM on 1-to-m POI To utilize unlabeled data to improve the performance via tri- training, we use 4,000 (60%) labeled pairs and 50,000 unlabeled pairs from our POI database for tri-training. The testing is conducted on the rest of the 40% labeled POI (2,640). We compare three alternatives to achieve classifier diversity based on data, feature, and learning algorithms. For data diversity, we bootstrap a sample of 75% data to generate subsets three times. Similarly, we use 75% features to generate subsets three times to achieve feature diversity. Finally, we select SVM, C4.5, and Bagging as the three learning algorithms.
As shown in Table 3, accuracy in testing set is not improved significantly for three trials of tri-training even if the error rate of the training set is decreased (Figure 4). One possible reason is the different distribution of the training and testing set for this splitting. Thus, the decreased error rate in the training set does not improve the prediction accuracy of the testing set. Another possible reason is the correctness of the added examples. For classifiers with 0.6 accuracy, there is a (1-0.6)2/(0.62+(1- 0.6)2)>0.3 probability that two classifiers simultaneously label a wrong answer; thus, we select examples with confidence values greater than a threshold to ensure the quality of new added examples. Therefore, we also examine the confidence distribution of three learning algorithms to set the threshold as shown in Figure 5. Because nearly 95% of unlabeled examples have confidence values smaller than 0.6 for SVM, we therefore set threshold from 0.55 to 0.65 to see if confidence threshold also affects tri-training.
Table 3. The improvement of accuracy and F1-measure for outdated POI by three different classifier diversity for tri- training.
Tri-Training 75% data (SVM) features 75% (SVM)
Learning algorithms (SVM-DT-BAG)
Initial Accuracy .606 .569 .618
Final Accuracy .607 .568 .620
Initial F1 .561 .604 .653
Final F1 .649 .540 .695
Figure 4. Tri-training with data diversity using SVM
Figure 5. The confidence distribution of three learning algorithms
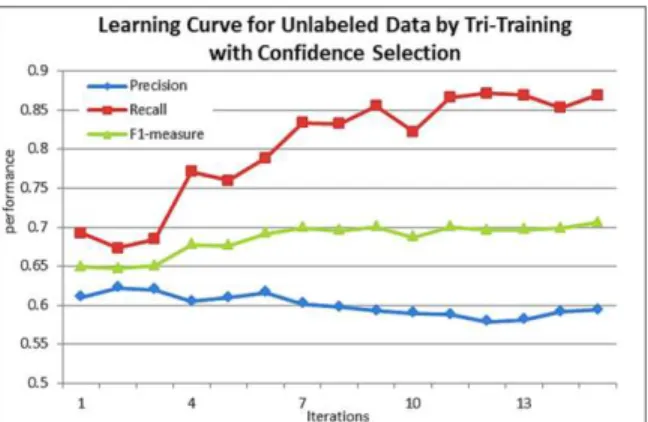
As shown in Table 4, both accuracy and F1 for outdated POI increase as the threshold increases (from 0.55 to 0.65) for tri- training with three different learning algorithms SVM, C4.5, and Bagging. Figure 6 shows the increasing of F1 on testing set across iterations of tri-training process.
The experimental result shows that selecting instances with higher confidence for added examples is a key step for tri-training because it can avoid the inclusion of incorrect data. Compared to the case without a confidence threshold (the last column in Table 3), tri-training with confidence improves F1 from 0.66 to 0.702.
Table 4. Tri-training with SVM-DT-BAG Tri-Training
Threshold 0.55 0.60 0.65
Initial Accuracy .618 .618 .618
Final Accuracy .620 .616 .610
Initial F1 .653 .653 .653
Final F1 .660 .701 .702
Figure 6. Tri-training with learning algorithm diversity
4.2 Supervised Learning on Open Data
In this section, we evaluate the performance of supervised learning on open data. The dataset consists of outdated and emerging POI pairs. Our goal is to train the model using the pairs during past four years for predicting current POI. Thus, we use the pairs since 2010 to 2014 for training and 25% of pairs from 2014 for testing, and conduct three-fold cross validations with LIBSVM.
The learning curves for SVM in terms of accuracy and F1 measures of outdated (F1-old) and emerging (F1-new) POI are shown in Figure 7. We can see the curve for accuracy does not change much (0.65~0.67) with respect to the increasing of training size. However, the F1-measure for outdated POI is increased from 0.315 to 0.405. On other hand, the prediction of emerging POI pairs maintains a better performance of around 0.76~0.77 F1-measure. Thus, detection of emerging POI is easier than detection of outdated POI pairs. In fact, most distribution of features for emerging POI pairs is more narrow and clear, but the distribution of features for updated POI pairs is wider and noisier (see Figure 8). In short, the prediction for outdated POI pairs needs more time to accumulate more data for correct prediction.
Figure 7. Learning curve for SVM on open data
Figure 8. The distributions of features for open data (red: outdated POI, blue: emerging POI)
5. CONCLUSIONS
POI databases are important for location searches on mobile devices. Detecting outdated POI data is mandatory because of the changes in the locations of a store or organization. In this paper, we applied semi-supervised learning for detecting outdated POI based on features obtained from search engines using address, store name, and their composite as queries, including number of search results, the co-occurrence or correlation of addresses and store names in the top ten snippets, and cosine similarity of the search snippets for three queries. We conducted experiments on two real-world datasets: the 1-to-m POI mappings from yellow- page website and open data. Overall, tri-training can improve around 5% F1 (from 0.66 to 0.702 on the first data set) via SVM, C4.5, and Bagging to achieve classifier diversity with a confidence threshold of 0.65. For open data, the accuracy is around 0.65~0.67 favoring emerging POI (0.76~0.77 F1). More study is required for outdated POI in open data. In the future, we plan to combine features from social websites to enhance the verification performance for updated POI relations. Including unsupervised approaches to this problem would also be an interesting direction for future research.
6. REFERENCES
[1] Ahlers, D. and Boll, S.: Location-based Web Search. In: The Geospatial Web, 55-66, Springer, 2007.
[2] Ahlers D.: Business Entity Retrieval and Data Provision for Yellow Pages by Local Search. In: ECIR, 2013.
[3] Ahlers D.: Lo mejor de dos idiomas - Cross-Lingual Linkage of Geotagged Wikipedia Articles. In: ECIR, 668-671, 2013. [4] Ali, A. L. and Schmid, F.: Data Quality Assurance for
Volunteered Geographic Information. In: GIScience, pp. 126–141, 2014.
[5] Ali, A. L., Schmid, F., Rami, A. S., and Kauppinen, T.: Ambiguity and Plausibility: Managing Classification Quality in Volunteered Geographic Information. In: SIGSPATIAL, TX, USA, Nov. 4-7, 2014.
[6] Baeza-Yates, R. and Ribeiro-Neto, B.: Modern Information Retrieval. Boston, MA: Addison Wesley, 1999.
[7] Breiman, L.: Bagging Predictors. In: Machine Learning, 24, pp. 123-140, 1996.
[8] Chou, C.-L. and Chang, C.-H.: Named Entity Extraction via Automatic Labeling and Tri-training: Comparison of Selection Methods. In: AIRS, pp. 244-255, 2014.
[9] Chuang, H.-M., Chang, C.-H. and Kao, T.-Y.: Effective Web Crawling for Chinese Addresses and Associated Information. In: EC-Web, 2014.
[10] Dalvi, N., Olteanu, M., Raghavan, M., Bohannon P.: Deduplicating a Places Database. In: WWW, Seoul, Korea, Apr. 7–11, 2014.
[11] Fan, R.-E., Chen, P.-H. and Lin C.-J.: Working set selection using second order information for training SVM. In: Journal of Machine Learning Research 6, pp. 1889-1918, 2005.
[12] Goodchild, M.F. and Li L.: Assuring the quality of
volunteered geographic information. In: Spatial Statistics, pp. 110-120, 2012.
[13] Stirling, G.: Study: 78 percent of local-mobile searches result in offline purchases. In: Search Engine Land. Apr. 9, 2014. [14] Jones, C. B. and Purves, R. S.: Geographical information
retrieval. In: International Journal of Geographical Information Science, 22(3), pp. 219–228, Mar. 2008. [15] Quinlan, J. R.: C4.5: Programs for Machine Learning.
Morgan Kaufmann Publishers, 16 (3), pp. 235-240, Sep. 1993.
[16] Sanderson, M. and Kohler, J.: Analyzing Geographic Queries. In: SIGIR. Sheffield, UK, 2004.
[17] Wang, D., Hoi, S.C.H., He, Y., and Zhu, J.: Mining Weakly Labeled Web Facial Images for Search-Based Face Annotation. In: TKDE, 26 (1), pp. 166-179, Jan. 2014. [18] Zhou, Z. H. and Li, M.: Tri-Training: Exploiting Unlabeled
Data Using Three Classifiers. In: TKDE, 17 (11), pp. 1529- 1541, 2005.