Article
Comprehensive Benefit Evaluation of the Power
Distribution Network Planning Project Based on
Improved IAHP and Multi-Level Extension
Assessment Method
Qunli Wu and Chenyang Peng *
Department of Economics and Management, North China Electric Power University, Baoding 071003, China; [email protected]
* Correspondence: [email protected]; Tel.: +86-312-7525-113 Academic Editor: John K. Kaldellis
Received: 25 May 2016; Accepted: 8 August 2016; Published: 13 August 2016
Abstract: Reasonable distribution network planning is an essential prerequisite of the economics and security of the future power grid. The comprehensive benefit evaluation of a distribution network planning project can make significant contributions towards guiding decisions during the planning scheme, the optimization of the distribution network structure, and the rational use of resources. In this paper, in light of the characteristics of the power distribution network, the comprehensive benefit evaluation index system is constructed considering the influencing factors of technical benefit, economic benefit, and social benefit. To eliminate the influence of subjective factors on the evaluation effects and the uncertainty of the influencing factors effectively, the improved interval analytic hierarchy process is employed to calculate the index weights more simply. Moreover, based on the traditional single-factor extension evaluation, this study proposes a multi-level extension assessment model to evaluate the comprehensive benefit of the power distribution network planning project. The model can not only identify the key factors that affect the evaluation effect of the power distribution network planning project, but also can predict the overall development trend of the project. Finally, using a specific urban distribution network planning project as an example, the findings indicate that the comprehensive benefit grade of this power distribution network planning project is “better” due to the benefit grade variable eigenvaluej∗ ∈ [3.33, 3.418] ∈[3, 4], and illustrates that the model is credible and practical to achieve the comprehensive benefit evaluation of the power distribution network planning project.
Keywords: power distribution network planning project; comprehensive benefit evaluation; improved Interval Analytic Hierarchy Process (IAHP); multi-level extension assessment
1. Introduction
With the rapid expansion of cities in China, the formation of overall planning schemes seems an inevitable trend of urban development. As an indispensable part of urban planning, the status of urban distribution network planning has been significantly enhanced. In the past few years, the transformation and planning of urban distribution network projects have been carried out. However, there are still some urgent problems to be solved in the planning of the power distribution network. For instance, how can we reasonably evaluate the planning results of an urban distribution network? How can we analyze the comprehensive benefit of urban distribution network planning quantitatively? The traditional assessment of an urban distribution network planning project has been mainly the individual evaluations, including reliability [1–6], safety [7], power quality [8], risk [9], and efficiency [10]. These studies tend to evaluate the technical level of the power distribution
network from different aspects with little attention to the comprehensive benefit assessment of the distribution network planning project. Very little literature refers to the benefit evaluation. For instance, Cheumchit [11] evaluated the benefit of comprehensive planning of the high and medium voltage distribution network. Borchard [12] assessed the benefit of voltage comprehensive planning considering the network costs and power quality. The direct guidance of the construction of distribution networks seems very poor.
Recently, research on the comprehensive evaluation of power distribution network planning projects have been given extensive attention, but the comprehensive benefit assessment seems relatively inadequate. Fan [13] used the fuzzy comprehensive evaluation method to evaluate risk, but the method may be greatly influenced by human subjective factors. Ma [14] and Wang [15] respectively established the evaluation index system considering the preparation work, the whole process, and the operational ability of power grid construction projects, but the complete theory to assess the distribution network planning project was not formed. Yang [16] studied the power network renovation project based on the fuzzy Analytic Hierarchy Process (AHP), and applied the interval number to weaken the human subjective factors on the evaluation results. However, before the fuzzy comprehensive evaluation, the membership degree of each index needs to be determined by the associated experts with great subjectivity. Zhang [17] employed the gray fuzzy theory to evaluate the power network project, but the irrationality of the ideal index system can inversely affect the evaluation results. Therefore, from the previous literature, it can be concluded that there still exists some problems about the comprehensive evaluation of power distribution network planning projects, comprising the incomplete evaluation index system, the irrationality of the determination of weights without considering the uncertainty, fuzziness of experts’ judgment, and the imperfection of the evaluation method.
and subjectivity in terms of determining the weight, which previously affected the evaluation of the benefit of the power distribution network planning project, are all resolved. The main contributions of this paper are as follows:
(1) From previous literature, it can be found that the current studies mainly focus on the individual technical or economic level evaluations of the power distribution network planning project, such as reliability, security, power quality, and investment benefit. Therefore, this paper attempts to perform the comprehensive benefit evaluation on the power distribution network planning project considering technical benefit, economic benefit, and social benefit;
(2) To address the issues of uncertainty, fuzziness, and subjectivity in terms of determining the weight, which strongly affect the evaluation results of the comprehensive benefit of the power distribution network planning project, this paper constructs an improved IAHP method by introducing the interval number to replace the element of judgment matrix and uses a novel approach of consistency testing based on a linear programming model to solve the problem of incomplete consistency of the interval number judgment matrix;
(3) In order to solve the multi-factor evaluation problem, this study establishes the multi-level extension evaluation method to expand the single-factor extension evaluation model by introducing the index weight, and obtaining the results of the multi-level extension evaluation of the object to be evaluated according to the maximum membership degree law.
The remainder of this paper is structured as follows: Section2describes the comprehensive benefit evaluation index system of the power distribution network planning project; Section3introduces the principles of the improved IAHP, multi-level extension assessment method, and the evaluation process of the proposed approach; The evaluation method reported in this research is examined by a case study in Section4; Conclusions about the proposed model are given in Section5.
2. Comprehensive Benefit Evaluation Index System of the Power Distribution Network Planning Project
2.1. Comprehensive Benefit Evaluation Index System
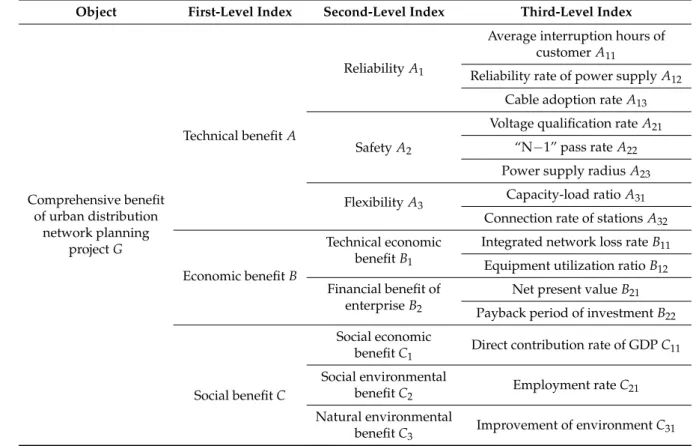
Table 1. Comprehensive benefit evaluation index system of the power distribution network planning project.
Object First-Level Index Second-Level Index Third-Level Index
Comprehensive benefit of urban distribution
network planning projectG
Technical benefitA
ReliabilityA1
Average interruption hours of customerA11
Reliability rate of power supplyA12 Cable adoption rateA13
SafetyA2
Voltage qualification rateA21 “N−1” pass rateA22 Power supply radiusA23
FlexibilityA3 Capacity-load ratioA31 Connection rate of stationsA32
Economic benefitB
Technical economic benefitB1
Integrated network loss rateB11 Equipment utilization ratioB12 Financial benefit of
enterpriseB2
Net present valueB21 Payback period of investmentB22
Social benefitC
Social economic
benefitC1 Direct contribution rate of GDPC11 Social environmental
benefitC2 Employment rateC21 Natural environmental
benefitC3 Improvement of environmentC31
2.2. Analysis of the Benefit Evaluation Index 2.2.1. Technical Benefit
Technical Benefit is defined as the technological improvement after completing the distribution network construction based on the planning. In this study, the technical benefit of the distribution network can be analyzed from the perspectives of reliability, safety, and flexibility.
(1) Reliability
Reliability includes the average interruption hours of customers, reliability rate of power supply, and the cable adoption rate. Average interruption hours of customers and the reliability rate of power supply can reflect the failure rate of the equipment. Cable adoption rate can represent the level of equipment which affects the reliability of the power supply. The definitions of these indices are described as follows:
T= ∑(t×hm)
h (1)
whereTis the average interruption hours of customers;tis the duration time of each interruption;hm represents the customers of each interruption;hrepresents the total interruption of customers.
RSI= (1− t
T)×100% (2)
whereRSIis the reliability rate of the power supply;tis the average interruption hours of customers; Tis the time period of the statistic.
d= l
whereddenotes the cable adoption rate;lis the length of cable;Lis the line length of corresponding voltage class.
(2) Safety
Safety contains the voltage qualification rate, “N−1” pass rate, and the power supply radius. The voltage qualification rate can be defined as the ratio of the time of normal voltage to the total time of the voltage monitoring during the measurement period. “N−1” pass rate refers to the phenomenon that any other line does not exceed its normal or emergency limits when the network loses any of its lines. The power supply radius of the following lines refers to the line length between the low-voltage side of the substation (distribution transformer) and the farthest load point of the line to its power supply.
(3) Flexibility
Flexibility includes the capacity-load ratio and the connection rate of stations. The capacity-load ratio is utilized to measure the coordination of the load and the capacity of the power grid. It can determine whether the capacity can meet the load demand and cannot result in excessive investment. The connection rate of stations is an index which reflects the structure of the distribution network. The outgoing line of the substation has clear advantages in enhancing the structure of the distribution network, load transfer, and in improving the reliability and the economy of the distribution network. The equations of the two indices can be given as follows:
Rs=
∑S
Pmax (4)
whereRsis the capacity-load ratio;∑Sis the total capacity of transformer;Pmaxis the peak load.
f = n
∑
i,j=1,i6=j Nij n
∑
i=1Ni n
∑
i,j=1,i6=j Nij
(5)
where f is the connection rate of stations;Niis the number of outgoing lines of theith substation;Nij is the number of lines in connection with thejth substation in the outgoing line of theith substation.
2.2.2. Economic Benefit
Regarding the market economy, economic rationality needs to be paid attention in addition to the technical feasibility of the distribution network. Considering the time value of the capital, the planning scheme should have high economic benefits. Therefore, the economic benefit of the distribution network is evaluated from the aspects of the technical economic benefit and the financial benefit of the enterprise.
(1) Technical Economic Benefit
The equipment utilization ratio is the ratio of actual operating indicators of the elements to the rated operating indicators of the elements. The formulas of these indices are given as:
PL = n
∑
i=1 n
∑
j=1ViVjGijcosθij QL=−
n
∑
i=1 n
∑
j=1ViVjBijcosθij
(6)
wherePL is the loss of active power; QL is the loss of reactive power;θijis phase angle difference between theθiof the node voltageViand theθjof the node voltageVj;GijandBijare respectively the corresponding elements of the admittance matrix.
η= PL
cosϕ×SN ×100% (7)
whereηis the equipment utilization ratio;PL is the actual maximum load of the equipment (MW); cosϕis the power factor;SNis the rated capacity (MVA).
(2) Financial Benefit of the Enterprise
Net present value and the payback period of investment constitute the financial benefit of the enterprise. Net Present Value (NPV), which is most frequently used in the equipment Life Cycle Cost (LCC) method, can reflect the return of the capital effectively. If NPV is negative, then the project is not desirable. Conversely, if the NPV is positive, then the investment income may be higher as the NPV becomes larger. The payback period of investment represents the time required to offset the total investment of the project after completion of the project, which is the indicator of the turnover rate of the capital. The two indices can be defined by:
NPV =
n
∑
t=0[B(t)−Cs(t)](P/F,r,t) (8)
whereB(t)is the added value of thetth year;Cs(t)is the cost for equipment maintenance in thetth year;Pis the present value;Fis the final value;ris the discount rate.
Pt
∑
t=1(CIn,t−COut,t)(1+i)t=0 (9)
wherePtis the payback period of investment;CIn,tandCOut,tare the cash inflow and cash outflow of thetth year;iis the interest rate.
2.2.3. Social Benefit
The continuous development of power supply enterprises and the improvement of service quality can make positive contributions to promoting the development of society and the improvement of people’s living standards. The enhancement of the reliability and the quality of the power supply can be conductive to the increment of economic benefit. The planning and transformation of the distribution network effectively contributes to the conservation of energy, resources, and the environment. Given the social economy, social environment, and natural environment, this paper analyzes the social benefit of the distribution network.
(1) Social Economic Benefit
development. Thus, in this paper the direct contribution rate of the GDP is applied to identify the influence of distribution network planning on the national economy. The annual revenue of electricity sales can be estimated by using the annual load forecasting of the specific power distribution network planning project and the corresponding electricity price. The GDP can be estimated using the method proposed by Abeysinghe [29]. The formula is:
S= C
G×100% (10)
whereSis the direct contribution rate of the GDP;Cis the annual revenue of electricity sales;Gis the GDP of the corresponding year.
(2) Social Environment Benefit
The implementation of power distribution network planning projects, which may promote the development of the power industry and related industries, can bring a significant direct employment benefits and indirect employment benefit. The direct employment benefit is the direct employment opportunities that the project itself can provide. The indirect employment benefit refers to the indirect employment opportunities provided by the supporting or related projects of the distribution network planning project, as well as the additional investment produced by the construction of the project. In this research, the employment rate is used to measure the social environment benefit. The employment rate can be described as follows:
r= et
Et×100% (11)
where ris the employment rate; et is the new employment brought by the distribution network planning projects directly and indirectly in thetth year according to the specific project;Etis the total number of new employment in thetth year estimated by historical employment data.
(3) Natural Environment Benefit
The environment quality is a qualitative concept of environmental assessment stemming from the specific needs of humans, which can reflect the human expectations of all elements of the environment. The optimal planning of the power distribution network is conducive to reducing the network loss and saving land area, and achieving the goals of energy-saving and emission reduction, thus obtaining potential natural environment benefit.
3. Comprehensive Benefit Evaluation of Power Distribution Network Planning Based on Improved IAHP and Multi-Level Extension Assessment Method
3.1. Improved IAHP Method
Different indexes have different natures, meanings, and influences on the evaluation system. Index weights reflect their importance in the index system, but the determination of index weight tends to be affected by subjective factors greatly. Therefore, the choice of an appropriate method to determine the index weight is directly related to the rationality of the comprehensive evaluation result.
flexible. Thus, large errors may be produced using this approach. In addition, the “point” data tends to be inappropriate since incomplete information can lead to uncertain judgments of the experts when making decisions.
Concerning the aforementioned limitations, this paper adopts the IAHP, which was proposed by Wu [31], to determine the relative importance of the benefit index of urban distribution network planning. Using interval number theory, IAHP can be utilized to solve the uncertainty and fuzzy problems under the condition of incomplete information [31]. For instance, Zhang evaluated the relative mining intensity in western China based on IAHP, and obtained high results [32]. Moreover, considering the incomplete consistency of the judgment matrix obtained by the pertinent experts, in this paper the consistency test method based on the linear programming model is applied to improve the IAHP method to provide more complete information for decision makers [33].
3.1.1. Establishment of the Hierarchy Structure of the Benefit Evaluation Index System
In light of the basic principles of AHP, the hierarchy structure is shown in Table1through analysis of the influencing factors of the comprehensive benefit of distribution network planning.
3.1.2. Establishment of the Hierarchy Structure of the Benefit Evaluation Index System
On the basis of the reciprocity rule of a 1−9 scale, the relative importance of each evaluation index can be compared and we can obtain the interval number judgment matrix as follows [34]:
A=
[1, 1] [a−12,a+12] · · · [a−1n,a+1n] [a−21,a+21] [1, 1] · · · [a−2n,a+2n]
..
. ... ...
[a−n1,a+n1] [a−n2,a+n2] · · · [a−nn,a+nn]
(12)
wherea+ij anda−ij are the upper limit and lower limit of the relative importance ofiandj.
Then, according to the operation rules of interval number theory [35], we obtainA= [A−,A+]
A+=
1 a+12 · · · a+1n a+21 1 · · · a+2n
..
. ... ...
a+n1 a+n2 · · · a+nn
, A− =
1 a−12 · · · a−1n a−21 1 · · · a−2n
..
. ... ...
a−n1 a−n2 · · · a−nn
(13)
whereA+is the upper matrix;A−is the lower matrix.
The largest eigenvalue and its corresponding normalized eigenvectors with positive components can be calculated by using the interval eigenvalue method [36]. The equations are as follows:
k= v u u u t n
∑
j=11 n
∑
i=1a + ij m= v u u u t n
∑
j=11 n
∑
i=1a − ij
(14)
λ−max=
n
∑
i=1(A−w−)i/nw−
i λ+max= n
∑
i=1(A+w+)i/nw+
i (15)
whereλmax− andλ+maxare the largest eigenvalues, andkandmare the coefficients ofλ−maxandλ+max.
3.1.3. Consistency Test of the Interval Number Judgment Matrix (1) Complete Consistency
corresponding to the maximum eigenvalue can be regarded as the weight of each index. At this point, the standard of the consistency check of the judgment matrix of the traditional AHP is the same as that of the interval number judgment matrix.
(2) Incomplete Consistency
If the judgment matrix does not satisfy the complete consistency condition, the matrix can be considered as an incomplete consistent judgment matrix. The standard of the consistency check of the interval number judgment matrix is different from that of the traditional IAHP. In order to eliminate the complex computing process of weight, this study improves upon the traditional IAHP [33]. The standard of incomplete consistency check of the improved IAHP is shown in the following equation:
z∗= n
∑
i=1(w+i −w_i)<R (16)
where z∗ represents the consistency of the interval number judgment matrix, the smaller z∗, the better the consistency;nis the order of the judgment matrixA;Ris the relative coefficient ofz∗and conformance rate (n=3,R=0.9376;n=4,R=0.8266);w+andw−are the normalized eigenvectors that correspond to the maximum eigenvaluesλ+maxandλ−max. If the judgment matrix passes the test, the degree of inconsistency is in the permissible range and eigenvectors corresponding to the maximum eigenvalue can be regarded as the weight of each evaluation index.
3.2. Multi-Level Extension Assessment Method
Extension evaluation is one of the important applications of extension theory which was proposed by Cai [22]. Extension evaluation can conduct the qualitative and quantitative analyses by using the correlation function, and determine the rank of the object to be evaluated. However, the traditional extension evaluation is only limited to the evaluation of a single factor. Therefore, when the evaluation object contains a number of indicators and categories, it is necessary to expand the theory of single-factor extension evaluation to solve the problems of multi-factor evaluation. Based on the single-factor extension evaluation, the multi-level extension evaluation method introduces the index weight and can obtain the result of the multi-level extension evaluation of the object to be evaluated according to the maximum membership degree law. The following steps constitute the multi-level extension evaluation method:
Step 1: Determine Classical Field
All indices can be divided into j(j = 1, 2, 3,· · ·,n) levels and described as the following matter-element model. The classical field is represented by [25]:
Rj= (Nj,Ck,Vjk) =
Nj C1 Vj1 C2 Vj2
.. . ... Cm Vjm
=
Nj C1 <aj1,bj1> C2 <aj2,bj2>
..
. ...
Cm <ajm,bjm>
(17)
Step 2: Determine Controlled Field
The controlled field is shown as follows [25]:
Rp= (P,Ck,Vpk) =
P C1 Vp1 C2 Vp2
.. . ... Cm Vpm
=
P C1 <ap1,bp1> C2 <ap2,bp2>
..
. ...
Cm <apm,bpm>
(18)
where P is the object with the grade; Vpk =< apk,bpk > (j = 1, 2,· · ·,n;k = 1, 2,· · ·,m) is the corresponding value range ofPpertinent toCk.
Step 3: Determine the Matter-Element to Be Evaluated
The matter-element to be evaluated can be described as [25]:
R= (N,Ck,Vk) =
N C1 V1 C2 V2
.. . ... Cm Vm
(19)
whereRis the matter-element to be evaluated;Vkis the value range ofNrelated toCk. Step 4: Establish the Correlation Function and Compute the Correlation Degree
Establishing the correlation function can make the correlation degree between the object to be evaluated and the classical field of the matter-element model more accurate without relying on subjective judgment or statistics. The correlation degree can be calculated as follows [25]:
Kj(Vk) =
ρ(Vk,Vjk)
ρ(Vk,Vpk)−ρ(Vk,Vjk) Vk∈/Vjk
−ρ(Vk,Vjk)
|Vjk| Vk∈Vjk
(k=1, 2,· · ·,m;j=1, 2,· · ·,n)
(20)
whereKj(Vk)is the correlation degree of thekth index pertinent to thejth level;
Vjk
is the distance
of the classical field of the kth index pertinent to the jth level; ρVk,Vjk
is the distance of the matter-element to be evaluated related to thekth index and the jth level with the corresponding classical field;ρVk,Vpk
is the distance of the matter-element to be evaluated relative to thekth index and the controlled field, and
ρVk,Vjk
= Vk−
ajk+bjk
2
−
bjk−ajk
2 ρVk,Vpk
= Vk−
apk+bpk 2
−
bpk−apk 2
(21)
Step 5: Multi-Level Extension Assessment
Using the weight obtained by the improved IAHP method and the correlation degree of the inferior index, the correlation function value of the superior index and the overall object related tojth level can be calculated by formula (22) [25].
Kj(N) = m
∑
i=1WiKj(Vi) (22)
According to the maximum membership degree law, the evaluation results of the different indicators, and the object to be assessed can be gained by:
Kj(N) = max
1≤j≤nKj(N) (23) In addition, in order to reflect the level of the object to be evaluated more accurately, the membership grade of the object to be evaluated can be obtained by calculating the eigenvalue of the grade variable, and then the overall development trend of the object to be evaluated can be determined [25].
Kj(N) =
Kj(N)− max 1≤j≤nKj(N) max
1≤j≤nKj(N)−1≤minj≤nKj(N)
(24)
j∗= n
∑
j=1jKj(N) n
∑
j=1Kj(N)
(25)
wherej∗is the grade variable eigenvalue ofN.
3.3. Evaluation Process of the Comprehensive Benefit of Urban Distribution Planning
In this paper, the improved IAHP and multi-level extension assessment methods are employed to evaluate the comprehensive benefit of urban distribution planning. The proposed method does not need to judge the degree of membership of each index according to the experience of experts, and reduces the influence of subjective factors on the evaluation results. Thus, the evaluation results seem more scientific and reasonable. The evaluation process is shown in Figure1.
4. Case Study
In this paper, a power distribution planning project of one city in China was used to validate the proposed model based on the improved IAHP and multi-level extension assessment methods. The “point” load forecasting method and the growth rate method are utilized to predict the future load demand in this power project. According to the relevant information of the distribution network planning project to be constructed and the relevant equations provided in this study, the actual data of the comprehensive benefit evaluation index is listed in Table13.
4.1. Classification of Evaluation Index
In light of how the State Grid Corporation of China uses scoring rules for project evaluation classification, the comprehensive benefit evaluation effects of the power distribution network planning project can be classified into four grades: poor, fair, good, and better, corresponding to N= (N1,N2,N3,N4). The score range of each grade is divided as shown in Table2.
Table 2.Division rule of grades.
Evaluation Grade (N) N1 N2 N3 N4
Score range [0, 60] [60, 75] [75, 90] [90, 100]
Evaluation effects Poor Fair Good Better
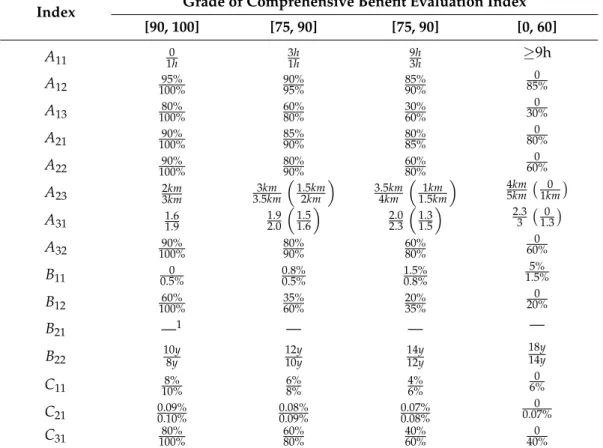
Then, on the basis of the above division rule of grades and the relevant standards [37], the division criteria of the comprehensive benefit evaluation index of the power distribution network planning project can be given as shown in Table3.
Table 3.Division criteria of the comprehensive benefit evaluation index.
Index Grade of Comprehensive Benefit Evaluation Index
[90, 100] [75, 90] [75, 90] [0, 60]
A11 10h 31hh 9
h
3h ≥9h
A12 100%95% 90%95% 85%90% 85%0
A13 100%80% 60%80% 30%60% 30%0
A21 100%90% 85%90% 80%85% 80%0
A22 100%90% 80%90% 60%80% 60%0
A23 23kmkm 3.53kmkm
1.5km 2km
3.5km 4km
1km 1.5km
4km
5km 1km0
A31 1.61.9 1.92.01.51.6 2.02.31.31.5 2.33 1.30
A32 100%90% 80%90% 60%80% 60%0
B11 0.5%0 0.8%0.5% 1.5%0.8% 1.5%5%
B12 100%60% 35%60% 20%35% 20%0
B21 —1 — — —
B22 108yy
12y 10y
14y 12y
18y 14y
C11 10%8% 6%8% 4%6% 6%0
C21 0.09%0.10% 0.08%0.09% 0.07%0.08% 0.07%0
C31 100%80% 60%80% 40%60% 40%0
4.2. Determine the Classical Field and Controlled Field
According to the division rules of grades and using the index “A1”as an example, the classical field and the controlled field of the comprehensive benefit evaluation index can be shown as follows:
R1(A1) =
N1 A11 <0, 60>
A12 <0, 60>
A13 <0, 60>
R2(A1) =
N2 A11 <60, 75>
A12 <60, 75>
A13 <60, 75>
R3(A1) =
N3 A11 <75, 90>
A12 <75, 90>
A13 <75, 90>
R4(A1) =
N4 A11 <90, 100>
A12 <90, 100>
A13 <90, 100>
Rp(A1) =
Np A11 <0, 100>
A12 <0, 100>
A13 <0, 100>
4.3. Calculate Index Weight and Correlation Degree
The specific score of each evaluation index can be obtained by the actual planning data of the city, which is described in Table13. For the index without a unified evaluation standard, the score can be determined by the expert scoring method based on the real data of the index. And, the scores of the remaining indicators can be determined according to the criteria and the actual values given in Tables3
and13. The weights of all indices can be obtained according to Tables4–12, and the consistency tests of all the judgment matrixes have been checked by using the method involved in this study.
Table 4.The calculation results of the first-level index.
A B C x− x+ k m Interval Weights
A [1, 1] [1/4, 1/3] [4, 5] 0.488 0.481
0.967 1.023
[0.472, 0.492]
B [3, 4] [1, 1] [6, 7] 0.349 0.363 [0.337, 0.371]
C [1/5, 1/4] [1/7, 1/6] [1, 1] 0.081 0.078 [0.078, 0.080]
Table 5.The calculation results of the “A” index.
A1 A2 A3 x− x+ k m Interval Weights
A1 [1, 1] [1, 2] [4, 5] 0.511 0.515
0.919 1.076
[0.469, 0.554]
A2 [1/2, 1] [1, 1] [3, 4] 0.371 0.381 [0.341, 0.410]
A3 [1/5, 1/4] [1/4, 1/5] [1, 1] 0.118 0.104 [0.108, 0.112]
Table 6.The calculation results of the “B” index.
B1 B2 x− x+ k m Interval Weights
B1 [1, 1] [1/5,1/3] 0.208 0.208 0.957 1.041 [0.199, 0.217]
B2 [3, 5] [1, 1] 0.792 0.792 [0.758, 0.824]
Table 7.The calculation results of the “C” index.
C1 C2 C3 x− x+ k m Interval Weights
C1 [1, 1] [5, 6] [2, 3] 0.597 0.598
0.952 1.039
[0.569, 0.621]
C2 [1/6, 1/5] [1, 1] [1/5, 1/4] 0.091 0.087 [0.087, 0.090]
Table 8.The calculation results of the “A1” index.
A11 A12 A13 x− x+ k m Interval Weights
A11 [1, 1] [1/4,1/3] [3, 4] 0.249 0.246
0.961 1.032
[0.240, 0.254]
A12 [3, 4] [1, 1] [5, 7] 0.660 0.662 [0.634, 0.683]
A13 [1/4, 1/3] [1/7,1/5] [1, 1] 0.091 0.092 [0.087, 0.095]
Table 9.The calculation results of the “A2” index.
A21 A22 A23 x− x+ k m Interval Weights
A21 [1, 1] [3, 4] [4, 5] 0.943 0.935
0.964 1.035
[0.910, 0.968]
A22 [1/4, 1/3] [1, 1] [1, 8/5] 0.260 0.280 [0.251, 0.290]
A23 [1/5, 1/4] [5/8, 1] [1, 1] 0.206 0.218 [0.199, 0.225]
Table 10.The calculation results of the “A3” index.
A31 A32 x− x+ k m Interval Weights
A31 [1, 1] [1/3, 1] 0.375 0.375 0.886 1.118 [0.346, 0.419]
A32 [1, 3] [1, 1] 0.625 0.625 [0.541, 0.699]
Table 11.The calculation results of the “B1” index.
B11 B12 x− x+ k m Interval Weights
B11 [1, 1] [2, 3] 0.708 0.708 0.957 1.041 [0.678, 0.737]
B12 [1/3,1/2] [1, 1] 0.292 0.292 [0.279, 0.304]
Table 12.The calculation results of the “B2” index.
B21 B22 x− x+ k m Interval Weights
B21 [1, 1] [3, 4] 0.775 0.775 0.975 1.025 [0.755, 0.794]
B22 [1/4,1/3] [1, 1] 0.225 0.225 [0.219, 0.231]
Table 13.The distance of the third-level index, the classical field, and the basic data.
Second-Level Index
Interval Weights
Third-Level Index
Actual
Values Scores
Interval Weights
Distance of the Third-Level Index to be Evaluated Relative to the Classical Field
j=1 j=2 j=3 j=4 A1 [0.469, 0.554]
A11 2 hour 83 [0.240, 0.254] −0.575 −0.320 0.467 −0.151 A12 99.96% 99 [0.634, 0.683] −0.975 −0.960 −0.900 0.100 A13 50% 70 [0.087, 0.095] −0.180 0.333 −0.143 −0.210
A2 [0.341, 0.410]
A21 94% 94 [0.910, 0.968] −0.850 −0.760 −0.400 0.400 A22 93% 93 [0.251, 0.290] −0.825 −0.720 −0.300 0.300 A23 2.5 km 95 [0.199, 0.225] −0.875 −0.800 −0.500 0.500
A3 [0.108, 0.112] AA31 1.82 97 [0.346, 0.419] −0.925 −0.880 −0.700 0.544 32 75% 71 [0.541, 0.699] −0.275 0.267 −0.121 −0.310 B1 [0.199, 0.217] BB11 0.7% 85 [0.678, 0.737] −0.625 −0.400 0.333 −0.250 12 55% 87 [0.279, 0.304] −0.675 −0.480 0.200 −0.188 B2 [0.758, 0.824] BB21 46 72 [0.755, 0.794] −0.300 0.200 −0.097 −0.391 22 11.5 year 78 [0.219, 0.231] −0.450 −0.120 0.200 −0.353 C1 [0.569, 0.621] C11 7.4% 86 [1.000, 1.000] −0.650 −0.440 0.267 −0.222 C2 [0.087, 0.090] C21 0.084% 82 [1.000, 1.000] −0.550 −0.280 0.467 −0.308 C3 [0.297, 0.328] C31 62% 76 [1.000, 1.000] −0.400 −0.040 0.067 −0.368
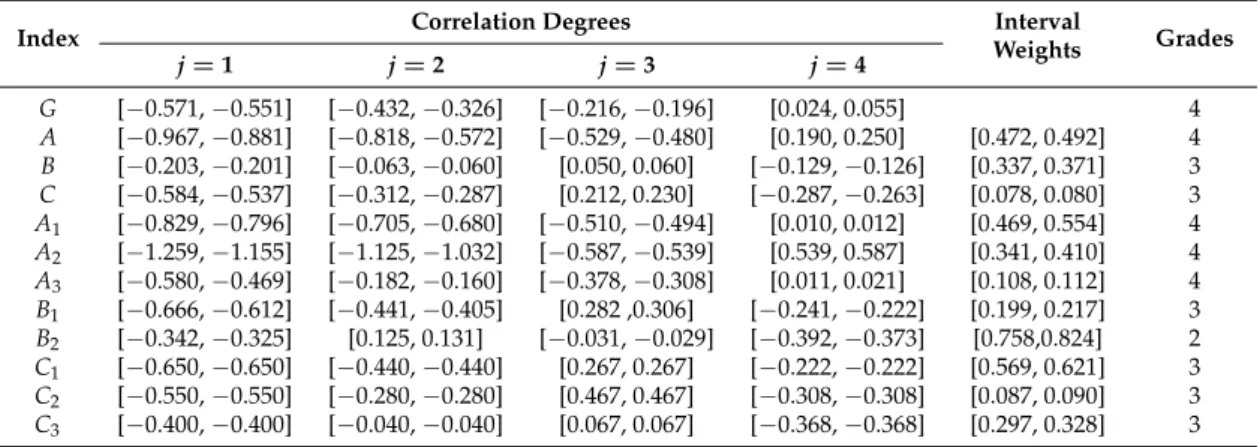
Table 14. Multi-level extension assessment results for the comprehensive benefit evaluation of the power distribution network planning project.
Index Correlation Degrees WeightsInterval Grades
j=1 j=2 j=3 j=4
G [−0.571,−0.551] [−0.432,−0.326] [−0.216,−0.196] [0.024, 0.055] 4 A [−0.967,−0.881] [−0.818,−0.572] [−0.529,−0.480] [0.190, 0.250] [0.472, 0.492] 4 B [−0.203,−0.201] [−0.063,−0.060] [0.050, 0.060] [−0.129,−0.126] [0.337, 0.371] 3 C [−0.584,−0.537] [−0.312,−0.287] [0.212, 0.230] [−0.287,−0.263] [0.078, 0.080] 3 A1 [−0.829,−0.796] [−0.705,−0.680] [−0.510,−0.494] [0.010, 0.012] [0.469, 0.554] 4 A2 [−1.259,−1.155] [−1.125,−1.032] [−0.587,−0.539] [0.539, 0.587] [0.341, 0.410] 4 A3 [−0.580,−0.469] [−0.182,−0.160] [−0.378,−0.308] [0.011, 0.021] [0.108, 0.112] 4 B1 [−0.666,−0.612] [−0.441,−0.405] [0.282 ,0.306] [−0.241,−0.222] [0.199, 0.217] 3 B2 [−0.342,−0.325] [0.125, 0.131] [−0.031,−0.029] [−0.392,−0.373] [0.758,0.824] 2 C1 [−0.650,−0.650] [−0.440,−0.440] [0.267, 0.267] [−0.222,−0.222] [0.569, 0.621] 3 C2 [−0.550,−0.550] [−0.280,−0.280] [0.467, 0.467] [−0.308,−0.308] [0.087, 0.090] 3 C3 [−0.400,−0.400] [−0.040,−0.040] [0.067, 0.067] [−0.368,−0.368] [0.297, 0.328] 3
4.4. Rate the Comprehensive Benefit of the Power Distribution Network Planning Project
From Table6, according to the maximum membership degree law, it can be concluded that K4(N) = max
In addition, from Table6the evaluation effect of safety is “better”, which is higher than that for reliability and flexibility, illustrating that safety is the key factor for enhancing the technical benefit. The evaluation effect of operating economic benefit is better than the financial benefit of the enterprise, indicating that the optimization of the power supply region division, adopting the energy-saving equipment, improving the cable using rate, reasonable reactive power compensation, and maximally reducing the integrated network loss all seem very necessary to enhance the financial benefit of the enterprise. And the evaluation effect of the social environment benefit is better than both the social economic benefit and natural environment benefit, implying that the social environment should get more attention with regards to improving the social benefit. Thus, in order to further improve the comprehensive benefit of the power distribution network construction project, it may be reasonable to focus on the safety, operating economic benefit, and social economic benefit.
5. Conclusions
In this paper, a new comprehensive benefit evaluation approach of the power distribution network planning project based on the improved IAHP approach and the multi-level extension assessment method is proposed. First, according to the principle of AHP, the comprehensive benefit evaluation index system can be constructed considering technical benefit, economic benefit, and social benefit. Then, in order to alleviate the impacts of subjective factors on the evaluation results, the interval number is applied to replace the element of judgment matrix. And a novel method of consistency testing based on the linear programming model is put forward to address the issue of incomplete consistency of the interval number judgment matrix. Moreover, combined with the experience of power experts and quantitative analysis, a comprehensive benefit evaluation method on the basis of multi-level extension assessment theory is formulated to accommodate the flexible characteristic of the power distribution network planning project. The feasibility of this proposed approach has been verified by using the analysis of an example and by proposing some measures to improve the comprehensive benefit. The experimental results indicate that the comprehensive benefit grade of the power distribution network planning project is “better” since the correlation degree is [0.024, 0.055] at j=4 and the benefit grade variable eigenvalue isj∗ ∈[3.33, 3.418]∈[3, 4]. In brief, this paper offers a new method to solve similar problems of power distribution network construction projects.
Acknowledgments:This study is supported by the Humanities and Social Sciences Planning Foundation of the Ministry of Education of China (Grant No. 16YJA790052).
Author Contributions:Qunli Wu designed this paper and provided overall guidance; Chenyang Peng wrote the whole manuscript.
Conflicts of Interest:The authors declare no conflict of interest.
References
1. Li, W.; Wang, P.; Li, Z.; Liu, Y. Reliability evaluation of complex radial distribution systems considering restoration sequence and network constraints.IEEE Trans. Power Deliv.2004,19, 753–758. [CrossRef] 2. Hu, B.; He, X.-H.; Cao, K. Reliability evaluation technique for electrical distribution networks considering
planned outages.J. Electr. Eng. Technol.2014,9, 1482–1488. [CrossRef]
3. Bai, H.; Miao, S.; Zhang, P.; Bai, Z. Reliability evaluation of a distribution network with microgrid based on a combined power generation system.Energies2015,8, 1216–1241. [CrossRef]
4. Dumbrava, V.; Lazaroiu, C.; Roscia, C.; Zaninelli, D. Expansion planning and reliability evaluation of distribution networks by heuristic algorithms. In Proceedings of the 2011 10th International Conference on Environment and Electrical Engineering (EEEIC), Rome, Italy, 8–11 May 2011; pp. 1–4.
6. Makinen, A.; Partanen, J.; Lakervi, E. Reliability evaluation as part of computer-aided power distribution network design. In Proceedings of the IEEE International Symposium on Circuits and Systems, Espoo, Finland, 7–9 June 1988; pp. 1631–1634.
7. Jayaweera, D.; Islam, S. Security assessment in active distribution networks with change in weather patterns. In Proceedings of the International Conference on Probabilistic Methods Applied to Power Systems (PMAPS), Durham, UK, 7–10 July 2014; pp. 1–6.
8. Nahman, J.; Peric, D. Distribution system performance evaluation accounting for data uncertainty.
IEEE Trans. Power Deliv.2003,18, 694–700. [CrossRef]
9. Šari´c, M. Fuzzy approach for evaluating risk of service interruption used as criteria in electricity distribution network planning. In Proceedings of the 2014 12th Symposium on Neural Network Applications in Electrical Engineering (NEUREL), Belgrade, Serbia, 25–27 November 2014; pp. 79–84.
10. Dashti, R.; Yousefi, S.; Moghaddam, M.P. Comprehensive efficiency evaluation model for electrical distribution system considering social and urban factors.Energy2013,60, 53–61. [CrossRef]
11. Cheumchit, T.; Borchard, T. Benefits from the comprehensive planning of the high and medium voltage network.Int. Energy J.2007,8, 7–14.
12. Borchard, T.; Haubrich, H.-J. Evaluating the benefit of voltage comprehensive planning of high and medium voltage networks. In Proceedings of the Third International Conference on Electric Utility Deregulation and Restructuring and Power Technologies, DRPT 2008, Nanjing, China, 6–9 April 2008; pp. 823–828.
13. Fan, C.; Dou, F.; Tong, B.; Long, Z. Risk analysis based on ahp and fuzzy comprehensive evaluation for maglev train bogie.Math. Probl. Eng.2016. [CrossRef]
14. Ma, X.; Lu, S.; Zhou, Y. The post-evaluation index system for preparatory work of transmission and transformation projects. In Proceedings of the Power Engineering and Automation Conference (PEAM), Wuhan, China, 8–9 September 2011; pp. 363–366.
15. Wang, H.; Lin, Z.; Wen, F.; Huang, J. A comprehensive evaluation index system for power system operation. In Proceedings of the International Conference on Sustainable Power Generation and Supply (SUPERGEN 2012), Hangzhou, China, 8–9 Septemebr 2012; pp. 1–6.
16. Yang, W.; He, Y.; Li, D.; Li, Y.; Li, F. Comprehensive post-evaluation method of power network renovation project based on fuzzy interval evaluation and analytic hierarchy process. Power Syst. Technol.2009,33, 33–37.
17. Zhang, G.-Q.; Zhang, W.; Xu, Z.-F. Transformer substation construction project postevaluation base on improved gray fuzzy theory. In Proceedings of the 2011 International Conference on Electric Technology and Civil Engineering (ICETCE), Lushan, China, 22–24 April 2011; pp. 1829–1832.
18. Wang, Z.; Fan, L.; Su, H. A comprehensive power quality evaluation model based on interval number theory.
Power Syst. Prot. Control2012,40, 41–45.
19. Zeng, M.; Zou, J.; Xu, W.; Liu, H.; Liu, C. Estimation of life-cycle emission reduction benefits for wind power project based on interval-number theory.Autom. Electr. Power Syst.2011,35, 17–21.
20. Huang, G.; Yang, C.; Wu, Z.; Liu, H. Application of interval analytic hierarchy process in construction safety management. In Proceedings of the 2010 International Conference on E-Product E-Service and E-Entertainment (ICEEE), Jiaozuo, China, 7–9 November 2010; pp. 1–4.
21. Wei, W.; Huang, J.; Luo, F.Z.; Chen, F.; Bao, H.L.; Yang, J.L. Applications of interval theory in the evaluation and decision making of power system projects.Appl. Mech. Mater.2013,385–386, 1873–1878. [CrossRef] 22. Cai, W. Extension theory and its application.Chin. Sci. Bull.1999,44, 1538–1548. [CrossRef]
23. He, Y.-X.; Dai, A.-Y.; Zhu, J.; He, H.-Y.; Li, F. Risk assessment of urban network planning in china based on the matter-element model and extension analysis. Int. J. Electr. Power Energy Syst. 2011,33, 775–782. [CrossRef]
24. Li, C.; Liu, Y.; Li, S. Risk evaluation of qinghai–tibet power grid interconnection project for sustainability.
Sustainability2016,8, 85. [CrossRef]
25. Li, H.-Z.; Guo, S. External economies evaluation of wind power engineering project based on analytic hierarchy process and matter-element extension model.Math. Probl. Eng.2013. [CrossRef]
26. Zhao, B.; Xu, W.; Liang, G.; Meng, Y. Stability evaluation model for high rock slope based on element extension theory.Bull. Eng. Geol. Environ.2015,74, 301–314. [CrossRef]
28. Xu, X.; Niu, D.; Qiu, J.; Wu, M.; Wang, P.; Qian, W.; Jin, X. Comprehensive evaluation of coordination development for regional power grid and renewable energy power supply based on improved matter element extension and topsis method for sustainability.Sustainability2016,8, 143. [CrossRef]
29. Abeysinghe, T.; Lee, C. Best linear unbiased disaggregation of annual gdp to quarterly figures: The case of malaysia.J. Forecast.1998,17, 527–537. [CrossRef]
30. Saaty, T.L. How to make a decision: The analytic hierarchy process. Eur. J. Oper. Res. 1990,48, 9–26. [CrossRef]
31. Wu, Y.; Zhu, W.; Li, X.; Gao, R. Interval approach to analysis of hierarchy porcess. J. Tianjin Univer.
Sci. Technol.1995,28, 700–705.
32. Zhang, N.; Pan, D.-J.; Zhao, Y.-M.; Li, C.-M.; Wu, H. Evaluation of relative mining intensity in western China based on interval analytic hierarchy process.Electron. J. Geotech. Eng.2014,19, 2941–2953.
33. Li, W.; Guo, J. Interval weights and consistency check of judgment matrix in the analytic hierarchy process.
J. Syst. Manag.2004,13, 530–532.
34. Ma, L.; Lu, Z.; Hu, H. A fuzzy comprehensive evaluation method for economic operation of urban distribution network based on interval number.Trans. China Electrotech. Soc.2012,27, 163–171.
35. Zeng, M.; Zhao, J.; Liu, H.; Xu, S. Investment benefit analysis based on interval number for distributed generation.Electr. Power Autom. Equip.2012,32, 22–26.
36. Guo, H.; Xu, H.; Liu, L. Threat assessment for air combat target based on interval topsis.Syst. Eng. Electron.
2009,31, 2914–2917.
37. SGCC. Corporate Standards of State Grid Corporation of China. InThe Guide of Planning and Design of Distribution Network; State Grid Corporation of China: Beijing, China, 2013; pp. 1–35. (In Chinese)


![Table 8. The calculation results of the “A1” index. A 11 A 12 A 13 x − x + k m Interval Weights A11 [1, 1] [1/4, 1/3] [3, 4] 0.249 0.246 0.961 1.032 [0.240, 0.254] A12 [3, 4] [1, 1] [5, 7] 0.660 0.662 [0.634, 0.683] A13 [1/4, 1/3] [1/7, 1/5] [1, 1] 0.091 0](https://thumb-ap.123doks.com/thumbv2/123deta/6875128.247294/14.892.120.772.166.282/table-calculation-results-a-index-interval-weights-a.webp)