Article
A Supernetwork-Based Model for Design Processes
of Complex Mechanical Products
Yu-Jie Zheng, Yu Yang *, Na Zhang and Yao Jiao
College of Mechanical Engineering, Chongqing University, Chongqing 400030, China; [email protected] (Y.-J.Z.); [email protected] (N.Z.); [email protected] (Y.J.)
* Correspondence: [email protected]; Tel./Fax: +86-23-6510-6606 Academic Editor: Marc A. Rosen
Received: 2 May 2016; Accepted: 27 September 2016; Published: 9 October 2016
Abstract: Complex mechanical products are a priority area of advanced manufacturing strategy in the USA and Europe. Excellent models for design processes of complex mechanical products are essential for managers or designers to manage design processes and further improve design efficiency. Multiple elements and complicated relationships between elements in the design processes of complex mechanical products cause difficulties in systematically and quantitatively expressing the design processes. Therefore, we put forth a supernetwork-based model for designing complex mechanical products. First, we identified the key elements in the design processes of complex mechanical products. Next, based on this we analyzed sub-elements of the key elements and relationships between sub-elements. Then we built sub-networks with sub-elements as nodes and their relationships as edges and the supernetwork model for design processes of complex mechanical products based on the sub-networks and their relationships. Meanwhile, we also present a method for combining linguistic variables with the corresponding triangular fuzzy numbers, and a max/min synthesis method to accurately compute the edge weights. Finally, we suggest the practical applications of the proposed model and give a comparison of the proposed model and existing ones to verify the feasibility and validity of this study.
Keywords:design processes of complex mechanical products; supernetwork; design structure; design tasks; design resources
1. Introduction
With the global economic downturn, the U.S. and German governments have developed “a national strategic plan for advanced manufacturing” [1] and “high-tech 2020” [2], respectively. Combining these strategies with the economic characteristics of China, the Chinese government presented “China manufacturing 2025” [3]. As mentioned in the above strategies, the development of the equipment manufacturing industry significantly facilitates economic growth. In the equipment manufacturing industry, most products are complex mechanical ones [4]. In the whole life cycle of complex mechanical products, the design process is crucial for companies to maintain a competitive advantage [5–7]. As a tool for representing, understanding, and managing design processes, an advanced model of the design processes of complex mechanical products is important to help managers enhance design efficiency and competitive advantage [8]. Therefore, it is important to model the design processes of complex mechanical products exactly.
Some models for the design processes of complex mechanical products have been developed. Zhou et al. built a Meta synthesis model from the perspective of the design cycle and task granularity [9,10], but the model failed to quantify the relationships between tasks. Van et al. [11], Jia et al. [12], Cao, Qin, and Wang [13], Liu et al. [14] presented a model based on Petri Net from the point of view of the design tasks of mechanical products, but it is difficult given their complexity.
Meanwhile, there are many matrix forms to express the design processes. Specifically, [15–20] developed a Design Structure Matrix (DSM)-based model for the design structures of complex mechanical products. Van, Jia, and Cao [21], Qin, Wang, and Liu [22] established a model based on the Design Relation Matrix (DRM) from the point of view of the design structures of complex
mechanical products. Bartolomei et al. [23] presented the Multiple-Domain Matrix (MDM) as
an organizing framework for modeling engineering systems. Carley and Reminga [24] proposed a Meta-Matrix, which expressed the elements of organization and their relationships. Although the above studies [15–24] make great contributions to modeling design processes, there are still some flaws: firstly, the non-graphical expression of matrix decreases visualization. Secondly, DSM and DRM fail to denote the types of relationships lying on the same hierarchy of matrixes or quantify relationships between different hierarchies of matrixes. Although MDM can express the relationships between different types of elements, it fails in quantifying the relationships between the same type of elements. In addition, the above models mainly focus on design structures or tasks when expressing the design processes of complex mechanical products, neglecting the dependent relationships between elements in design processes such as structures, tasks, and resources. Due to the dependent relationships containing design information, the neglect of them may cause repeated design activities, and then impact on design efficiency.
From the above analyses, we can see that many studies concerning models for design processes of products have been performed. Some models apply to relatively simple products, fail to quantify the relationships between elements, or decrease visualization. Also, most of them neglect the relationships between elements in design processes such as design structures, tasks, and resources. Due to the dynamic factors in the design processes of complex mechanical products, the change in dynamic factors will be propagated by the relationships between elements and then impact on the elements in the design processes. For example, change is the rule in the design processes of complex mechanical products. A change in one part will, in most cases, cause changes in other parts, relevant tasks, and resources. Meanwhile, the different strength of relationships between elements will impact on elements of the design process. So, systematic and quantitative expression of the design processes of complex mechanical products is important to manage their design processes. Therefore, we present a supernetwork-based model for the design processes of complex mechanical products. As a highly abstract model of the real world, the supernetwork can model not only homogeneous nodes and their relationships, but also heterogeneous nodes and the relationships between them in a network [25–27]; it also appears to be effective in studying complex systems consisting of a variety of elements and relationships [28,29], and has been widely used to model intellectual, social, and supply chain areas [30–32]. In summary, the contributions of the paper are as follows: to help managers or designers better manage the design processes of complex mechanical products and enhance design efficiency, we present, for the first time, a supernetwork-based model of the design processes of complex mechanical products, which can systematically express the design processes of complex mechanical products by integrating three sets of key elements: design structures, tasks, and resources. Meanwhile, the proposed model also can quantitatively express the relationships between the three sets of key elements with edge weights. Using the proposed model, managers or designers can analyze the change impacts and importance of design elements more accurately, and know which parts should be assigned additional resources to respond to likely changes and so on.
2. Identify the Key Elements and Analyze Their Relationships in the Design Processes of Complex Mechanical Products
2.1. Identify Key Elements in the Design Processes of Complex Mechanical Products
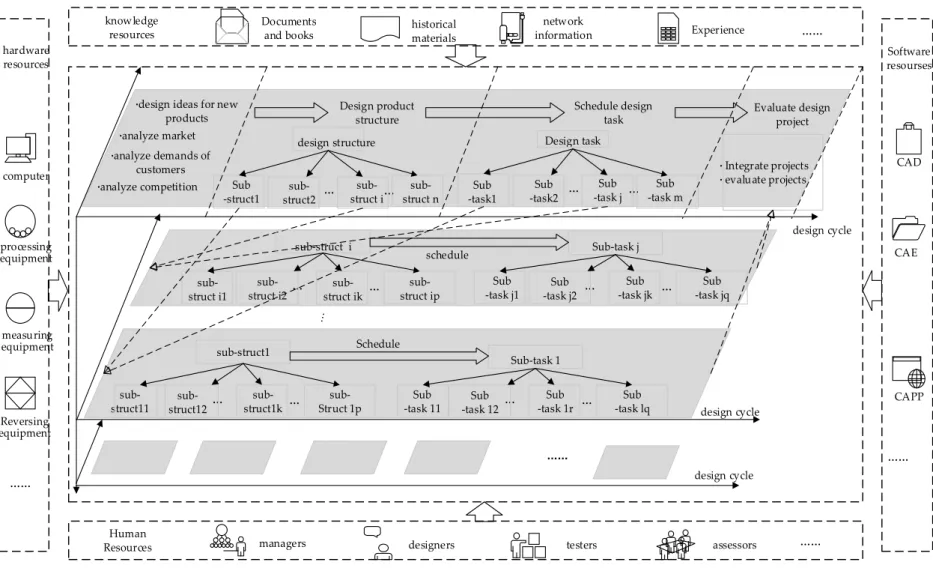
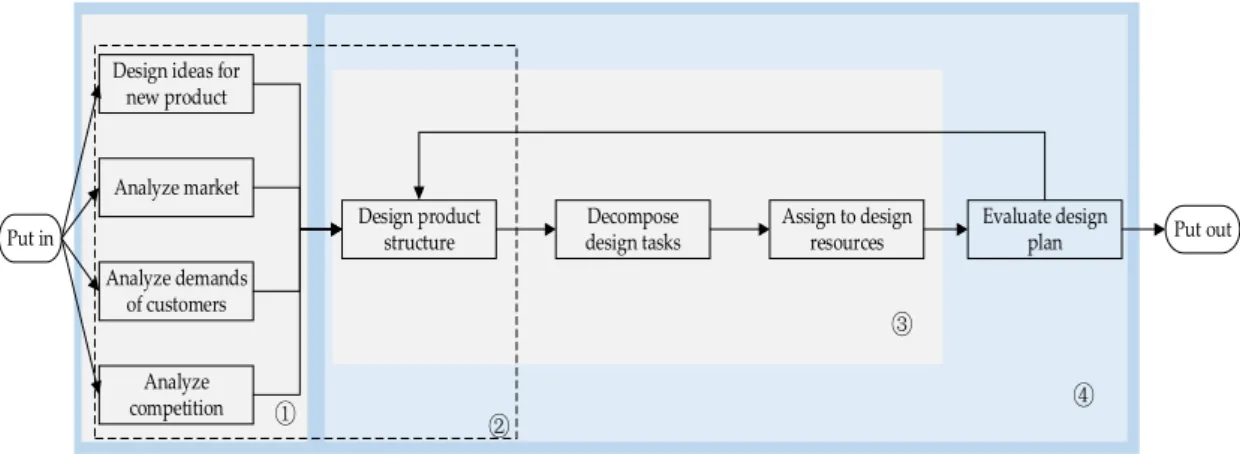
The design processes of complex mechanical products contain design tasks, parts, designers, and many other elements [33,34]. Based on previous studies, the design processes of complex mechanical products can be divided into four stages: product plan, concept design, detailed design, and trials/experimentation [35–43] as shown in Figure1. The general association among elements in design processes of complex mechanical products can be concluded as in Figure2.
According to the identification of key elements based on system function [44], the design process is a complex system structure composed of sequential structure, contractive structure, parallel structure, and feedback structure. According to the inferences 1–4 proposed by Bian and Guo [44], we can judge that the design structures, tasks, and resources are the key elements in the design processes of complex mechanical products. The significance of them is as follows:
(1) Design structures not only determine the functions of complex mechanical products, but also influence the decomposition of design tasks. Therefore, the design structures are key elements in the design processes of complex mechanical products.
(2) Design tasks are necessary activities to achieve design structures and functions of complex mechanical products. In turn, complex product design is a process of completing a series of design tasks. Therefore, design tasks are key elements in the design processes of complex mechanical products.
(3) Without knowledge, hardware, software, and human resources, design activities could not be carried out. Therefore, design resources are key elements in the design processes of complex mechanical products.
·designideas for new products Design product structure Schedule design task ·analyze market
… … Design task Sub -task2 Sub -task j
… … Sub
-task m Sub -task1 Evaluate design project design cycle · Integrate projects · evaluate projects
sub-struct1 sub-struct11 sub-struct12 sub-struct1k
… … Struct 1p
sub-Sub-task 1 Sub -task 11 Sub -task 12 Sub -task 1r
… … -task lqSub Schedule
…… sub-struct i
sub-struct i2
sub-struct ik
… …
sub-struct ip Sub-task j Sub -task j1 Sub -task j2 Sub -task jk
… … -task jqSub schedule sub-struct i1 hardware resources computer processing equipment measuring equipment Reversing equipment …… Human
Resources managers designers testers assessors ……
Software resourses CAD CAE CAPP …… knowledge resources Documents and books historical materials Experience network information …… design structure Sub -struct1 sub-struct2 sub-struct i sub-struct n design cycle design cycle ·analyze demands of
customers ·analyze competition
Put in
Design ideas for new product
Analyze market
Analyze demands of customers
Analyze competition
Design product structure
Decompose design tasks
Assign to design resources
Evaluate design
plan Put out
Figure 2.General associations between elements in design processes of complex mechanical products.
2.2. Analyze the Relationships between Design Structures of Complex Mechanical Products
Parts are sub-elements in the design structures of complex mechanical products. There are two types of relationships among parts, containment and associational relationships [45,46], as shown in Figure3.
(1) The containment relationship is longitudinal. It means a component is composed of parts. When a component needs to be adjusted, relevant parts should also be changed.
(2) The associational relationship is horizontal. When there is a change in any one part, other associational parts will be impacted.
legend parts
containment relationship associational relationship
Figure 3.Relationships between parts of complex mechanical products.
2.3. Analyze the Relationships between Design Tasks of Complex Mechanical Products
The sub-elements of design tasks of complex mechanical products comprise design sub-tasks that are formed by decomposing design tasks into certain granularity, coupling degree, and evenness [47,48]. A design task represents an effort that must be performed in order to achieve key milestones in design processes [49]. In general, its participants are work groups, the deliverables are information packages, and the timescales is weeks or months [50].
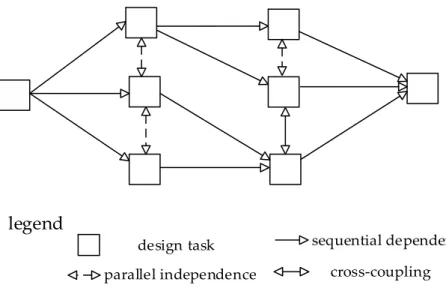
On the basis of previous research [51,52], the relationships between design tasks of complex mechanical products can be grouped into three types: sequential dependence, parallel independence, and cross-coupling, as shown in Figure4.
(1) Sequential dependence. If the execution of a task requires outputs from an upstream task as its inputs, but the execution of the upstream task does not require outputs from it as input, the relationship between the two tasks is sequential dependence.
(3) Cross-coupling. The relationship between the two tasks is bidirectional. The execution of a task requires outputs from an upstream task as its inputs, while the execution of the upstream task requires outputs from the one downstream as input. The relationship between the two tasks is cross-coupling.
legend
design task sequential dependence
cross-coupling parallel independence
Figure 4.Relationships between design tasks of complex mechanical products.
2.4. Analyze the Relationships between Design Resources of Complex Mechanical Products
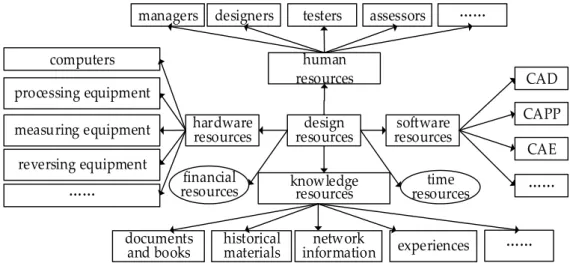
The design resources of complex mechanical products contain all the elements used in the design processes of complex mechanical products. They can be divided into six types: knowledge resources, human resources, hardware resources, software resources, financial resources, and time resources [53–55]. Among them, knowledge resources are documents, books, historical materials, network information, experience, and so on; human resources are participants in the design processes of complex mechanical products, such as managers, designers, testers, and assessors; hardware resources are computers, processing equipment, measuring equipment, reversing equipment, and so on; software resources are CAE, CAPP, CAD, and so on. For financial and time resources, they can be assigned to design tasks as special resources. The above design resources are shown in Figure5.
There are various relationships between design resources. Specifically, designers and testers use different hardware, software, and knowledge to design and test complex mechanical products; designers in different fields cooperate with each other to design new products. In addition, designers cooperate with testers and assessors to revise the design projects of new products. So, the relationships between design resources can be summarized as:
(1) Cooperative relationship. Managers, designers, testers, and assessors cooperate with each other to complete design tasks.
(2) Matching relationship. Different actors use different knowledge, hardware, and software resources in their fields to complete design tasks.
design
resources resourcessoftware
CAD
CAPP
CAE
…… hardware
resources computers
processing equipment
measuring equipment
……
reversing equipment
human resources
documents
and books historical materials informationnetwork experiences ……
managers designers testers assessors ……
knowledge resources financial
resources resourcestime
s s
j s
s
,
sFigure 5.Design resources of complex mechanical products.
3. Supernetwork-Based Model for Design Processes of Complex Mechanical Products
According to the relationships between elements in design processes of complex mechanical products, if the parts of complex mechanical products are viewed as nodes and their relationships are viewed as edges, design structures of complex mechanical products can be regarded as a sub-network model for design structures of complex mechanical products. Similarly, design sub-tasks and sub-resources are viewed as nodes and their relationships are viewed as edges, so the design tasks and resources can be regarded as a sub-network model for design tasks of complex mechanical products and a sub-network model for design resources of complex mechanical products, respectively. On the basis of the above analysis, design structures, tasks, and resources are viewed as nodes, and the relationships between design structures, tasks, and resources are viewed as edges, so the design processes of complex mechanical products can be viewed as a supernetwork consisting of three sub-networks: CPSN, CPTN, and CPRN.
3.1. Sub-Network for Design Structure of Complex Mechanical Products
vsi denotes parti in the design structure of a complex product. esij denotes the relationship between part i and j. wsij denotes the strength of esij. Then the set of nodes can be defined as Vs = {vsi,i=1, 2, 3, ...,m}. The set of edges can be defined as Es = esij,i,j=1, 2, ...,m,i6=j . In addition, the high value integration of complex mechanical products requires us to precisely express the design processes of complex mechanical products, so an edge weight is introduced, which denotes the strength of the relationships between elements. The set of edge weight can be defined asWs =wsij,i,j=1, 2, ...,m,i6=j . The sub-network for design structures of complex mechanical products can be defined as:
Gs = (Vs,Es,Ws). (1)
Note that there are directional edges and bi-directional edges in the sub-network-based model for design structures of complex mechanical products, denoting containment and associational relationships, respectively. Based on the above analysis,Gs is a directed network. In addition, to distinguish between the different sub-networks composed of sub-elements and their relationships, the relevant parameters of sub-networks for design structures, tasks, and resources are labeled with the subscripts “s”, “t” and “r”, respectively.
vs2andvs3.vs2containsvs4andvs5.vs2associates withvs3.vs4associates withvs5. The strength of the relationships among them for productAare shown in Table1.
Table 1.The strength of relationships between parts of productA.
vs1 vs2 vs3 vs4 vs5
vs1 0 0.4 0.2 0 0
vs2 0 0 0.4 0.1 0.2
vs3 0 0 0.5 0 0
vs4 0 0 0 0 0.2
vs5 0 0 0 0.6 0
Import the data from Table1into Ucinet and draw the sub-network for design structure of product Aas shown in Figure6.
E
Figure 6.The sub-network for design structure of productA.
3.2. Sub-Network for Design Tasks of Complex Mechanical Products
vtrdenotes taskrin the design tasks of complex mechanical products.etrldenotes the relationship between r and l. wtrl denotes the strength of etrl. Then the set of edges can be defined as Vt={vtr,r=1, 2, 3, ...,n}. The set of edges can be defined asEt={etrl,r,l=1, 2, ...,n,r6=l}. The set of edge weights can be defined asWt={wtrl,r,l=1, 2, ...,n,r6=l}. The sub-network for design tasks of complex mechanical products can be defined as:
Gt= (Vt,Et,Wt). (2)
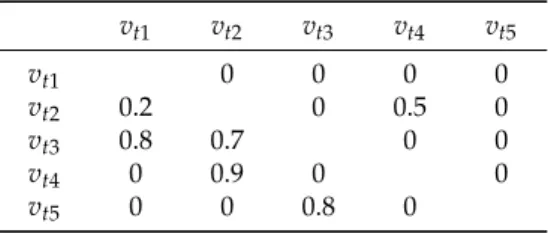
Likewise, the sub-network model for design tasks of complex mechanical products can be drawn by Ucinet software. For example, the set of tasks isVt={vt1, vt2,vt3,vt4,vt5}and the set of edges is Es = {es21,es24,es31,es32,es42,es53}. vt4is the parallel independence onvt5. vt2is the cross-coupling withvt3. vt1is the sequential dependence onvt2andvt3. The strength of the relationships between tasks is shown in Table2.
Table 2.The strength of the relationships between design tasks.
vt1 vt2 vt3 vt4 vt5
vt1 0 0 0 0
vt2 0.2 0 0.5 0
vt3 0.8 0.7 0 0
vt4 0 0.9 0 0
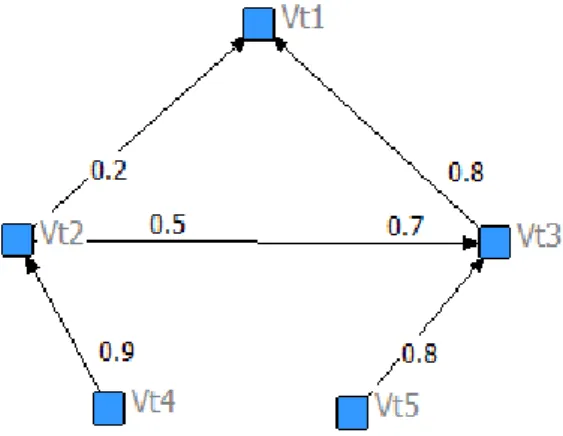
Import the data from Table2into Ucinet and draw the sub-network for design tasks of productA as shown in Figure7.
.
Figure 7.The sub-network for design tasks of productA.
3.3. Sub-Network for Design Resources of Complex Mechanical Products
vrh andvro denote human resources and other resources in the design processes of complex mechanical products, respectively. The set of human resources and other resources can be defined as Vrh =
vt1, ...,vti, ...,vth, ...,vtp,i,h=1, 2, 3, ...,p andVro = vtj, ...,vto, ...vtq,j,o=p+1,p+2, ...,q , so the set of design resources can be defined asVr ={Vrh,Vro}.erihdenotes the cooperative relationship between human resourcesiandh.erhodenotes the matching relationship between human resources hand other resources o, so the set of edges between human resources and other resources can be defined asErh = {eih,i,h=1, 2, 3, ...,p}and Ero = ejo,j,o= p+1,p+2, ...,q ; therefore, the set of edges between design resources can be defined asEr = {Erh,Ero}. wrih denotes the strength of the cooperative relationship between human resourcesi and h. wrho denotes the strength of the matching relationship between human resourceshand other resourceso, so the set of edge weights between human resources and other resources can be defined asWrh ={wih,i,h=1, 2, 3, ...,p}and Wro=wjo,j,o=p+1,p+2, ...,q ; therefore, the set of edge weights between design resources can be defined asWr={Wrh,Wro}. The sub-network for design resources of complex mechanical products can be defined as:
Gr = (Vr,Er,Wr). (3)
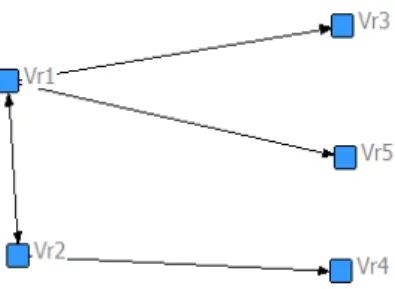
Likewise, the sub-network for the design resources of complex mechanical products can be drawn by Ucinet software. For example, the set of resources isVr = {vr1, vr2,vr3,vr4,vr5}. Among them, vr1andvr2denote human resources.vr3,vr4, andvr5denote other resources.vr1cooperates withvr2. vr1matches withvr3,vr5.vr2matches withvr4. The strength of the relationships between resources is shown in Table3.
Table 3.The strength of the relationships between resources.
vr1 vr2 vr3 vr4 vr5
vr1 0.9 0.8 0 0.9
vr2 0.9 0 0.9 0
s s
s
Figure 8.The sub-network for design resources of productA.
3.4. Supernetwork-Based Model for the Design Processes of Complex Mechanical Products
In the design processes of products, the design of parts requires the execution of relevant design tasks. The execution of design tasks requires the distribution of relevant design resources. There are bidirectional corresponding relationships between design structure and tasks. Also, bidirectional corresponding relationships exist between design tasks and resources.
Estdenotes the set of edges between CPSNGsand CPTNGt.Etrdenotes the set of edges between CPTNGtand CPRNGt.Wst,Wtrdenote the strength ofEst,Etr, respectively. So a supernetwork-based model for design processes of complex mechanical productsGs−t−rcan be defined as:
Gs−t−r= (Gs,Gt,Gr,Est,Etr,Wst,Wtr). (4)
The sketch of supernetworkGs−t−r is shown in Figure9.
v
s1the sub-network for design structure of complex product
the sub-network for design tasks of complex product
the sub-network for design resources of complex product
v
s3v
s2v
s5v
s4v
t1v
t2v
t3v
t4v
t5v
r1v
r2v
r3v
r4v
r5parts
tasks
resources
legend
containment relationship
sequential dependence
associational relationsh
cross coupling
cooperative or matching relationship
relationship between sub-networks
The supernetwork for the design process of productAcan also be drawn by Ucinet. The strength of the relationships between design structure, tasks, and resources in shown in Tables4and5.
Table 4.The strength of the relationships between design structures and tasks.
vs1 vs2 vs3 vs4 vs5
vt1 1 0 0 0 0
vt2 0 1 0 0 0
vt3 0 0 1 0 0.9
vt4 0 0 0 0 0.8
vt5 0 0 0.9 0.8 0
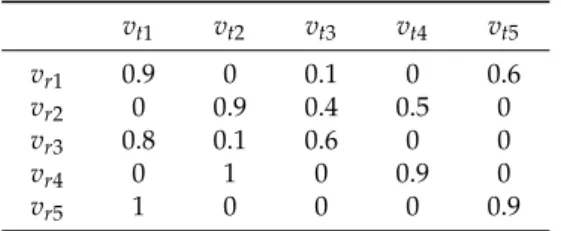
Table 5.The strength of the relationships between design tasks and resources.
vt1 vt2 vt3 vt4 vt5
vr1 0.9 0 0.1 0 0.6
vr2 0 0.9 0.4 0.5 0
vr3 0.8 0.1 0.6 0 0
vr4 0 1 0 0.9 0
vr5 1 0 0 0 0.9
Import the data from Tables1–5into Ucinet and draw the supernetwork model for the design process of productAas shown in Figure10.
Figure 10.Supernetwork-based model for the design process of productA.
3.5. Compute Edge Weights in Supernetwork-Based Model for Design Processes of Complex Mechanical Products
The set of evaluation experts is defined as E =
ep|p=1, 2, . . . ,P . The set of evaluation experts’ weights is defined asW=
wp|p=1, 2, . . . ,P where 0≤wp≤1 and P
∑
p=1wp=1. The set of relationships between nodes is defined asC =
cq|q=1, 2, . . . ,Q . The set of fuzzy language sets is defined as L = {Lk|k=1, 2, . . . ,K}where Lk denotes the fuzzy language set k. For any two fuzzy language setsLg =
n
l1,l2, ...,lg′ o
andLh ={l1,l2, ...,lh′}, wherelg′andlh′ are linguistic
variables,g′andh′denote the number oflg′andlh′, respectively, andg′ ≤h′.µlℓ(y),µlt(y)denote
the membership function betweenlℓandlt.ΓLgLh denotes the function of convertingLgintoLhwhich
is defined as:
ΓL
gLh(lℓ) = n
lt,δ ℓ t
t∈
1, 2, ...,h′ o, lℓ∈Lg (5)
δℓt =maxy min
µlℓ(y),µlt(y) . (6)
Using Equations (5) and (6), the fuzzy setlt,δtℓ
is derived. It describes the membershipδℓt betweenltandlℓbelonging to the set of linguistic variablesLhandLg, respectively. According to the valueδℓt, the linguistic variables in setLhare equal to the linguistic variables in setlℓ, which is the
largest membership of linguistic variables setlt. Through this process, the linguistic variables in setLg are converted into the linguistic variables in setLh.
After unifying the different fuzzy language sets of expert evaluation, we need to further quantify the fuzzy language to determine the strength of the relationships between elements. If⌢vp,ij,qis defined as the evaluation of relationshipqbetween elementiandjevaluated by expertep, its triangle fuzzy value is defined as:
⌢ vp,ij,q=
vlp,ij,q,vmp,ij,q,vup,ij,q, (7) wherevl
p,ij,q,vmp,ij,qandvup,ij,qdenote the minimum, median, and maximum, respectively. So the triangle fuzzy value⌢vij,qdenoting the relationshipqbetween nodeiandjtakes form (8):
⌢ vij,q=
vlij,q,vmij,q,vuij,q= P
∑
p=1 wp
⌢
vp,ij,q. (8)
According to the CFCS method presented by Opricovis [62], the fuzzy evaluation information can be converted into a clear value using Equation (9):
wij,q=l+ δ vm
ij,q−l δ+viju,q−vmij,q
2
u−vm ij,q
+vuij,q−l δ+vmij,q−vmij,q2
δ+vmij,q−vlij,q δ+vuij,q−vijm,q2u−vlij,q +vuij,q−l δ+vmij,q−vijl,q2δ+viju,q−vmij,q
, (9)
wherel=minnvlij,qo,u=maxnviju,qo,δ=u−l, so:
wij = Q
∑
q=1
wij,q. (10)
According to Equations (5)–(10), the edge weights denoting the strength of the relationships between nodes inGs−t−rare obtained.
weight is contrary to similarity weight in that the greater its value is, the less close the corresponding nodes are. In this paper, the similarity weight is uniformly applied.
4. Case Study
4.1. Example of the Model Application
Changes are the rule and the design processes of complex mechanical products are no exception [63]. The assessment of impacts on change help designers know which elements are important and should be assigned additional resources to respond to likely changes. For this purpose, we combine the indices of degree-changeability and reach-changeability in [64] to assess the importance of parts, tasks, and resources, where degree-changeability is used to assess the direct impacts caused by the source change, and reach-changeability is used to assess the indirect impacts. They take the form:
C(ODi) =1−
ODi
wmax·(n−1). (11)
ODidenotes the sum of edge weights started fromiand takes the form:
ODi =
∑
j=Niwij, (12)
wherewmaxdenotes the maximum of weightwij.
C(ORi) =1−ORn−1i ORi = ∑
j∈N,j6=i
max
pij
pij=
(
wij/wmax, i connect with j directly piu·puj, i connect with j indirectly
, (13)
whereuis the penultimate node in the path from nodeiandj. The smallerC(ODi)is, the closer the relationship between nodeiand its connecting nodes. In this situation, the change of nodeiwill cause big changes in the directly connecting nodes, so designers should emphasize the nodes of small C(ODi). In a similar way, the smallerC(ORi)is, the easier nodeipropagates. Designers should also emphasize the node of smallC(ORi).
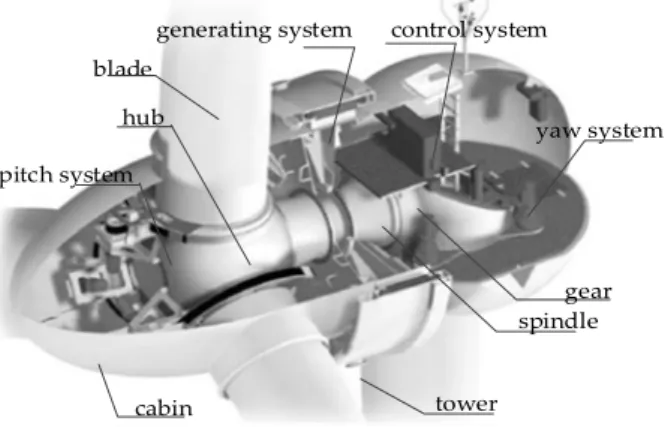
A wind-driven generator of type A is used to illustrate the application of the supernetwork-based model for the design processes of complex mechanical products. It has 10 core assembly parts (as is shown in Figure11), about 30,000 parts, and about 20 years of service life [65].
)=
-
)=
-blade hub pitch system
generating system control system
yaw system
spindle
tower cabin
gear
(1) Analyze nodes and edges
As the first step in the design of a wind driven generator, we obtain the core assemblies (as is shown in Figure11) and analyze the types of relationships between them. Because they are at the same level of assembly, there is no containment relationship between them. However, there are associational relationships between them, derived from the views of 10 experienced designers and three experts and from the relative researches [66–69]. The results are shown in TableA1of AppendixA. For example, the blade is mainly related to the yaw system by gravity, lateral force, and torque.
If there are design information flows between two tasks, a relationship exists. Then, according to the direction of the design information flows, we can analyze the types of relationships (as in Section2.3). The result is shown in FigureA2of AppendixA. For example, the relationship between the pitch blade and the electric machine is one of cross-coupling; the relationship between PWM programmer and electric machine is parallel independence.
To assess the relationships between design resources, firstly classify the resources into human resources and other resources. Secondly, assess the cooperation between humans and software in past design processes (as is analyzed in Section2.4. Specifically, the design resources of company H are six designers, eight computers, two electromagnetic heaters, 50 auxiliary equipment, six two-ton electric fork-lift trucks, and one each of 100-ton bridge crane, 60-ton bridge crane, and 32-ton bridge crane. Due to the limited length of this article, the relationships between designers and software are primarily analyzed. By interviewing designers of wind-driven generators, six designers can use eight computers with different proficiencies. So there are matching relationships between designers and computers. Proficiency is evaluated by the ratio of actual working time to rated working time (obtained by assessors).
(2) Analyze the edge weight
In this procedure, the strength of the relationship is assessed by the assessment team, which is composed of six designers of a wind-driven generator of type A, four designers of a wind-driven generator of type B or C, and three experts working at Chongqing university. The 10 designers have been working for the company for over five years.
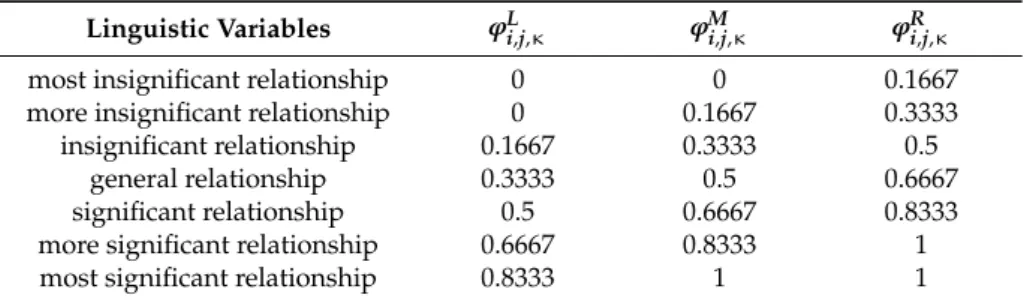
The seven linguistic variables [65] and the corresponding triangular fuzzy numbers are shown in Table 6. They are frequent expressions of natural language [70] and have been used in many studies [71–73]. The “very small relationship” means that a big change in the design specification of parts in the column impacts the part in the row (low sensitivity) [74]. Likewise, a “smaller relationship” means a medium or low sensitivity to change.
Because different assessors have different background knowledge, the evaluations of the same objects often have a different degree of blurring. The five linguistic variables [75] are shown in Table7. Then we computed the edge weights of the supernetwork model for the design process of a wind-driven generator using Equations (5)–(10). After the calculation of weights, we made the post-interview immediately to validate the weights. The result is shown in Table8.
Table 6.The seven linguistic variables and the corresponding triangular fuzzy numbers.
Linguistic Variables ϕLi,j,κ ϕ
M
i,j,κ ϕ R i,j,κ
most insignificant relationship 0 0 0.1667
more insignificant relationship 0 0.1667 0.3333 insignificant relationship 0.1667 0.3333 0.5
general relationship 0.3333 0.5 0.6667
significant relationship 0.5 0.6667 0.8333
more significant relationship 0.6667 0.8333 1
Table 7.The five linguistic variables and the corresponding triangular fuzzy numbers.
Linguistic Variables ϕLi,j,κ ϕ
M
i,j,κ ϕ R i,j,κ
insignificant relationship 0 0 0.25
insignificant relationship 0 0.25 0.5
general relationship 0.25 0.5 0.75
significant relationship 0.5 0.75 1
more significant relationship 0.75 1 1
Table 8.The edge weight’s matrix of sub-network for design structure.
Blade Yaw
System Pitch
System Cabin Spindle Gear
Control System
Generating
System Hub Tower
1 2 3 4 5 6 7 8 9 10
1 0.36 0.22 0.58 0.14 0.29 0.31 0.46 0.72 0.19 2 0.31 0.41 0.07 0.17 0.31 0.22 0.48 0.29 0.1 3 0.46 0.5 0.12 0.53 0.19 0.29 0.26 0.34 0.12 4 0.36 0.29 0.15 0.21 0.5 0.07 0.46 0.38 0.43 5 0.46 0.58 0.31 0.19 0.17 0.17 0.26 0.38 0.38 6 0.36 0.26 0.34 0.7 0.36 0.43 0.17 0.22 0.26 7 0.34 0.24 0.22 0.46 0.26 0.36 0.07 0.17 0.12 8 0.6 0.43 0.26 0.34 0.19 0.26 0.07 0.72 0.58 9 0.67 0.04 0.06 0.19 0.31 0.26 0.22 0.09 0.07 10 0.03 0.22 0.14 0.07 0.14 0.19 0.22 0.11 0.34
In Table8, the strength of the associational relationship between the blade and yaw systems is 0.36, which indicates a significant relationship. That is, a large change in the design specification of the blade can impact on the yaw system.
Due to the limited length of this article, we take the pitch system as an example to analyze design tasks and relationships. Also, we take designers and software as an example to analyze the strength of the relationships between them. The results are shown in TablesA2andA3of AppendixA.
We imported Table8and TableA1of AppendixAinto Ucinet and drew the sub-network of
the design structure, tasks, and resources of a wind-driven generator as shown in FiguresA1–A3of AppendixA.
In addition, the strength of the relationships between design tasks and resources was also assessed by 16 designers, as shown in TableA4of AppendixA.
(3) Analyze the degree-changeability
Based on the edge weights of the supernetwork for the design process of a wind-driven generator and Equations (9) and (10), the node weights are computed. Then the degree-changeability and reach-changeability are calculated using Equations (11) and (13). The results are shown in Tables9 and10, and TableA4of AppendixA.
Table 9.The degree-changeability of the parts of a wind-driven generator.
No. Parts ODi C(ODi) No. Parts ODi C(ODi)
1 blade 3.73 0.57 6 gear 3.1 0.59
2 yaw system 2.36 0.69 7 control system 2.24 0.70
3 pitch system 2.81 0.63 8 generating system 3.45 0.54
4 cabin 2.85 0.62 9 hub 1.91 0.75
Table 10.The reach-changeability of the parts of a wind-driven generator.
No. Parts ORi C(ORi) No. Parts ORi C(ORi)
1 blade 4.75 0.91 6 gear 4.13 0.92
2 yaw system 5.47 0.90 7 control system 3.86 0.93
3 pitch system 4.27 0.92 8 generating system 5.79 0.89
4 cabin 4.72 0.91 9 hub 4.17 0.92
5 spindle 3.04 0.94 10 tower 3.93 0.93
According to Tables9and10, the degree-changeability and reach-changeability of the generating system are the smallest. Its change will cause great change to the design of a wind-driven generator. Therefore, designers should give the generating system additional resources to allow it to respond quickly. In addition, the assessment of change impacts on design tasks and resources are the same as for the design structure.
4.2. Comparison Analysis
To verify the accuracy of the proposed model’s performance, we compared the analysis results calculated by the proposed model with an existing one [64]; the results calculated by the latter are shown in Table11.
From Table11we can see that the degree-changeability and reach-changeability of the blade are the smallest. Its change will cause great change to the design of a wind-driven generator. However, by interviewing 10 designers who have been working in the company for over five years, we verified that the impact of the generating system is bigger than that of the blade (as calculated by the proposed model). Also, the 10 designers also approved the calculation results in Tables 10and 11, so the performance of the proposed model is accurate.
Table 11.The degree-changeability and reach-changeability calculated by the literature [64].
No. Parts C(ODi) C(ORi)
1 blade 0.47 0.72
2 yaw system 0.54 0.79
3 pitch system 0.48 0.73
4 cabin 0.53 0.76
5 spindle 0.50 0.75
6 gear 0.56 0.84
7 control system 0.54 0.81
8 generating system 0.51 0.75
9 hub 0.49 0.74
10 tower 0.48 0.73
From Sections4.1and4.2, we know that the supernetwork model for design processes of complex mechanical products can assess change impact and evaluate the importance of design elements. In addition, the supernetwork model can also test and dispel design conflicts using the load and capacity of network parameters.
5. Conclusions
as nodes and the relationships between them as edges. The edge weight designates the strength of the relationship.
Using the proposed model, managers or designers can manage design processes better. For example, they can analyze change impacts and the importance of design elements more accurately, and know which parts should be assigned additional resources to respond to likely changes.
Clearly, more work remains to be done. For example, it should be further considered how to cut down the man-made factors in the quantification of weights and how to integrate other studies on supernetworks to better manage the design processes of complex mechanical products. In addition, the development of software tools to solve the complexity of computation should be further considered, as well as simple and effective expert evaluating methods.
Acknowledgments:This study was supported by the National Natural Science Foundation of China under Grant No. 71571023.
Author Contributions:Yu-Jie Zheng and Yu Yang built the supernetwork-based modeling method together. Yu-Jie Zheng wrote the paper. Na Zhang and Yao Jiao provided support in performing the data analysis. All authors have read and approved the final manuscript.
Appendix A
Table A1.Relationships between parts of a wind-driven generator.
Blade Yaw System Pitch
System Cabin Spindle Gear
Control System
Generating
System Hub Tower
blade gravity, lateralforce, torque velocityrelative load load torque torque rotationalinertia torque air load,radius
yaw system rotation angle torque lateral forces fit, axialforce load torque yaw angle torque torque
pitch system blade azimuth load load torque torque load load load gravity
cabin gravity, load horizontal andgravity, vertical distance
yaw angle axial thrust load load coefficient,area height
area coefficient,
height
gravity, resistance
spindle load fit, axial force torque axial thrust torque, fit friction impulse load axial force,fit bendingmoment
gear torque, driveratio load torque load torque, fit torque,load torque, driveratio load gravity
control
system torque torque load load friction torque, load load load gravity generating
system angular speed extreme angle load, power gravity, type impulse load
angular
speed load
power, pitch
angle gravity
hub radius torque load diameter bendingtorque, moment
load weightload, load load
Table A2.The edge weight matrix of the pitch system’s design tasks.
Pitch Blade
Electric Machine
Gear Box
Main Circuit
DSP Digit Circuit
Detection Circuit
Sequential Communication
Circuits
Battery Monitoring
Circuit
PWM Programmer
Sequential Communication
Programmer
Current Loop and Speed Loop Control Program
1 2 3 4 5 6 7 8 9 10 11 12
1 0.89 0.89 0.05 0.03 0.02 0.04 0.06 0.10 0.01 0.02 0.04
2 0.20 0.90 0.01 0.01 0.02 0.02 0.01 0.01 0 0 0.01
3 0.88 0.92 0.01 0.03 0.01 0.01 0.05 0.01 0.05 0.01 0.02
4 0.03 0 0.03 0.75 0.86 0.84 0.01 0.01 0.02 0.03 0.01
5 0.01 0.02 0.01 0.01 0.78 0.64 0.02 0.03 0.01 0.02 0.01
6 0.02 0.01 0.03 0.02 0.65 0.45 0.01 0.02 0.02 0.01 0.03
7 0.01 0.03 0.02 0.02 0.59 0.83 0.05 0.03 0.01 0.02 0.01
8 0 0.01 0.03 0.01 0.01 0.03 0.02 0.76 0.02 0.01 0.02
9 0.04 0.02 0.01 0.02 0.04 0.01 0.02 0.55 0.01 0.02 0.01
10 0.02 0 0.01 0.01 0.01 0.03 0.02 0.02 0.01 0.66 0.73
11 0.03 0.01 0.02 0.02 0.01 0.02 0.02 0.01 0.02 0.74 0.68
12 0.02 0.01 0.02 0.01 0.01 0.05 0.01 0.01 0.03 0.87 0.79
Table A3.The matrix of edge between designers and software.
7 8 9 10 11 12 13 14
1 0.82 0.91 0.13 0.63 0.10 0.28 0.55 0.96 2 0.97 0.16 0.97 0.96 0.49 0.80 0.14 0.42 3 0.92 0.80 0.96 0.66 0.04 0.85 0.93 0.69 4 0.76 0.74 0.39 0.65 0.27 0.03 0.87 0.64 5 0.03 0.82 0.70 0.32 0.95 0.43 0.38 0.77 6 0.80 0.19 0.49 0.65 0.71 0.75 0.28 0.24
Table A4.The matrix of edges between design structure and tasks of pitch system.
Pitch Blade Electric Machine Gear Box Main Circuit DSP Digit Circuit Detection Circuit
Pitch system 0.88 0.90 0.93 0.76 0.72 0.59
sequential dependence
interface circuits battery monitoring circuit PWM programmer
sequential dependence communication programmer
current loop and speed loop control program
pitch system 0.56 0.69 0.52 0.49 0.46 0.55
Table A5.The relationship between design tasks and design resources.
Pitch Blade
Electric Machine
Gear Box
Main Circuit
DSP Digit Circuit
Detection Circuit
Sequential Dependence
Interface Circuits
Battery MonitoringCircuit ProgrammerPWM
Sequential Dependence Communication
Programmer
Current Loop and Speed Loop Control Program
1 0.79 0.90 0.79 0.79
2 0.90 0.82 0.64 0.84
3 1.00 0.63 1.00
4 0.78 0.78 0.81 0.59
5 0.60 0.60
6 0.65 0.93 0.60
7 0.65 0.96 0.73 0.78 0.94 0.71 0.65 0.96
8 0.69 0.87 0.65 0.69
9 0.75 0.77 0.58 0.92 0.75 0.77
10 0.82 0.55 0.90 0.94 0.55 0.62 0.82
11 0.87 0.94 0.96 0.59 0.87
12 0.85 0.74 0.90
13 0.91 0.62 0.98 0.91
Table A6.The reachability matrix of a wind-driven generator’s parts.
Blade Yaw System Pitch System Cabin Spindle Gear Control System Generating System Hub Tower
blade 0.45 0.11 0.43 0.85 0.42 0.78 0.23 0.55 0.93
yaw system 0.79 0.96 1.00 0.62 0.05 0.39 0.35 0.30 1.00
pitch system 0.31 0.23 0.18 0.35 0.90 0.24 0.82 0.74 0.49
cabin 0.53 0.91 0.77 0.51 0.94 0.40 0.02 0.19 0.44
spindle 0.17 0.15 0.82 0.15 0.49 0.10 0.04 0.69 0.45
gear 0.60 0.83 0.87 0.14 0.08 0.13 1.00 0.18 0.31
control system 0.26 0.54 0.08 0.87 0.24 0.34 0.65 0.37 0.51
generating system 0.65 1.00 0.40 0.58 0.12 0.90 1.00 0.63 0.51
hub 0.69 0.08 0.26 0.55 0.18 0.37 0.58 0.65 0.82
tower 0.75 0.44 0.80 1.00 0.24 0.11 0.06 0.45 0.08
Figure A2.The sub-network for design tasks of a wind-driven generator.
Figure A3.The sub-network for design resources of a wind-driven generator.
References
1. Holdren, J.P.; Power, T.; Tassey, G.; Ratcliff, A.; Christodoulou, L.A National Strategic Plan for Advanced Manufacturing; US National Science and Technology Council: Washington, DC, USA, 2012.
2. Wahlster, W.SemProM; Springer: Berlin/Heidelberg, Germany, 2013.
3. Deng, Q.; Liu, X.; Liao, H. Identifying Critical Factors in the Eco-Efficiency of Remanufacturing Based on the Fuzzy DEMATEL Method.Sustainability2015,7, 15527–15547. [CrossRef]
4. Fernandes, J.; Henriques, E.; Silva, A.; Moss, M.A. A method for imprecision management in complex product development.Res. Eng. Des.2014,25, 309–324. [CrossRef]
5. Rosen, M.A.; Kishawy, H.A. Sustainable manufacturing and design: Concepts, practices and needs.
Sustainability2012,4, 154–174. [CrossRef]
6. Gokpinar, B.; Hopp, W.J.; Iravani, S.M. The impact of misalignment of organizational structure and product architecture on quality in complex product development.Manag. Sci.2010,56, 468–484. [CrossRef] 7. Gokpinar, B.; Hopp, W.; Iravani, S.M. The impact of product architecture and organization structure on
efficiency and quality of complex product development. Unpublished work, 2007.
8. Browning, T.R.; Ramasesh, R.V. A Survey of Activity Network-Based Process Models for Managing Product Development Projects.Prod. Oper. Manag.2007,16, 217–240. [CrossRef]
9. Zhou, J.; Xiao, F.; Tang, H.; Tang, W. Research on process model and framework of collaborative design for complex product based on meta-synthesis.J. Graph.2013,34, 72–78.
10. Zhou, J.Key Problems of Complex Product Collaborative Design Based on Meta-Synthesis; Nanjing University of Science and Technology: Nanjing, China, 2012.
11. Van Der Aalst, W.M.; Ter Hofstede, A.H. Verification of workflow task structures: A petri-net-baset approach.
Inf. Syst.2000,25, 43–69. [CrossRef]
12. Jia, L.; Tan, R.; Zhang, H.; Liu, W. Product modeling and timing improvement method based on petri nets.
Comput. Integr. Manuf. Syst.2016,22, 630–638.
13. Cao, Y.Y.; Qin, X.S.; Wang, W. General Petri net model of product development ProA.Comput. Integr. Manuf. Syst.2009,15, 2328–2334.
14. Liu, H.Q.; Qi, G.N.; Zhang, T.H.; Ji, Y.J. Research on multi-disciplinary process modeling of conceptual design for complex product.J. Zhejiang Univ. Eng. Sci.2009,43, 517–522.
15. Hu, Z.Y.; Yi, G.D.; Zhang, S.Y. Hierarchical evolutionary approach for design structure matrix oriented to complex electromechanical system modeling.Comput. Integr. Manuf. Syst.2013,10, 2385–2393.
16. Song, X.; Wang, L.; Liu, J.Q. Planning methods for complex product design based on QFD and DSM.
Mach. Des. Manuf.2012,1, 242–234.
17. Sun, Y.; Zhang, X.; Ning, R.; Wang, T. Research on development process of complex product based on multi-level design structure matrix.J. Mech. Eng.2011,47, 166–175. [CrossRef]
18. Zhu, D.; Guo, W.; Ma, R. Automation of modeling and integrated design optimization of complex product.
J. Tianjin Univ.2010,43, 452–466.
19. Browning, T.R. Applying the design structure matrix to system decomposition and integration problems: A review and new directions.IEEE Trans. Eng. Manag.2001,48, 292–306. [CrossRef]
20. Browning, T.R. Process integration using the design structure matrix.Syst. Eng.2002,5, 180–193. [CrossRef] 21. Chen, L.; Ding, Z.; Li, S. A formal two-phase method for decomposition of complex design problems.
J. Mech. Des.2005,127, 184–195. [CrossRef]
22. Chen, L.; Macwan, A.; Li, S. Model-based rapid redesign using decomposition patterns.J. Mech. Des.2007,
129, 283–294. [CrossRef]
23. Bartolomei, J.E.; Hastings, D.E.; de Neufville, R.; Rhodes, D.H. Engineering Systems Multiple-Domain Matrix: An organizing framework for modeling large-scale complex systems. Syst. Eng. 2012,15, 41–61. [CrossRef]
24. Carley, K.M.; Reminga, J.Ora: Organization Risk Analyzer; Center for Computational Analysis of Social and Organizational Systems: Pittsburgh, PA, USA, 2004.
25. Wang, Z.; Wang, Z. Elementary study of supernetworks.Chin. J. Manag.2008,5, 1–8. [CrossRef] [PubMed] 26. Zhong-tuo, W.A. Reflection on supernetwork.J. Univ. Shanghai Sci. Technol.2011,33, 229–237.
28. Nagurney, A.; Dong, J.Supernetworks: Decision-Making for the Information Age; Edward Elgar Publishing Incorporated: Cheltenham, UK, 2002.
29. Yamada, T.; Imai, K.; Nakamura, T.; Taniguchi, E. A supply chain-transport supernetwork equilibrium model with the behaviour of freight carriers.Trans. Res. Part E Logist. Trans. Rev.2011,47, 887–907. [CrossRef] 30. Nagurney, A.Supernetworks: An Introduction to the Concept and Its Applications with a Specific Focus on Knowledge
Supernetworks; University of Massachusetts Amherst: Amherst, MA, USA, 2005.
31. Cruz, J.M.; Nagurney, A.; Wakolbinger, T. Financial engineering of the integration of global supply chain networks and social networks with risk management.Nav. Res. Logist.2006,53, 674–696. [CrossRef] 32. Wakolbinger, T.; Nagurney, A. Dynamic supernetworks for the integration of social networks and supply
chains with electronic commerce: Modeling and analysis of buyer–seller relationships with computations.
Netnomics2004,6, 153–185. [CrossRef]
33. Hu, C.L.; Rong, Z.J.; Chen, K.S.; Dan, B.B. Research on process model of product design based on path searching.Comput. Integr. Manuf. Syst.2013,19, 293–299.
34. Ma, M.; Wang, C.; Zhang, J.; Huang, Z. Multidisciplinary design optimization for complex product review.
Chin. J. Mech. Eng.2008,44, 15–26. [CrossRef]
35. An, Y.; Li, R. Modeling & analysis of collaborative design based on process control Petri nets.Comput. Integr. Manuf. Syst.2006,12, 1352–1358.
36. Wang, Y.; Duan, G.J. Complex product design process model based on generalized characters evolution.
Comput. Integr. Manuf. Syst.2011,12, 2562–2572.
37. Otto, K.N.; Wood, K.L.Product Design; Tsinghua University Press: Beijing, China, 2001. (In Chinese) 38. Deng, J.Z. Essential design theory and technology for product development. China Mech. Eng.2000,11,
139–143.
39. Kong, J.; Zhang, Y.; Wang, H.; Chen, S. Study on integration of distributed PM and workflow in collaborative product development environment.China Mech. Eng.2003,14, 1122–1125.
40. Cao, J.; Zhang, S.; Hu, J. Research on concurrent engineering oriented integrated product development process management system.China Mech. Eng.2002,13, 80–83.
41. Chen, S.; Lin, Li. Decomposition of interdependent task group for concurrent engineering.Comput. Ind. Eng. 2003,44, 435–459. [CrossRef]
42. Stone, P.; Veloso, M. Task decomposition, dynamic role assignment, and low-bandwidth communication for real-time strategic teamwork.Artif. Intell.1999,110, 241–273. [CrossRef]
43. Orsv, Ä.K. Some principles for libraries of task decomposition methods.Int. J. Hum. Comput. Stud.1998,49, 417–435. [CrossRef]
44. Bian, Y.; Guo, K. The identification of system key elements.J. Syst. Sci.2013,21, 22–27.
45. Yang, F.; Tang, X. Propagation of engineering change based on characteristic linkage perspective.J. Beijing Univ. Aeronaut. Astronaut.2012,38, 1–8.
46. Yang, F.; Tang, X.; Duan, G. Searching model of change propagation paths for mechanical product based on characteristic linkage network.J. Mech. Eng.2011,47, 97–106. [CrossRef]
47. Pang, H.; Fang, Z. Task decomposition strategy and granularity design in networked collaborative environment.
Comput. Integr. Manuf. Syst.2008,3, 425–430.
48. Bao, B.; Yang, Y.; Li, F.; Xue, C. Decomposition model in product customization collaborative development task.Comput. Integr. Manuf. Syst.2014,20, 1537–1545.
49. Sim, S.K.; Duffy, A.H.B. Towards an ontology of generic engineering design activities.Res. Eng. Des.2003,
14, 200–223. [CrossRef]
50. McMahon, C. Design informatics: Supporting engineering design processes with information technology.
J. Indian Inst. Sci.2016,95, 365–378.
51. Chen, G.Optimize the Product Development Process based on Design Structure Matrix; Huazhong University of Science and Technology: Wuhan, China, 2009.
52. Meng, X. Key Technology for Product Collaborative Design of Machine Tool Supporting Environment; Dongnan University: Nanjing, China, 2005.
53. Feng, Z.Study on Modeling, Simulation and Optimization of the Product Designing Process; Dalin University of Technology: Dalian, China, 2008.
55. Zhangyin, G.Research on Model Control and Management for Computer Supporting Collaborative Design Process of Mechanical Products; Taiyuan University of Science and Technology: Taiyuan, China, 2011.
56. Schwartz, D.R. Database support for conflict detection in a computer-supported cooperative work environment. In Proceedings of the International Database Engineering and Applications Symposium, Montreal, QC, Candada, 25–27 August 1997; pp. 240–249.
57. Egyed, A.; Grunbacher, P. Identifying requirements conflicts and cooperation: How quality attributes and automated traceability can help.IEEE Softw.2004,21, 50–58. [CrossRef]
58. Fu, G. A fuzzy optimization method for multicriteria decision making: An application to reservoir flood control operation.Expert Syst. Appl.2008,34, 145–149. [CrossRef]
59. Herrera, F.; Herrera-Viedma, E. Choice functions and mechanisms for linguistic preference relations.Eur. J. Oper. Res.2000,120, 144–161. [CrossRef]
60. Kao, C.; Lin, P.H. Qualitative factors in data envelopment analysis: A fuzzy number approach. Eur. J. Oper. Res.2011,211, 586–593. [CrossRef]
61. Herrera, F.; Herrera-Viedma, E.; Martínez, L. A fusion approach for managing multi-granularity linguistic term sets in decision making.Fuzzy Sets Syst.2000,114, 43–58. [CrossRef]
62. Opricovic, S.; Tzeng, G.H. Defuzzification within a multicriteria decision model.Int. J. Uncertain. Fuzziness Knowl. Based Syst.2003,11, 635–652. [CrossRef]
63. Osborne, S.M. Product Development Cycle Time Characterization through Modeling of Process Iteration; Massachusetts Institute of Technology: Cambridge, MA, USA, 1993.
64. Cheng, H.; Chu, X. A network-based assessment approach for change impacts on complex product.
J. Intell. Manuf.2012,23, 1419–1431. [CrossRef]
65. Yu, G.Change Response and Key Technologies for Customer Requirements in Customized Complex Product Design; Chongqing University: Chongqing, China, 2015.
66. Zhao, D.E.Load Simulation in Offshore Wind Turbine System and Design Optimization of Hub; Harbin Institute of Technology: Harbin, China, 2010.
67. Han, D.Structural Analysis and Study on Wind Turbine Main Shaft; Chongqing University: Chongqing, China, 2009. 68. Xu, Z.The Study on Yaw Control System of Wind Turbin; Dalian University of Tehchnology: Dalian, China, 2010. 69. Shen, X.Wind Turbine Global Design Technology and Design Software Development; Shantou University: Shantou,
China, 2005.
70. Novák, V. A comprehensive theory of trichotomous evaluative linguistic expressions.Fuzzy Sets Syst.2008,
159, 2939–2969. [CrossRef]
71. Lee, Y.S.; Cheng, M.W. Intelligent control battery equalization for series connected lithium-ion battery strings.
IEEE Trans. Ind. Electron.2005,52, 1297–1307. [CrossRef]
72. Berenji, H.R.Fuzzy Logic Controllers/An Introduction to Fuzzy Logic Applications in Intelligent Systems; Springer: New York, NY, USA, 1992; pp. 69–96.
73. Logambigai, R.; Kannan, A. Fuzzy logic based unequal clustering for wireless sensor networks.Wirel. Netw. 2016,22, 945–957. [CrossRef]
74. Martin, M.V.; Ishii, K. Design for variety: Developing standardized and modularized product platform architectures.
Res. Eng. Des.2002,13, 213–235.
75. Zhang, X.Process Modeling of Customer Collaborative Product Innovation and Its Key Technologies; Chongqing University: Chongqing, China, 2015.