QuEst - A translation quality estimation framework
Lucia Specia§, Kashif Shah§, Jose G. C. de Souza† and Trevor Cohn§
§Department of Computer Science University of Sheffield, UK
{l.specia,kashif.shah,t.cohn}@sheffield.ac.uk
†Fondazione Bruno Kessler University of Trento, Italy
Abstract
We describe QUEST, an open source framework for machine translation quality estimation. The framework allows the ex-traction of several quality indicators from source segments, their translations, exter-nal resources (corpora, language models, topic models, etc.), as well as language tools (parsers, part-of-speech tags, etc.). It also provides machine learning algorithms to build quality estimation models. We benchmark the framework on a number of datasets and discuss the efficacy of fea-tures and algorithms.
1 Introduction
As Machine Translation (MT) systems become widely adopted both for gisting purposes and to produce professional quality translations, auto-matic methods are needed for predicting the qual-ity of a translated segment. This is referred to as Quality Estimation (QE). Different from standard MT evaluation metrics, QE metrics do not have access to reference (human) translations; they are aimed at MT systems in use. QE has a number of applications, including:
• Deciding which segments need revision by a translator (quality assurance);
• Deciding whether a reader gets a reliable gist of the text;
• Estimating how much effort it will be needed to post-edit a segment;
• Selecting among alternative translations pro-duced by different MT systems;
• Deciding whether the translation can be used for self-training of MT systems.
Work in QE for MT started in the early 2000’s, inspired by the confidence scores used in Speech Recognition: mostly the estimation of word pos-terior probabilities. Back then it was called
confi-dence estimation, which we believe is a narrower term. A 6-week workshop on the topic at John Hopkins University in 2003 (Blatz et al., 2004) had as goal to estimate automatic metrics such as BLEU (Papineni et al., 2002) and WER. These metrics are difficult to interpret, particularly at the sentence-level, and results of their very many trials proved unsuccessful. The overall quality of MT was considerably lower at the time, and therefore pinpointing the very few good quality segments was a hard problem. No software nor datasets were made available after the workshop.
A new surge of interest in the field started re-cently, motivated by the widespread used of MT systems in the translation industry, as a conse-quence of better translation quality, more user-friendly tools, and higher demand for translation. In order to make MT maximally useful in this scenario, a quantification of the quality of trans-lated segments similar to “fuzzy match scores” from translation memory systems is needed. QE work addresses this problem by using more com-plex metrics that go beyond matching the source segment with previously translated data. QE can also be useful for end-users reading translations for gisting, particularly those who cannot read the source language.
QE nowadays focuses on estimating more inter-pretable metrics. “Quality” is defined according to the application: post-editing, gisting, etc. A num-ber of positive results have been reported. Exam-ples include improving post-editing efficiency by filtering out low quality segments which would re-quire more effort or time to correct than translating from scratch (Specia et al., 2009; Specia, 2011), selecting high quality segments to be published as they are, without post-editing (Soricut and Echi-habi, 2010), selecting a translation from either an MT system or a translation memory for post-editing (He et al., 2010), selecting the best trans-lation from multiple MT systems (Specia et al.,
2010), and highlighting sub-segments that need re-vision (Bach et al., 2011).
QE is generally addressed as a supervised ma-chine learning task using a variety of algorithms to induce models from examples of translations de-scribed through a number of features and anno-tated for quality. For an overview of various al-gorithms and features we refer the reader to the WMT12 shared task on QE (Callison-Burch et al., 2012). Most of the research work lies on deciding which aspects of quality are more rel-evant for a given task and designing feature ex-tractors for them. While simple features such as counts of tokens and language model scores can be easily extracted, feature engineering for more ad-vanced and useful information can be quite labour-intensive. Different language pairs or optimisation against specific quality scores (e.g., post-editing time vs translation adequacy) can benefit from very different feature sets.
QUEST, our framework for quality estimation,
provides a wide range of feature extractors from source and translation texts and external resources and tools (Section 2). These go from simple, language-independent features, to advanced, lin-guistically motivated features. They include fea-tures that rely on information from the MT sys-tem that generated the translations, and features that are oblivious to the way translations were produced (Section 2.1). In addition, by inte-grating a well-known machine learning toolkit, scikit-learn,1and algorithms that are known to perform well on this task, QUEST provides a
simple and effective way of experimenting with techniques for feature selection and model build-ing, as well as parameter optimisation through grid search (Section 2.2). In Section 3 we present experiments using the framework with nine QE datasets.
In addition to providing a practical platform for quality estimation, by freeing researchers from feature engineering, QUEST will facilitate work on the learning aspect of the problem. Quality estimation poses several machine learning chal-lenges, such as the fact that it can exploit a large, diverse, but often noisy set of information sources, with a relatively small number of annotated data points, and it relies on human annotations that are often inconsistent due to the subjectivity of the task (quality judgements). Moreover, QE is highly
1http://scikit-learn.org/
non-linear: unlike many other problems in lan-guage processing, considerable improvements can be achieved using non-linear kernel techniques. Also, different applications for the quality predic-tions may benefit from different machine learn-ing techniques, an aspect that has been mostly ne-glected so far. Finally, the framework will also facilitate research on ways of using quality predic-tions in novel extrinsic tasks, such as self-training of statistical machine translation systems, and for estimating quality in other text output applications such as text summarisation.
2 The QUEST framework
QUEST consists of two main modules: a feature extraction module and a machine learning mod-ule. The first module provides a number of feature extractors, including the most commonly used fea-tures in the literature and by systems submitted to the WMT12 shared task on QE (Callison-Burch et al., 2012). More than 15 researchers from 10 in-stitutions contributed to it as part of the QUEST
project.2 It is implemented in Java and provides abstract classes for features, resources and pre-processing steps so that extractors for new features can be easily added.
The basic functioning of the feature extraction module requires raw text files with the source and translation texts, and a few resources (where avail-able) such as the source MT training corpus and language models of source and target. Configura-tion files are used to indicate the resources avail-able and a list of features that should be extracted. The machine learning module provides scripts connecting the feature files with the scikit-learn toolkit. It also uses GPy, a Python toolkit for Gaussian Processes regression, which outperformed algorithms commonly used for the task such as SVM regressors.
2.1 Feature sets
In Figure 1 we show the types of features that can be extracted in QUEST. Although the text unit for which features are extracted can be of any length, most features are more suitable for tences. Therefore, a “segment” here denotes a sen-tence.
From the source segments QUEST can extract features that attempt to quantify the complexity
2
Confidence indicators Complexity
indicators
Fluency indicators Adequacy
indicators
Source text MT system Translation
Figure 1: Families of features in QUEST.
of translating those segments, or how unexpected they are given what is known to the MT system. Examples of features include:
• number of tokens in the source segment;
• language model (LM) probability of source segment using the source side of the parallel corpus used to train the MT system as LM;
• percentage of source 1–3-grams observed in different frequency quartiles of the source side of the MT training corpus;
• average number of translations per source word in the segment as given by IBM 1 model with probabilities thresholded in dif-ferent ways.
From the translated segments QUEST can ex-tract features that attempt to measure thefluency
of such translations. Examples of features include:
• number of tokens in the target segment;
• average number of occurrences of the target word within the target segment;
• LM probability of target segment using a large corpus of the target language to build the LM.
From the comparison between the source and target segments, QUEST can extract adequacy
features, which attempt to measure whether the structure and meaning of the source are pre-served in the translation. Some of these are based on word-alignment information as provided by GIZA++. Features include:
• ratio of number of tokens in source and target segments;
• ratio of brackets and punctuation symbols in source and target segments;
• ratio of percentages of numbers, content- / non-content words in the source & target seg-ments;
• ratio of percentage of nouns/verbs/etc in the
source and target segments;
• proportion of dependency relations between (aligned) constituents in source and target segments;
• difference between the depth of the syntactic trees of the source and target segments;
• difference between the number of PP/NP/VP/ADJP/ADVP/CONJP phrases in the source and target;
• difference between the number of per-son/location/organization entities in source and target sentences;
• proportion of person/location/organization entities in source aligned to the same type of entities in target segment;
• percentage of direct object personal or pos-sessive pronouns incorrectly translated. When available, information from the MT sys-tem used to produce the translations can be very useful, particularly for statistical machine transla-tion (SMT). These features can provide an indi-cation of theconfidenceof the MT system in the translations. They are called “glass-box” features, to distinguish them from MT system-independent, “black-box” features. To extract these features, QUEST assumes the output of Moses-like SMT systems, taking into account word- and phrase-alignment information, a dump of the decoder’s standard output (search graph information), global model score and feature values, n-best lists, etc. For other SMT systems, it can also take an XML file with relevant information. Examples of glass-box features include:
• features and global score of the SMT system;
• number of distinct hypotheses in the n-best list;
• 1–3-gram LM probabilities using translations in the n-best to train the LM;
• average size of the target phrases;
• proportion of pruned search graph nodes;
• proportion of recombined graph nodes. We note that some of these features are language-independent by definition (such as the confidence features), while others can be depen-dent on linguistic resources (such as POS taggers), or very language-specific, such as the incorrect translation of pronouns, which was designed for Arabic-English QE.
tar-get word. These can also be averaged across the whole sentence to provide sentence-level value.
The complete list of features available is given as part of QUEST’s documentation. At the current stage, the number of BB features varies from 80
to123depending on the language pair, while GB
features go from39to48 depending on the SMT
system used (see Section 3).
2.2 Machine learning
QUEST provides a command-line interface mod-ule for thescikit-learnlibrary implemented in Python. This module is completely indepen-dent from the feature extraction code and it uses the extracted feature sets to build QE models. The dependencies are the scikit-learn li-brary and all its dependencies (such as NumPy3 and SciPy4). The module can be configured to run different regression and classification algo-rithms, feature selection methods and grid search for hyper-parameter optimisation.
The pipeline with feature selection and hyper-parameter optimisation can be set using a con-figuration file. Currently, the module has an interface for Support Vector Regression (SVR), Support Vector Classification, and Lasso learn-ing algorithms. They can be used in conjunction with the feature selection algorithms (Randomised Lasso and Randomised decision trees) and the grid search implementation ofscikit-learnto fit an optimal model of a given dataset.
Additionally, QUEST includes Gaussian Pro-cess (GP) regression (Rasmussen and Williams, 2006) using the GPy toolkit.5 GPs are an ad-vanced machine learning framework incorporating Bayesian non-parametrics and kernel machines, and are widely regarded as state of the art for regression. Empirically we found the perfor-mance to be similar to SVR on most datasets, with slightly worse MAE and better RMSE.6 In contrast to SVR, inference in GP regression can be expressed analytically and the model hyper-parameters optimised directly using gradient as-cent, thus avoiding the need for costly grid search. This also makes the method very suitable for fea-ture selection.
3http://www.numpy.org/ 4http://www.scipy.org/
5https://github.com/SheffieldML/GPy 6This follows from the optimisation objective: GPs use a
quadratic loss (the log-likelihood of a Gaussian) compared to SVR which penalises absolute margin violations.
Data Training Test
WMT12 (en-es) 1,832 422
EAMT11 (en-es) 900 64
EAMT11 (fr-en) 2,300 225 EAMT09-s1-s4(en-es) 3,095 906 GALE11-s1-s2(ar-en) 2,198 387
Table 1: Number of sentences used for training and testing in our datasets.
3 Benchmarking
In this section we benchmark QUESTon nine ex-isting datasets using feature selection and learning algorithms known to perform well in the task.
3.1 Datasets
The statistics of the datasets used in the experi-ments are shown in Table 1.7
WMT12 English-Spanish sentence translations produced by an SMT system and judged for post-editing effort in 1-5 (worst-best), taking a weighted average of three annotators.
EAMT11 English-Spanish (EAMT11-en-es) and French-English (EAMT11-fr-en) sentence translations judged for post-editing effort in 1-4.
EAMT09 English sentences translated by four SMT systems into Spanish and scored for post-editing effort in 1-4. Systems are denoted by s1-s4.
GALE11 Arabic sentences translated by two SMT systems into English and scored for ade-quacy in 1-4. Systems are denoted by s1-s2.
3.2 Settings
Amongst the various learning algorithms available in QUEST, to make our results comparable we se-lected SVR with radial basis function (RBF) ker-nel, which has been shown to perform very well in this task (Callison-Burch et al., 2012). The op-timisation of parameters is done with grid search using the following ranges of values:
• penalty parameterC: [1, 10, 10]
• γ: [0.0001, 0.1, 10]
• ǫ: [0.1, 0.2, 10]
where elements in list denote beginning, end and number of samples to generate, respectively.
For feature selection, we have experimented with two techniques: Randomised Lasso and
7The datasets can be downloaded fromhttp://www.
Gaussian Processes. Randomised Lasso (Mein-shausen and B¨uhlmann, 2010) repeatedly resam-ples the training data and fits a Lasso regression model on each sample. A feature is said to be se-lected if it was sese-lected (i.e., assigned a non-zero weight) in at least 25% of the samples (we do this 1000 times). This strategy improves the robust-ness of Lasso in the presence of high dimensional and correlated inputs.
Feature selection with Gaussian Processes is done by fitting per-feature RBF widths (also known as the automatic relevance determination
kernel). The RBF width denotes the importance of a feature, the narrower the RBF the more impor-tant a change in the feature value is to the model prediction. To make the results comparable with our baseline systems we select the 17 top ranked features and then train a SVR on these features.8
As feature sets, we select all features available in QUEST for each of our datasets. We differen-tiate between black-box (BB) and glass-box (GB) features, as only BB are available for all datasets (we did not have access to the MT systems that produced the other datasets). For the WMT12 and GALE11 datasets, we experimented with both BB and GB features. For each dataset we build four systems:
• BL: 17 baseline features that performed well across languages in previous work and were used as baseline in the WMT12 QE task.
• AF: All features available for dataset.
• FS: Feature selection for automatic ranking and selection of top features with:
– RL: Randomised Lasso.
– GP: Gaussian Process.
Mean Absolute Error (MAE) and Root Mean Squared Error (RMSE) are used to evaluate the models.
3.3 Results
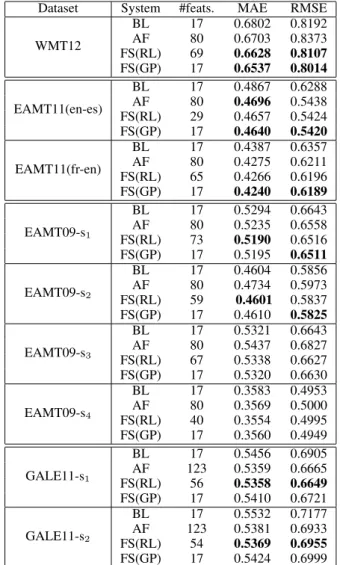
The error scores for all datasets with BB features are reported in Table 2, while Table 3 shows the re-sults with GB features, and Table 4 the rere-sults with BB and GB features together. For each table and dataset, bold-faced figures are significantly better than all others (paired t-test withp≤0.05).
It can be seen from the results that adding more BB features (systemsAF) improves the results in most cases as compared to the baseline systems
8More features resulted in further performance gains on
most tasks, with 25–35 features giving the best results.
Dataset System #feats. MAE RMSE WMT12
BL 17 0.6802 0.8192
AF 80 0.6703 0.8373
FS(RL) 69 0.6628 0.8107 FS(GP) 17 0.6537 0.8014
EAMT11(en-es)
BL 17 0.4867 0.6288
AF 80 0.4696 0.5438
FS(RL) 29 0.4657 0.5424 FS(GP) 17 0.4640 0.5420 EAMT11(fr-en)
BL 17 0.4387 0.6357
AF 80 0.4275 0.6211
FS(RL) 65 0.4266 0.6196 FS(GP) 17 0.4240 0.6189
EAMT09-s1
BL 17 0.5294 0.6643
AF 80 0.5235 0.6558
FS(RL) 73 0.5190 0.6516 FS(GP) 17 0.5195 0.6511 EAMT09-s2
BL 17 0.4604 0.5856
AF 80 0.4734 0.5973
FS(RL) 59 0.4601 0.5837 FS(GP) 17 0.4610 0.5825 EAMT09-s3
BL 17 0.5321 0.6643
AF 80 0.5437 0.6827
FS(RL) 67 0.5338 0.6627 FS(GP) 17 0.5320 0.6630 EAMT09-s4
BL 17 0.3583 0.4953
AF 80 0.3569 0.5000
FS(RL) 40 0.3554 0.4995 FS(GP) 17 0.3560 0.4949
GALE11-s1
BL 17 0.5456 0.6905
AF 123 0.5359 0.6665 FS(RL) 56 0.5358 0.6649 FS(GP) 17 0.5410 0.6721 GALE11-s2
BL 17 0.5532 0.7177
AF 123 0.5381 0.6933 FS(RL) 54 0.5369 0.6955 FS(GP) 17 0.5424 0.6999
Table 2: Results with BB features.
Dataset System #feats. MAE RMSE
WMT12 AF 47 0.7036 0.8476
FS(RL) 26 0.6821 0.8388 FS(GP) 17 0.6771 0.8308 GALE11-s1 AF 39 0.5720 0.7392 FS(RL) 46 0.5691 0.7388 FS(GP) 17 0.5711 0.7378 GALE11-s2
AF 48 0.5510 0.6977 FS(RL) 46 0.5512 0.6970 FS(GP) 17 0.5501 0.6978
Table 3: Results with GB features.
Dataset System #feats. MAE RMSE
WMT12 AF 127 0.7165 0.8476
FS(RL) 26 0.6601 0.8098 FS(GP) 17 0.6501 0.7989 GALE11-s1 AF 162 0.5437 0.6741 FS(RL) 69 0.5310 0.6681 FS(GP) 17 0.5370 0.6701 GALE11-s2
AF 171 0.5222 0.6499 FS(RL) 82 0.5152 0.6421 FS(GP) 17 0.5121 0.6384
BL, however, in some cases the improvements are not significant. This behaviour is to be expected as adding more features may bring more relevant information, but at the same time it makes the rep-resentation more sparse and the learning prone to overfitting. In most cases, feature selection with both or either RL and GP improves over all fea-tures (AF). It should be noted that RL automati-cally selects the number of features used for train-ing while FS(GP) was limited to selecttrain-ing the top 17 features in order to make the results compara-ble with our baseline feature set. It is interesting to note that system FS(GP) outperformed the other systems in spite of using fewer features. This tech-nique is promising as it reduces the time require-ments and overall computational complexity for training the model, while achieving similar results compared to systems with many more features.
Another interesting question is whether these feature selection techniques identify a common subset of features from the various datasets. The overall top ranked features are:
• LM perplexities and log probabilities for source and target;
• size of source and target sentences;
• average number of possible translations of source words (IBM 1 with thresholds);
• ratio of target by source lengths in words;
• percentage of numbers in the target sentence;
• percentage of distinct unigrams seen in the MT source training corpus.
Interestingly, not all top ranked features are among the baseline 17 features which are report-edly best in literature.
GB features on their own perform worse than BB features, but in all three datasets, the combi-nation of GB and BB followed by feature selec-tion resulted in significantly lower errors than us-ing only BB features with feature selection, show-ing that the two features sets are complementary.
4 Remarks
The source code for the framework, the datasets and extra resources can be downloaded from http://www.quest.dcs.shef.ac.uk/. The project is also set to receive contribution from interested researchers using a GitHub repository: https://github.com/lspecia/quest.
The license for the Java code, Python and shell scripts is BSD, a permissive license with no re-strictions on the use or extensions of the software
for any purposes, including commercial. For pre-existing code and resources, e.g.,scikit-learn,GPy
and Berkeley parser, their licenses apply, but fea-tures relying on these resources can be easily dis-carded if necessary.
Acknowledgments
This work was supported by the QuEst (EU FP7 PASCAL2 NoE, Harvest program) and QT-LaunchPad (EU FP7 CSA No. 296347) projects.
References
N. Bach, F. Huang, and Y. Al-Onaizan. 2011. Good-ness: a method for measuring machine translation
confidence. InACL11, pages 211–219, Portland.
J. Blatz, E. Fitzgerald, G. Foster, S. Gandrabur, C. Goutte, A. Kulesza, A. Sanchis, and N. Ueffing. 2004. Confidence Estimation for Machine
Transla-tion. InColing04, pages 315–321, Geneva.
C. Callison-Burch, P. Koehn, C. Monz, M. Post, R. Soricut, and L. Specia. 2012. Findings of the 2012 workshop on statistical machine translation. In WMT12, pages 10–51, Montr´eal.
Y. He, Y. Ma, J. van Genabith, and A. Way. 2010. Bridging SMT and TM with Translation
Recom-mendation. InACL10, pages 622–630, Uppsala.
N. Meinshausen and P. B¨uhlmann. 2010. Stability
se-lection. Journal of the Royal Statistical Society:
Se-ries B (Statistical Methodology), 72:417–473.
K. Papineni, S. Roukos, T. Ward, and W. Zhu. 2002. BLEU: a method for automatic evaluation of
ma-chine translation. In ACL02, pages 311–318,
Philadelphia.
C.E. Rasmussen and C.K.I. Williams. 2006.
Gaus-sian processes for machine learning, volume 1. MIT Press, Cambridge.
R. Soricut and A. Echihabi. 2010. Trustrank: Induc-ing trust in automatic translations via rankInduc-ing. In ACL11, pages 612–621, Uppsala.
L. Specia, M. Turchi, N. Cancedda, M. Dymetman, and N. Cristianini. 2009. Estimating the Sentence-Level Quality of Machine Translation Systems. In EAMT09, pages 28–37, Barcelona.
L. Specia, D. Raj, and M. Turchi. 2010.
Ma-chine translation evaluation versus quality
estima-tion. Machine Translation, 24(1):39–50.
L. Specia. 2011. Exploiting objective annotations
for measuring translation post-editing effort. In