DOI 10.1007/s00204-016-1928-z
TOXICOKINETICS AND METABOLISM
Long-term accumulation of diphenylarsinic acid in the central
nervous system of cynomolgus monkeys
Tomoyuki Masuda1,2,3 · Kazuhiro Ishii1 · Yasuo Seto4 · Tomoko Hosoya1 · Ryuta Tanaka5 · Tomohiro Nakayama6 · Nobuaki Iwasaki6 · Yasuyuki Shibata7 · Akira Tamaoka1
Received: 7 November 2016 / Accepted: 20 December 2016 / Published online: 25 January 2017 © The Author(s) 2017. This article is published with open access at Springerlink.com
We found that DPAA accumulated in the central nervous system tissues for a longer period than in other tissues. This inding would extend our knowledge on the distribution dynamics and metabolism of DPAA in primates, includ-ing humans. Furthermore, it may be useful for developinclud-ing a treatment strategy for patients who are exposed to DPAA.
Keywords LC–MS · Macaca fascicularis · Cerebrum · Cerebellum · Primate · Phenyl arsenic compound
Introduction
Seaweed contains a large number of organic arsenic com-pounds, including non-toxic comcom-pounds, and many toxic compounds are synthesized as pharmaceutical and chemi-cal warfare agents. Diphenylarsinic acid (DPAA) is an organic arsenic compound that was used for the synthesis of chemical weapons during World War II (Kurata 1980). In 2003, several patients with illnesses of unknown origin were reported in Ibaraki Prefecture, Japan. Organic arse-nic compounds that were found in the wells of Kamisu city in Ibaraki were identiied as the cause of these symptoms (Ishii et al. 2004). Contaminated water from one of the wells contained 4.5 mg As/L of DPAA, which is approxi-mately 450 times higher than the concentration permitted by the drinking water quality standards in Japan (Kinoshita
et al. 2005; Shibata et al. 2005). A total of 157 residents
who were exposed to DPAA presented with progressive cerebellar and brain stem symptoms, including nystagmus, dizziness, ataxic gait, tremors, myoclonus and dysarthria, along with temporal and occipital lobe symptoms, includ-ing memory impairment, sleep disturbance, and visual dis-orders, as well as cerebral atrophy and mental retardation in
Abstract Diphenylarsinic acid (DPAA) is an organic arsenic compound used for the synthesis of chemical weap-ons. We previously found that the residents of Kamisu city in Ibaraki Prefecture, Japan, were exposed to DPAA through contaminated well water in 2003. Although mount-ing evidence strongly suggests that their neurological symptoms were caused by DPAA, the dynamics of DPAA distribution and metabolism after ingestion by humans remain to be elucidated. To accurately predict the distri-bution of DPAA in the human body, we administrated DPAA (1.0 mg/kg/day) to cynomolgus monkeys (n = 28) for 28 days. The whole tissues from these monkeys were collected at 5, 29, 170, and 339 days after the last admin-istration. The concentration of DPAA in these tissues was measured by liquid chromatography–mass spectrometry.
* Kazuhiro Ishii
kazishii@md.tsukuba.ac.jp
1 Department of Neurology, Faculty of Medicine, University
of Tsukuba, Ibaraki 305-8575, Japan 2
Doctoral and Master’s Programs in Kansei, Behavioral and Brain Sciences, Graduate School of Comprehensive Human Sciences, University of Tsukuba, Ibaraki 305-8577, Japan
3 Department of Neurobiology, Faculty of Medicine,
University of Tsukuba, Ibaraki 305-8577, Japan 4
Third Department of Forensic Science, National Research Institute of Police Science, Chiba 277-0882, Japan
5 Department of Child Health, Faculty of Medicine, University
of Tsukuba, Ibaraki 305-8575, Japan 6
Department of Pediatrics, Ibaraki Prefectural University of Health Sciences, Ibaraki 300-0331, Japan
7 Center for Environmental Measurement and Analysis,
children. The patients have been receiving regular medical checkups for more than 10 years.
Although mounting evidence strongly suggests that these neurological symptoms were caused by DPAA (Ishii et al. 2004), our knowledge about the in vivo distribution and efects of DPAA remains limited. The efects of DPAA in higher vertebrates have been demonstrated using rodents. The oral administration of DPAA to mice led to higher accumulation of DPAA in the brain than in the liver (Ozone et al. 2010). Furthermore, DPAA has been reported to dam-age the Purkinje cells and cause behavioral impairment in mice (Ozone et al. 2010; Umezu et al. 2012). In rats, the oral administration of DPAA led to a higher accumula-tion of DPAA in the brain and pancreas in comparison to inorganic arsenic compounds (Naranmandura et al. 2009), as well as behavioral impairment (Negishi et al. 2013). We previously administered DPAA to rats and established a rodent model with the same acute cerebellar and brain stem symptoms as those of patients in Kamisu (Masuda and Ishii, unpublished observation). However, their symptoms lasted for a shorter period compared to those of the patients (Masuda and Ishii, unpublished observation). Several stud-ies have also shown that the distribution and metabolism of arsenic compounds are diferent among rodents and primates (Vahter and Marafante 1985; Vahter et al. 1995;
Aposhian 1997). Therefore, it is diicult for us to predict
the pattern of DPAA accumulation in the human central nervous system (CNS) solely based on the data from rodent studies. Thus, we decided to use primates to examine the accurate distribution of DPAA in the human CNS. The only primate study in relation to DPAA investigated the DPAA concentrations in the blood, urine, and feces of primates after oral administration (Kobayashi et al. 2008).
Previously, DPAA and its related metabolites have been identiied in biological and environmental samples using liquid chromatography (LC) coupled with induced coupled plasma ionization mass spectrometry (ICP–MS), in which they were detected as arsenic atom-containing compounds (Kobayashi et al. 2008; Hempel et al. 2009). In the present study, we adopted isotope dilution LC–mass spectrometry (LC–MS). Internal standard compounds of DPAA and their
metabolites labeled with 13C were added to the tissue
sam-ples. Unlabeled target phenyl arsenic compounds and their corresponding isotope-labeled congeners were extracted and subjected to LC–MS. Isotope dilution LC–MS is extremely useful because it can provide exact compensa-tion of extraccompensa-tion recovery from biological samples and eicient mass spectrometric ionization.
In the present study, we used cynomolgus monkeys to predict the distribution and metabolism of DPAA in humans. We measured the concentration of DPAA in vari-ous tissue samples by LC–MS at 5–339 days after the last administration of DPAA.
Materials and methods
Arsenic
Phenyl arsenic compounds [DPAA (>99.0%), DPMAO (diphenylmethylarsine oxide: >99.0%), phenylmethy-larsinic acid (PMAA: >99.0%), phenyldimethylarsine oxide (PDMAO: >99.0%), and phenylarsonic acid (PAA: >99.0%)] were purchased from Tri Chemical Laborato-ries (Yamanashi, Japan) and stored at 4 °C in the dark.
Stable radioactive isotopes (13C-DPAA, 13C-DPMAO,
13C-PMAA, 13C-PDMAO, and 13C-PAA: >95.0%) were
produced by Hayashi Pure Chemical Industries (Osaka, Japan).
Animals
Twenty-eight cynomolgus monkeys (Macaca fascicula-ris) were purchased from the HAMRI CO., LTD. (Ibaraki, Japan). The average weights of the male and female mon-keys were 3.44 kg (n = 14) and 2.81 kg (n = 14), respec-tively. The administration of DPAA to the monkeys and tis-sue sampling were performed at LSI Medience Corporation (Tokyo, Japan). All of the experiments were conducted in accordance with the Guidelines for Proper Conduct of Ani-mal Experiments by the Science Council of Japan.
Animal experiments and the sampling of tissues and body luids
DPAA was dissolved in distilled water at a concentration of 10 mg/mL and the pH was adjusted to 7.0 with 1 N NaOH. It was then administrated through a nasogastric tube at a dose of 1.0 mg/kg/day. This concentration was determined based on the approximate levels of human exposure in Kamisu. After the repeated administration of DPAA for 28 days, the monkeys were divided into four groups. Mon-keys in the irst group (n = 6), second group (n = 6), third group (n = 8) and fourth group (n = 8) were euthanized at 5, 29, 170, and 339 days after the last administration, respectively.
and stored at −80 °C. Also, four types of body luids (cer-ebrospinal luid, bile, hemocyte, and serum) were collected and stored at −80 °C.
Extraction of phenyl arsenic compounds
20% of the homogenates of tissue samples were prepared in 50 mM ammonium acetate solution (Wako Pure Chemi-cal Industries, Ltd., Osaka, Japan) using a Telon homog-enizer (Ikemoto Scientiic Technology Co., Ltd., Tokyo, Japan). Then, these homogenized samples, as well as the cerebrospinal luid (CSF) and bile samples were ultra-cen-trifuged at 105,000×g at 4 °C and the supernatants were obtained. The collected blood was centrifuged at 3000×g for 10 min and separated into hemocytes and serum. The hemocytes were washed three times with 50 mM of
Tris-bufered saline (pH 7.4). Thereafter, 10 mM of Tris–HNO3
bufer was added to the hemocyte solution and centrifuged at 15,000×g for 30 min.
Next, 0.1 mL of bovine serum albumin (80 mg/mL; Takara Bio Inc., Shiga, Japan), 1 mL of 4 M NaOH, and
0.9 mL of H2O were added to 0.1 g of the samples
pre-pared above. Then, stable radioactive isotopes 13C-DPAA,
13C-DPMAO, 13C-PMAA, 13C-PDMAO, and 13C-PAA
(each 100 ppb) were added to the mixed solution and incu-bated at 90 °C for 3 h. After adding diethyl ether (Wako Pure Chemical Industries, Ltd.: >99.5%), the mixed solu-tion was centrifuged for 5 min to extract phenyl arsenic compounds with diethyl ether. The diethyl ether was then removed from the phenyl arsenic compounds using a
stream of dry N2. After the addition of nitric acid (Wako
Pure Chemical Industries, Ltd.), the phenyl arsenic
com-pounds were completely dissolved in 10 mL of H2O.
Analysis of phenyl arsenic
Shiseido Nanospace SI-2 (Shiseido Co., Ltd., Tokyo, Japan) and TSQ Quantum Ultra (Thermo Fisher Sci-entiic Corp., CA, USA) LC–MS instruments were used. Chromatographic separation was achieved using two reversed-phase columns (Imtakt Unison UK-C18; 150 × 3.0 mm i.d., 3 µm thickness, Kyoto, Japan; Imtakt Unison UP-Phenyl, 150 × 3.0 mm i.d., 3 µm thickness) at 40 °C. 50 µL of sample solution was injected. In both columns, elution was performed using a linear gradient of 0.1% formic acid (Wako Pure Chemical Industries, Ltd.: 99.0%) in water [A] with 0.1% formic acid in meth-anol–water (1:9, v/v) [B] as follows: 95% [A]: 5% [B] (5-min hold), 95% [A]: 5% [B] to 100% [B] (5–10 min), 100% [B] (5-min hold), 100% [B] to 95% [A]: 5% [B] (20–10 min), 95% [A]: 5% [B] (14-min hold). The low rate was maintained at 0.25 mL/min. Electrospray ionization was performed in positive ionization mode.
The [M + H]+ions of the targeted compounds (DPAA,
13C-DPAA, DPMAO, 13C-DPMAO, PMAA, 13C-PMAA,
PDMAO, 13C-PDMAO, PAA, 13C-PAA) were selected
as the precursor ions. Selected reaction monitoring was used to quantify each compound. The precursor and product ions were monitored. The collision energies of the compounds were as follows: m/z 263 > 152, 30 eV
for DPAA; m/z 275 > 158, 30 eV for 13C-DPAA; m/z
261 > 154, 35 eV for DPMAO; m/z 273 > 160, 35 eV for
13C-DPMAO; m/z 203 > 77, 21 eV for PAA; m/z 209 > 83,
21 eV for 13C-PAA; m/z 201 > 77, 35 eV for PMAA; m/z
207 > 83, 35 eV for 13C-PMAA; m/z 199 > 169, 25 eV
for PDMAO; and m/z 205 > 175, 25 eV for 13C-PDMAO.
To determine the compounds with greater precision, we monitored the other product ions as well: m/z 203 > 185 for PAA; m/z 201 > 94 for PMAA; m/z 199 > 77 for PDMAO. The MS parameters for the analysis were as
follows: spray voltage, 4000 V; sheath gas (N2) pressure,
6 Pa; auxiliary gas (N2) pressure, 0.5 Pa; capillary
tem-perature, 230 °C; vaporizing temtem-perature, 450 °C; tube lens ofset, 100 V; collision gas (Ar) pressure, 0.2 Pa. Data acquisition and instrument control were performed using the Xcalibur software program (Thermo Fisher Sci-entiic Corp.).
Also, a phenyl column was used for the qualitative con-irmation of the target compounds detected in the C18 column analysis, and to avoid the false-positive detection of the target compounds in the C18 column analysis. The retention times, peak widths at half height, and the limit of detection (LOD, signal-to-noise ratio = 3) of the phenyl arsenic compounds in aqueous solution on the C18 col-umn analysis were 14.2 min, 0.086 min, and 14 pg/mL, respectively, for DPAA; 13.8 min, 0.066 min, and 6.2 pg/ mL for DPMAO; 12.4 min, 0.086 min, and 140 pg/mL for PAA; 12.5 min, 0.065 min, and 130 pg/mL for PMAA; and 11.8 min, 0.097 min, and 62 pg/mL for PDMAO. Similarly, the values for the phenyl arsenic compounds that were run on the phenyl column were 14.3 min, 0.086 min, and 25 g/mL, respectively, for DPAA; 14.2 min, 0.063 min, and 18 pg/mL for DPMAO; 11.4 min, 0.233 min, and 910 pg/mL for PAA; 12.4 min, 0.106 min, and 83 pg/mL for PMAA; and 12.2 min, 0.064 min, and 130 pg/mL for PDMAO. The LOD values for the tissue extract samples were higher than those for aqueous solution, depending on the tissue sample matrix. This was due to interference from the matrix, which typically suppresses the ionization of the target compounds and prevents the detection of peaks with overlapping matrix components. In the C18 column analy-sis, the relative intra-day deviations (n = 4) of the peak area ratios on the product ion spectra for arsenic compounds
(20 ng/mL) to those for corresponding 13C-labelled ones
respectively. The relative intra-day deviations in the phenyl column analysis (n = 5) were 3.6, 1.3, 7.9, 4.2, and 3.7%, respectively.
Data analysis
To calculate the half-life (T1/2; the time required for the
concentration to decrease to half its initial value) of DPAA, we plotted the DPAA concentrations (at 5 and 29 days after the last administration of DPAA) in each of tissue and body luid sample against the concentration values on the loga-rithmic scale. The half-lives were calculated based on the
slope of the decay lines (slope = −k/2.303, T1/2 = 0.693/k).
Statistical analyses and preparation of approximate graph curves
Tukey’s method was used for multiple group comparisons. The JMP software program (version 5.12-J, SAS Institute Inc., NC, USA) was used to perform the statistical analyses. P values of <0.05 were considered to indicate statistical signiicance. The JMP software program (version 5.12-J) was also used to perform a curvilinear regression analysis, which allowed us to approximate the quadratic curves.
Results
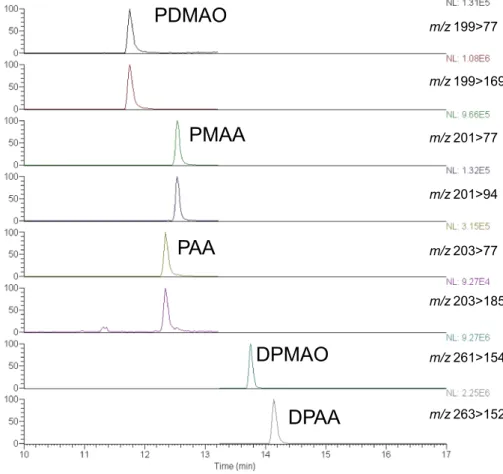
Liquid chromatography–mass spectrometry
DPAA and its related metabolites were identiied in tis-sue samples by LC–MS using the isotope dilution method. These phenyl arsenic compounds were well separated in LC conditions using both C18 and phenyl columns. The
[M + H]+ ions of the target compounds were carefully
observed by electrospray ionization. 50 µL of the sample solution was injected into the LC–MS system to achieve optimal detection sensitivity. Imtakt Unison columns ena-bled large-volume injection without compromising the peak resolution. During selected reaction monitoring (SRM), the product ions and collision energies were selected by opti-mizing the conditions in the product ion scan spectra of the target precursor ions. A typical SRM chromatogram for
the control phenyl arsenic compounds is shown in Fig. 1.
Calibration curves were prepared for the peak area ratios of the target phenyl arsenic compounds of the
correspond-ing 13C-labeled internal standards on the respective SRM
chromatograms. We irst used a C18 column to determine the target compounds in the samples. If positive peaks were observed on SRM, the presence of the corresponding prod-uct ion peaks was tested for PAA, PMAA, and PDMAO to
Fig. 1 A selected reaction monitoring chromatogram for the phenyl arsenic compounds in aqueous solution. 50 µL of DPAA, DPMAO, PAA, PMAA, and PDMAO solution (each 33.3 ng/mL) was injected into the LC–MS system itted with a C18 column. The 100% ionic intensities and mass transitions are shown on the right. (Color igure online)
DPAA
DPMAO
PAA
PMAA
PDMAO
m/z199>77
m/z199>169
m/z201>77
m/z201>94
m/z203>77
m/z203>185
m/z261>154
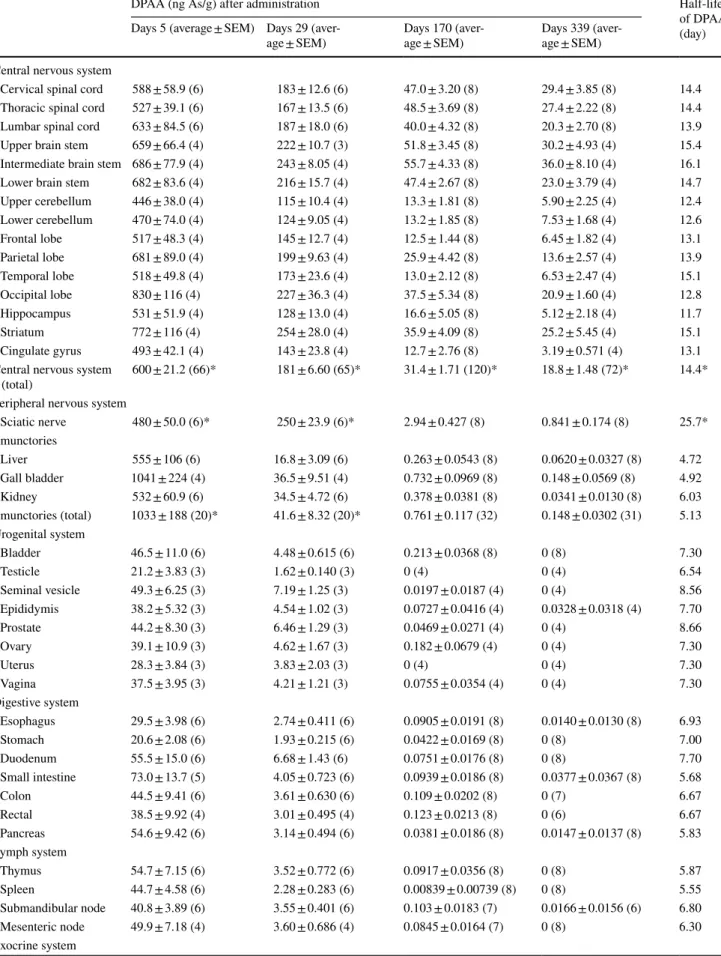
Table 1 DPAA concentration in the tissues of cynomolgus monkeys after oral administration of DPAA
DPAA (ng As/g) after administration Half-life
of DPAA (day) Days 5 (average ± SEM) Days 29
(aver-age ± SEM)
Days 170 (aver-age ± SEM)
Days 339 (aver-age ± SEM)
Central nervous system
Cervical spinal cord 588 ± 58.9 (6) 183 ± 12.6 (6) 47.0 ± 3.20 (8) 29.4 ± 3.85 (8) 14.4
Thoracic spinal cord 527 ± 39.1 (6) 167 ± 13.5 (6) 48.5 ± 3.69 (8) 27.4 ± 2.22 (8) 14.4
Lumbar spinal cord 633 ± 84.5 (6) 187 ± 18.0 (6) 40.0 ± 4.32 (8) 20.3 ± 2.70 (8) 13.9
Upper brain stem 659 ± 66.4 (4) 222 ± 10.7 (3) 51.8 ± 3.45 (8) 30.2 ± 4.93 (4) 15.4
Intermediate brain stem 686 ± 77.9 (4) 243 ± 8.05 (4) 55.7 ± 4.33 (8) 36.0 ± 8.10 (4) 16.1
Lower brain stem 682 ± 83.6 (4) 216 ± 15.7 (4) 47.4 ± 2.67 (8) 23.0 ± 3.79 (4) 14.7
Upper cerebellum 446 ± 38.0 (4) 115 ± 10.4 (4) 13.3 ± 1.81 (8) 5.90 ± 2.25 (4) 12.4
Lower cerebellum 470 ± 74.0 (4) 124 ± 9.05 (4) 13.2 ± 1.85 (8) 7.53 ± 1.68 (4) 12.6
Frontal lobe 517 ± 48.3 (4) 145 ± 12.7 (4) 12.5 ± 1.44 (8) 6.45 ± 1.82 (4) 13.1
Parietal lobe 681 ± 89.0 (4) 199 ± 9.63 (4) 25.9 ± 4.42 (8) 13.6 ± 2.57 (4) 13.9
Temporal lobe 518 ± 49.8 (4) 173 ± 23.6 (4) 13.0 ± 2.12 (8) 6.53 ± 2.47 (4) 15.1
Occipital lobe 830 ± 116 (4) 227 ± 36.3 (4) 37.5 ± 5.34 (8) 20.9 ± 1.60 (4) 12.8
Hippocampus 531 ± 51.9 (4) 128 ± 13.0 (4) 16.6 ± 5.05 (8) 5.12 ± 2.18 (4) 11.7
Striatum 772 ± 116 (4) 254 ± 28.0 (4) 35.9 ± 4.09 (8) 25.2 ± 5.45 (4) 15.1
Cingulate gyrus 493 ± 42.1 (4) 143 ± 23.8 (4) 12.7 ± 2.76 (8) 3.19 ± 0.571 (4) 13.1
Central nervous system (total)
600 ± 21.2 (66)* 181 ± 6.60 (65)* 31.4 ± 1.71 (120)* 18.8 ± 1.48 (72)* 14.4*
Peripheral nervous system
Sciatic nerve 480 ± 50.0 (6)* 250 ± 23.9 (6)* 2.94 ± 0.427 (8) 0.841 ± 0.174 (8) 25.7*
Emunctories
Liver 555 ± 106 (6) 16.8 ± 3.09 (6) 0.263 ± 0.0543 (8) 0.0620 ± 0.0327 (8) 4.72
Gall bladder 1041 ± 224 (4) 36.5 ± 9.51 (4) 0.732 ± 0.0969 (8) 0.148 ± 0.0569 (8) 4.92
Kidney 532 ± 60.9 (6) 34.5 ± 4.72 (6) 0.378 ± 0.0381 (8) 0.0341 ± 0.0130 (8) 6.03
Emunctories (total) 1033 ± 188 (20)* 41.6 ± 8.32 (20)* 0.761 ± 0.117 (32) 0.148 ± 0.0302 (31) 5.13
Urogenital system
Bladder 46.5 ± 11.0 (6) 4.48 ± 0.615 (6) 0.213 ± 0.0368 (8) 0 (8) 7.30
Testicle 21.2 ± 3.83 (3) 1.62 ± 0.140 (3) 0 (4) 0 (4) 6.54
Seminal vesicle 49.3 ± 6.25 (3) 7.19 ± 1.25 (3) 0.0197 ± 0.0187 (4) 0 (4) 8.56
Epididymis 38.2 ± 5.32 (3) 4.54 ± 1.02 (3) 0.0727 ± 0.0416 (4) 0.0328 ± 0.0318 (4) 7.70
Prostate 44.2 ± 8.30 (3) 6.46 ± 1.29 (3) 0.0469 ± 0.0271 (4) 0 (4) 8.66
Ovary 39.1 ± 10.9 (3) 4.62 ± 1.67 (3) 0.182 ± 0.0679 (4) 0 (4) 7.30
Uterus 28.3 ± 3.84 (3) 3.83 ± 2.03 (3) 0 (4) 0 (4) 7.30
Vagina 37.5 ± 3.95 (3) 4.21 ± 1.21 (3) 0.0755 ± 0.0354 (4) 0 (4) 7.30
Digestive system
Esophagus 29.5 ± 3.98 (6) 2.74 ± 0.411 (6) 0.0905 ± 0.0191 (8) 0.0140 ± 0.0130 (8) 6.93
Stomach 20.6 ± 2.08 (6) 1.93 ± 0.215 (6) 0.0422 ± 0.0169 (8) 0 (8) 7.00
Duodenum 55.5 ± 15.0 (6) 6.68 ± 1.43 (6) 0.0751 ± 0.0176 (8) 0 (8) 7.70
Small intestine 73.0 ± 13.7 (5) 4.05 ± 0.723 (6) 0.0939 ± 0.0186 (8) 0.0377 ± 0.0367 (8) 5.68
Colon 44.5 ± 9.41 (6) 3.61 ± 0.630 (6) 0.109 ± 0.0202 (8) 0 (7) 6.67
Rectal 38.5 ± 9.92 (4) 3.01 ± 0.495 (4) 0.123 ± 0.0213 (8) 0 (6) 6.67
Pancreas 54.6 ± 9.42 (6) 3.14 ± 0.494 (6) 0.0381 ± 0.0186 (8) 0.0147 ± 0.0137 (8) 5.83
Lymph system
Thymus 54.7 ± 7.15 (6) 3.52 ± 0.772 (6) 0.0917 ± 0.0356 (8) 0 (8) 5.87
Spleen 44.7 ± 4.58 (6) 2.28 ± 0.283 (6) 0.00839 ± 0.00739 (8) 0 (8) 5.55
Submandibular node 40.8 ± 3.89 (6) 3.55 ± 0.401 (6) 0.103 ± 0.0183 (7) 0.0166 ± 0.0156 (6) 6.80
Mesenteric node 49.9 ± 7.18 (4) 3.60 ± 0.686 (4) 0.0845 ± 0.0164 (7) 0 (8) 6.30
provide deinitive conirmation of their presence, because these highly hydrophilic compounds typically sufer from severe interference from the biological matrix components in sample extracts during LC separation and MS detection.
Quantitative analysis of DPAA in the tissues of cynomolgus monkeys
Twenty-eight cynomolgus monkeys were exposed to DPAA for 28 days at a dose of 1.0 mg DPAA/kg/day. After the oral administration of DPAA, the monkeys were divided into four groups (each group contained 6–8 monkeys), which were euthanized at 5, 29, 170, and 339 days after the last administration of DPAA. The whole tissues and body luids were collected after euthanasia (Table 1).
We measured the concentration of DPAA in the tis-sues of animals from each group using a LC–MS analysis. The concentrations of DPAA in all of the tissues showed
a gradual decrease with time after the last
administra-tion (Table 2; Fig. 1). At 5 days after the last
administra-tion, we found that the average concentrations of DPAA in the tissues derived from the CNS (600 ± 21.2 ng As/g),
the emunctories (1033 ± 188 ng As/g), and the sciatic
nerve (480 ± 50.0 ng As/g) were signiicantly higher
than those derived from other tissues (total 34 tissues, 43.2 ± 2.49 ng As/g) (Fig. 2; Table 1; p < 0.0001).
At 29 days after the last administration, the aver-age concentrations of DPAA in the CNS
tis-sues (181 ± 6.60 ng As/g) and the sciatic nerve
(250 ± 23.9 ng As/g) were 30.1 and 52.1% of values at
the 5-day time point, respectively (Fig. 3; Table 1). On
the other hand, the average concentrations of DPAA in the emunctories (41.6 ± 8.32 ng As/g) and other tissues (4.76 ± 0.311 ng As/g) were drastically lower in compari-son to those of the group that was euthanized at 5 days after
the last administration (Fig. 3; Table 1) (4.03 and 11.0%
The number between brackets indicates the number of samples examined *p < 0.0001, compared with other tissues
Table 1 (continued)
DPAA (ng As/g) after administration Half-life
of DPAA (day) Days 5 (average ± SEM) Days 29
(aver-age ± SEM)
Days 170 (aver-age ± SEM)
Days 339 (aver-age ± SEM)
Parotid gland 41.3 ± 10.6 (6) 2.20 ± 0.156 (6) 0.0511 ± 0.0170 (8) 0 (8) 6.03
Submandibular gland 146 ± 35.2 (6) 13.2 ± 1.94 (6) 0.0396 ± 0.0150 (8) 0 (8) 7.53
Sublingual gland 39.7 ± 9.63 (6) 7.36 ± 1.41 (6) 0.0760 ± 0.0295 (8) 0.0445 ± 0.0215 (8) 9.90
Lacrimal gland 62.1 ± 11.0 (4) 3.35 ± 0.697 (4) 0.101 ± 0.0237 (6) 0.0175 ± 0.0165 (8) 5.68
Endocrine system
Adrenal gland 37.4 ± 6.65 (6) 4.07 ± 2.49 (6) 0.0542 ± 0.0322 (8) 0 (8) 6.03
Pituitary 28.7 ± 2.82 (6) 3.72 ± 0.424 (6) 0.200 ± 0.0382 (8) 0 (8) 8.06
Thyroid 16.2 ± 3.23 (6) 0.946 ± 0.112 (6) 0 (8) 0.0287 ± 0.0277 (8) 6.03
Respiratory system
Trachea 20.3 ± 1.46 (6) 4.51 ± 0.750 (6) 1.44 ± 0.168 (8) 0.815 ± 0.119 (8) 10.7
Lung 106 ± 15.6 (6) 10.4 ± 1.36 (6) 0.227 ± 0.0578 (8) 0.0259 ± 0.0163 (8) 7.15
Muscular system
Femoral muscle 25.9 ± 3.72 (6) 5.94 ± 0.746 (6) 0.109 ± 0.0247 (8) 0 (8) 11.4
Tongue 43.0 ± 6.18 (6) 5.31 ± 0.917 (6) 0.0878 ± 0.0245 (8) 0.0213 ± 0.0203 (8) 7.88
Sense organs
Eyeball 7.80 ± 2.02 (6) 3.06 ± 0.938 (6) 0.260 ± 0.0529 (8) 0.149 ± 0.0492 (8) 20.4
Skin with hair 49.9 ± 4.02 (6) 16.2 ± 4.27 (6) 1.70 ± 0.410 (8) 0.369 ± 0.255 (8) 12.6
Blood–vascular system
Heart 48.3 ± 6.20 (6) 6.36 ± 0.740 (6) 0.147 ± 0.0245 (8) 0.00730 ± 0.00630 (8) 8.25
Aorta 41.9 ± 7.96 (4) 5.12 ± 0.765 (4) 1.17 ± 0.262 (8) 0.458 ± 0.0896 (8) 7.97
Other tissues (total) 43.2 ± 2.49 (188) 4.76 ± 0.311 (187) 0.218 ± 0.0298 (255) 0.0643 ± 0.0139 (255) 7.30
Body luids
Cerebrospinal luid 1.78 ± 0.252 (6) 0.233 ± 0.0268 (6) 0 (8) 0 (6) 8.25
Bile 2496 ± 287 (4) 94.5 ± 27.4 (4) 1.67 ± 0.228 (8) 0.377 ± 0.0462 (7) 4.88
Hemocyte 9.03 ± 0.936 (2) 2.05 ± 0.782 (2) 0 (1) – 10.7
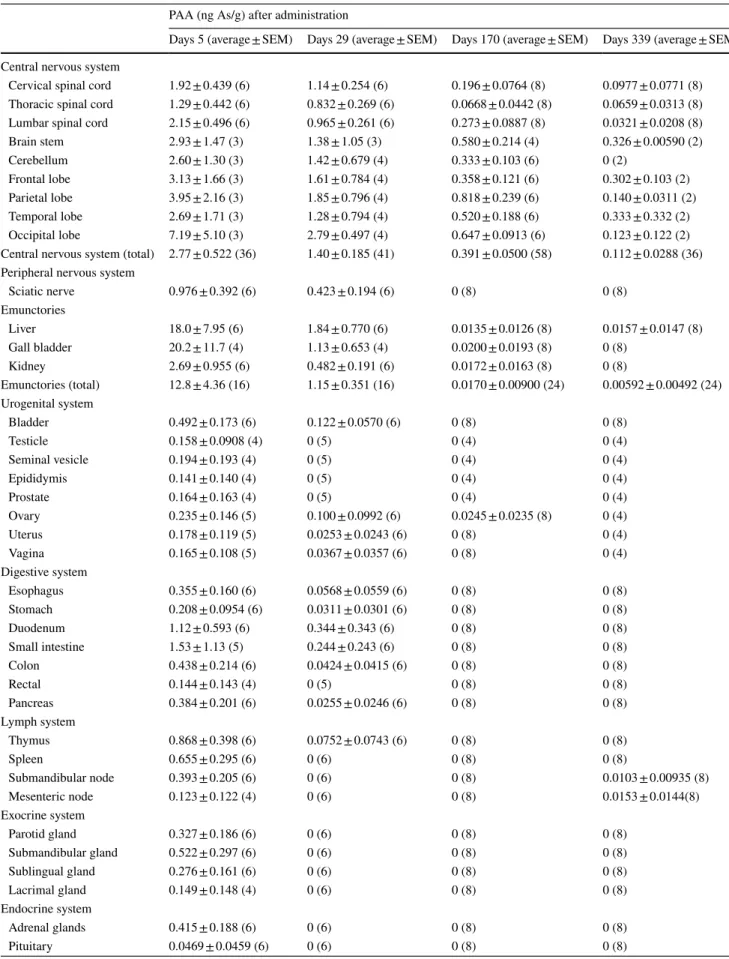
Table 2 PAA concentration in cynomolgus monkeys after oral administration of DPAA
PAA (ng As/g) after administration
Days 5 (average ± SEM) Days 29 (average ± SEM) Days 170 (average ± SEM) Days 339 (average ± SEM)
Central nervous system
Cervical spinal cord 1.92 ± 0.439 (6) 1.14 ± 0.254 (6) 0.196 ± 0.0764 (8) 0.0977 ± 0.0771 (8)
Thoracic spinal cord 1.29 ± 0.442 (6) 0.832 ± 0.269 (6) 0.0668 ± 0.0442 (8) 0.0659 ± 0.0313 (8)
Lumbar spinal cord 2.15 ± 0.496 (6) 0.965 ± 0.261 (6) 0.273 ± 0.0887 (8) 0.0321 ± 0.0208 (8)
Brain stem 2.93 ± 1.47 (3) 1.38 ± 1.05 (3) 0.580 ± 0.214 (4) 0.326 ± 0.00590 (2)
Cerebellum 2.60 ± 1.30 (3) 1.42 ± 0.679 (4) 0.333 ± 0.103 (6) 0 (2)
Frontal lobe 3.13 ± 1.66 (3) 1.61 ± 0.784 (4) 0.358 ± 0.121 (6) 0.302 ± 0.103 (2)
Parietal lobe 3.95 ± 2.16 (3) 1.85 ± 0.796 (4) 0.818 ± 0.239 (6) 0.140 ± 0.0311 (2)
Temporal lobe 2.69 ± 1.71 (3) 1.28 ± 0.794 (4) 0.520 ± 0.188 (6) 0.333 ± 0.332 (2)
Occipital lobe 7.19 ± 5.10 (3) 2.79 ± 0.497 (4) 0.647 ± 0.0913 (6) 0.123 ± 0.122 (2)
Central nervous system (total) 2.77 ± 0.522 (36) 1.40 ± 0.185 (41) 0.391 ± 0.0500 (58) 0.112 ± 0.0288 (36)
Peripheral nervous system
Sciatic nerve 0.976 ± 0.392 (6) 0.423 ± 0.194 (6) 0 (8) 0 (8)
Emunctories
Liver 18.0 ± 7.95 (6) 1.84 ± 0.770 (6) 0.0135 ± 0.0126 (8) 0.0157 ± 0.0147 (8)
Gall bladder 20.2 ± 11.7 (4) 1.13 ± 0.653 (4) 0.0200 ± 0.0193 (8) 0 (8)
Kidney 2.69 ± 0.955 (6) 0.482 ± 0.191 (6) 0.0172 ± 0.0163 (8) 0 (8)
Emunctories (total) 12.8 ± 4.36 (16) 1.15 ± 0.351 (16) 0.0170 ± 0.00900 (24) 0.00592 ± 0.00492 (24)
Urogenital system
Bladder 0.492 ± 0.173 (6) 0.122 ± 0.0570 (6) 0 (8) 0 (8)
Testicle 0.158 ± 0.0908 (4) 0 (5) 0 (4) 0 (4)
Seminal vesicle 0.194 ± 0.193 (4) 0 (5) 0 (4) 0 (4)
Epididymis 0.141 ± 0.140 (4) 0 (5) 0 (4) 0 (4)
Prostate 0.164 ± 0.163 (4) 0 (5) 0 (4) 0 (4)
Ovary 0.235 ± 0.146 (5) 0.100 ± 0.0992 (6) 0.0245 ± 0.0235 (8) 0 (4)
Uterus 0.178 ± 0.119 (5) 0.0253 ± 0.0243 (6) 0 (8) 0 (4)
Vagina 0.165 ± 0.108 (5) 0.0367 ± 0.0357 (6) 0 (8) 0 (4)
Digestive system
Esophagus 0.355 ± 0.160 (6) 0.0568 ± 0.0559 (6) 0 (8) 0 (8)
Stomach 0.208 ± 0.0954 (6) 0.0311 ± 0.0301 (6) 0 (8) 0 (8)
Duodenum 1.12 ± 0.593 (6) 0.344 ± 0.343 (6) 0 (8) 0 (8)
Small intestine 1.53 ± 1.13 (5) 0.244 ± 0.243 (6) 0 (8) 0 (8)
Colon 0.438 ± 0.214 (6) 0.0424 ± 0.0415 (6) 0 (8) 0 (8)
Rectal 0.144 ± 0.143 (4) 0 (5) 0 (8) 0 (8)
Pancreas 0.384 ± 0.201 (6) 0.0255 ± 0.0246 (6) 0 (8) 0 (8)
Lymph system
Thymus 0.868 ± 0.398 (6) 0.0752 ± 0.0743 (6) 0 (8) 0 (8)
Spleen 0.655 ± 0.295 (6) 0 (6) 0 (8) 0 (8)
Submandibular node 0.393 ± 0.205 (6) 0 (6) 0 (8) 0.0103 ± 0.00935 (8)
Mesenteric node 0.123 ± 0.122 (4) 0 (6) 0 (8) 0.0153 ± 0.0144(8)
Exocrine system
Parotid gland 0.327 ± 0.186 (6) 0 (6) 0 (8) 0 (8)
Submandibular gland 0.522 ± 0.297 (6) 0 (6) 0 (8) 0 (8)
Sublingual gland 0.276 ± 0.161 (6) 0 (6) 0 (8) 0 (8)
Lacrimal gland 0.149 ± 0.148 (4) 0 (6) 0 (8) 0 (8)
Endocrine system
Adrenal glands 0.415 ± 0.188 (6) 0 (6) 0 (8) 0 (8)
of values at the 5-day time point, respectively). We also examined the half-life of DPAA in each tissue (Table 1). The average half-lives of DPAA in the CNS tissues and the sciatic nerve (14.4 and 25.7 days, respectively) were sig-niicantly longer in comparison to DPAA in other tissues (p < 0.0001).
In the group that was euthanized at 339 days after the last administration, the concentrations of DPAA in all of the tissues were more than 96% lower than those in the group euthanized at 5 days after the last administration (Table 1). Notably, the average concentration of DPAA in the CNS tissues (18.8 ± 1.48 ng As/g) was signiicantly higher than that in all of the other tissues, even at 339 days after the last administration (Fig. 3; Table 1; p < 0.0001).
Quantitative analysis of DPAA in the body luids of cynomolgus monkeys
Next, we measured the concentration of DPAA in the body luids of each group using an LC–MS analysis. A small amount of DPAA was detected in the serum and the hemocytes at 5 and 29 days after the last
administra-tion (Fig. 4; Table 1). It was not detected after these time
points. Similarly, DPAA was detected at a concentration of 0.233 ± 0.0268 ng As/g in the CSF at 29 days, and was not detected later (Fig. 4; Table 1). On the contrary, a large
amount of DPAA was detected in the bile at 5 days after the last administration (2496 ± 287 ng As/g) (Table 1); the con-centration at 29 days after the last administration was 3.79% of the value at the 5-day time point (94.5 ± 27.4 ng As/g). The average half-life of DPAA in the bile was 4.88 days.
Quantitative analysis of PAA and PMAA in cynomolgus monkeys
PAA and PMAA are known to be the major metabo-lites of DPAA. We measured the concentrations of PAA and PMAA in the same tissues of each group described above using an LC–MS analysis. We detected very small amounts of PAA and PMAA in these tissues at 5–339 days
after the last administration (Tables 2, 3). The
concentra-tions of PAA and PMAA in the CNS tissues (2.77 ± 0.522 and 0.973 ± 0.184 ng As/g, respectively) and emunctories (12.8 ± 4.36 and 1.66 ± 0.658 ng As/g, respectively) were a little higher than those in other tissues at 5 days after the last administration (Tables 2, 3).
Discussion
In the present study, we examined the clearance of orally administrated DPAA in cynomolgus monkeys. Our results The number between brackets indicates the number of samples examined
Table 2 (continued)
PAA (ng As/g) after administration
Days 5 (average ± SEM) Days 29 (average ± SEM) Days 170 (average ± SEM) Days 339 (average ± SEM)
Thyroid 0.187 ± 0.0658 (6) 0 (6) 0 (8) 0 (8)
Respiratory system
Trachea 0.141 ± 0.0465 (6) 0 (6) 0 (8) 0 (8)
Lung 1.67 ± 0.552 (6) 0 (6) 0 (8) 0 (8)
Muscular system
Femoral muscle 0.601 ± 0.193 (6) 0 (6) 0 (8) 0 (8)
Tongue 0.719 ± 0.219 (6) 0 (6) 0 (8) 0.0291 ± 0.0282 (8)
Sense organs
Eyeball 0.0121 ± 0.0111 (6) 0 (6) 0 (8) 0 (8)
Skin 0.0854 ± 0.0844 (6) 0 (6) 0 (8) 0 (8)
Blood–vascular system
Heart 0.0330 ± 0.0317 (6) 0 (6) 0 (8) 0.0320 ± 0.0308 (8)
Aorta 0.0483 ± 0.0473 (6) 0 (6) 0 (8) 0 (8)
Other tissues (total) 0.402 ± 0.0537 (186) 0.0339 ± 0.0135 (199) 0.00173 ± 0.000735 (256) 0.00371 ± 0.00147 (244)
Body luids
Cerebrospinal luid 0 (6) 0 (6) 0 (8) 0 (8)
Bile 0 (6) 0 (6) 0 (8) 0 (8)
Hemocyte 0 (6) 0 (6) 0 (8) 0 (4)
clearly demonstrated that the half-life of DPAA in the brain was twice as long as that in other tissues except the emu-nctories, suggesting that DPAA easily accumulates in the brains of cynomolgus monkeys. Together with our pre-liminary observation that the half-life of DPAA in the rat brain after the administration of DPAA (at the same dose as this study) was shorter than that of cynomolgus mon-keys (<8.6 days; Masuda and Ishii, unpublished observa-tion), the indings suggest that DPAA may accumulate in
the brains of primates more easily than in the rodent brain. Previous experiments using rodents have shown that inor-ganic arsenic (iAs) can cross the blood–brain barrier (BBB; Rodríguez et al. 2005; Juárez-Reyes et al. 2009). Similarly to organic arsenic, DPAA was also detected in the CSF obtained from the residents of Kamisu who were exposed to DPAA (Ishii et al. 2014). Their CSF/serum ratios of DPAA were 3.7 and 3.0% at the irst and 14th days after their last exposure, respectively (Ishii et al. 2014). Consistent with
Fig. 2 Approximate curves showing the correlation between the days after the last administration of DPAA and the average concentrations of DPAA (ng As/g) in tissues of cynomolgus monkeys after the daily administration of DPAA (1.0 mg/kg/day) for 28 days. (Color igure online)
0 500 1000 1500
0 200 400
DPAA
(ng As/g
)
Days after administration
sciatic nerve
0 500 1000 1500
0 200 400
DPAA
(ng As/g
)
Days after administration
cervical spinal cord
0 500 1000 1500
0 200 400
DPAA
(ng As/g
)
Days after administration
thoracic spinal cord
0 500 1000 1500
0 200 400
DPAA
(ng As/g
)
Days after administration
lumbar spinal cord
0 500 1000 1500
0 200 400
DPAA
(ng As/g
)
Days after administration
upper brain stem
0 500 1000 1500
0 200 400
DPAA
(ng As/g
)
Days after administration
intermediate brain stem
0 500 1000 1500
0 200 400
DPAA
(ng As/g
)
Days after administration
lower brain stem
0 500 1000 1500
0 200 400
DPAA
(ng As/g
)
Days after administration
upper cerebellum
0 500 1000 1500
0 200 400
DPAA
(ng As/g
)
Days after administration
lower cerebellum
0 500 1000 1500
0 200 400
DPAA
(ng As/g
)
Days after administration
frontal lobe
0 500 1000 1500
0 200 400
DPAA
(ng As/g
)
Days after administration
parietal lobe
0 500 1000 1500
0 200 400
DPAA
(ng As/g
)
Days after administration
temporal lobe
0 500 1000 1500
0 200 400
DPAA
(ng As/g
)
Days after administration
occipital lobe
0 500 1000 1500
0 200 400
DPAA
(ng As/g
)
Days after administration hippocampus
0 500 1000 1500
0 200 400
DPAA
(ng As/g
)
Days after administration striatum
0 500 1000 1500
0 200 400
DPAA
(ng As/g
)
Days after administration cingulate gyrus
0 1000 2000 3000
0 200 400
DPAA
(ng As/g
)
Days after administration liver
0 1000 2000 3000
0 200 400
DPAA
(ng As/g
)
Days after administration gall bladder
0 1000 2000 3000
0 200 400
DPAA
(ng As/g
)
Days after administration kidney
0 50 100 150
0 200 400
DPAA
(ng As/g
)
Days after administration bladder
0 50 100 150
0 200 400
DPAA
(ng As/g
)
Days after administration testicle
0 50 100 150
0 200 400
DPAA
(ng As/g
)
Days after administration seminal vesicle
0 50 100 150
0 200 400
DPAA
(ng As/g
)
Days after administration epididymis
0 50 100 150
0 200 400
DPAA
(ng As/g
)
Days after administration prostate
0 50 100 150
0 200 400
DPAA
(ng As/g
)
0 50 100 150
0 200 400
DPAA
(ng As/g
)
Days after administration
uterus
0 50 100 150
0 200 400
DPAA
(ng As/g
)
Days after administration
vagina
0 50 100 150
0 200 400
DPAA
(ng As/g
)
Days after administration
esophagus
0 50 100 150
0 200 400
DPAA
(ng As/g
)
Days after administration
stomach
0 50 100 150
0 200 400
DPAA
(ng As/g
)
Days after administration
duodenum
0 50 100 150
0 200 400
DPAA
(ng As/g
)
Days after administration
small intestine
0 50 100 150
0 200 400
DPAA
(ng As/g
)
Days after administration
colon
0 50 100 150
0 200 400
DPAA
(ng As/g
)
Days after administration
rectal
0 50 100 150
0 200 400
DPAA
(ng As/g
)
Days after administration
pancreas
0 50 100 150
0 200 400
DPAA
(ng As/g
)
Days after administration
thymus
0 50 100 150
0 200 400
DPAA
(ng As/g
)
Days after administration
spleen
0 50 100 150
0 200 400
DPAA
(ng As/g
)
Days after administration
submandibular node
0 50 100 150
0 200 400
DPAA
(ng As/g
)
Days after administration
mesenteric node
0 100 200 300
0 200 400
DPAA
(ng As/g
)
Days after administration
parotid gland
0 100 200 300
0 200 400
DPAA
(ng As/g
)
Days after administration
submandibular gland
0 100 200 300
0 200 400
DPAA
(ng As/g
)
Days after administration
sublingual gland
0 100 200 300
0 200 400
DPAA
(ng As/g
)
Days after administration
lacrimal gland
0 50 100 150
0 200 400
DPAA
(ng As/g
)
Days after administration
adrenal gland
0 50 100 150
0 200 400
DPAA
(ng As/g
)
Days after administration
pituitary
0 100 200 300
0 200 400
DPAA
(ng As/g
)
Days after administration
thyroid
0 50 100 150
0 200 400
DPAA
(ng As/g
)
Days after administration
trachea
0 50 100 150
0 200 400
DPAA
(ng As/g
)
Days after administration
lung
0 50 100 150
0 200 400
DPAA
(ng As/g
)
Days after administration
femoral muscle
0 50 100 150
0 200 400
DPAA
(ng As/g
)
Days after administration
tongue
0 50 100 150
0 200 400
DPAA
(ng As/g
)
Days after administration
eyeball
0 50 100 150
0 200 400
DPAA
(ng As/g
)
Days after administration
skin
0 50 100 150
0 200 400
DPAA
(ng As/g
)
Days after administration
heart
0 50 100 150
0 200 400
DPAA
(ng As/g
)
Days after administration
aorta
these previous results, DPAA was detected in the CSF of cynomolgus monkeys in this study. The average CSF/serum ratio of DPAA in this study was 15.7% (5 days after the
last administration, n = 6). Thus, these results strongly sug-gest that DPAA may pass through the BBB of primates. This may be due to the hydrophobicity of DPAA (Weksler et al. 2005; Naranmandura et al. 2009). Also, the reduction in blood low and the cerebral metabolism was observed in the brains of the Kamisu residents who were exposed to DPAA (unpublished data). This evidence strongly suggests that the long presence of DPAA in the human brain may afect the brain function.
Several previous studies have shown that small amounts of iAs, monomethylarsenous acid (MMA) and dimethyl-arsinic acid (DMA) accumulated in the rat brain after the administration of iAs (Rodríguez et al. 2005, 2010; Juárez-Reyes et al. 2009). In humans, keratinization and pigmen-tation of the skin, peripheral neuropathy, skin cancer, and peripheral circulatory failure have all been reported as symptoms of chronic poisoning from exposure to inorganic arsenic compounds; however, there have been few reports on CNS symptoms (World Health Organization 2001). Pre-vious rodent studies have revealed that DPAA, an organic arsenic compound, accumulated in the rodent brain more easily than inorganic arsenic compounds (Naranmandura
et al. 2009; Ozone et al. 2010). Our study also
demon-strated that DPAA accumulated in the CNS tissues of pri-mates for a long period after its oral administration. These facts are consistent with our previous observations that the efects of DPAA on humans were substantially restricted to regions of the CNS such as the cerebellum and brain stem (Ishii et al. 2004). Furthermore, the cerebellar dysfunction found in the recent animal behavior experiments was quite similar to that observed in the Kamisu residents who were exposed to DPAA (Ozone et al. 2010; Negishi et al. 2013). Thus, it is highly likely that the efects of DPAA exposure on the CNS of Kamisu residents were caused by its long-term accumulation in the CNS.
It is known that when DPAA is administered to rats, it is excreted in the urine, feces, and hair (Naranmandura et al. 2009; Kobayashi and Hirano 2013). Although a high level of DPAA accumulation was seen in the liver, gallblad-der, and bile of cynomolgus monkeys at 5 days after the last DPAA administration, the half-lives of the DPAA in these tissues were as short as those in other tissues. Thus, as is the case with rats, DPAA is likely to be excreted in the liver, gallbladder, and bile of cynomolgus monkeys. While the concentration of DPAA in rat hair at 14 days after the last DPAA administration (at the same dose as this study) was high (Masuda and Ishii, unpublished observa-tion), moderate levels of DPAA and its metabolites were also detected in the skin with hair of cynomolgus monkeys at 5 days after the last DPAA administration in the present study. Thus, like the rat, it is highly likely that DPAA and its metabolites may be excreted in skin with hair in cyn-omolgus monkeys.
0 500 1000 1500
0 100 200 300 400
DPAA
(ng
As/g
)
Days after administration sciatic nerve
CNS
emunctories
other tissues *
*
* *
*
* *
*
Fig. 3 Approximate curves showing the correlation between the days after the last administration of DPAA and the average concentrations of DPAA (ng As/g) in tissue samples from the CNS, the emunctories, the sciatic nerve, and other tissues of cynomolgus monkeys after the daily administration of DPAA (1.0 mg/kg/day) for 28 days. The aver-age values ± SEM for each group are shown using horizontal lines. Purple, sciatic nerve; magenta, central nervous system; green, emu-nctories; blue, other tissues. *p < 0.0001, in comparison to the other tissues (the colors of the asterisks correspond to the group)
0 50 100
0 100 200 300 400
DPAA
(ng
As/g
)
Days after administration 1000
2000 3000
bile
hemocyte serum
cerebrospinal fluid
Table 3 PMAA concentration in cynomolgus monkeys after oral administration of DPAA
PMAA (ng As/g) after administration
Days 5 (average ± SEM) Days 29 (average ± SEM) Days 170 (average ± SEM) Days 339 (average ± SEM)
Central nervous system
Cervical spinal cord 0.592 ± 0.204 (6) 0.380 ± 0.177 (6) 0.229 ± 0.113 (8) 0.0304 ± 0.0294 (8)
Thoracic spinal cord 0.511 ± 0.254 (6) 0.416 ± 0.183 (6) 0.226 ± 0.0981 (8) 0.0272 ± 0.0262 (8)
Lumbar spinal cord 0.599 ± 0.284 (6) 0.387 ± 0.156 (6) 0.196 ± 0.100 (8) 0.0465 ± 0.0455 (8)
Brain stem 1.86 ± 0.460 (2) 1.61 ± 0.370 (3) 0.146 ± 0.145 (4) 0 (8)
Cerebellum 2.16 ± 1.29 (2) 0.741 ± 0.377 (4) 0.199 ± 0.0755 (6) 0.166 ± 0.165 (2)
Frontal lobe 1.54 ± 0.896 (2) 0.523 ± 0.312 (4) 0.0524 ± 0.0514 (6) 0 (8)
Parietal lobe 2.62 ± 1.20 (2) 0.515 ± 0.312 (4) 0.0690 ± 0.0689 (6) 0 (8)
Temporal lobe 0.497 ± 0.496 (2) 0.143 ± 0.142 (4) 0 (8) 0 (8)
Occipital lobe 0.813 ± 0.812 (2) 0.454 ± 0.264 (4) 0.0601 ± 0.0591 (6) 0 (8)
Central nervous system (total) 0.973 ± 0.184 (30) 0.523 ± 0.0899 (41) 0.139 ± 0.0299 (58) 0.0326 ± 0.0156 (36)
Peripheral nervous system
Sciatic nerve 0.0391 ± 0.0381 (6) 0.124 ± 0.123 (4) 0 (8) 0 (8)
Emunctories
Liver 3.77 ± 1.55 (6) 1.60 ± 0.430 (6) 0.0666 ± 0.0372 (8) 0.0762 ± 0.0437 (8)
Gall bladder 0.543 ± 0.329 (5) 0.112 ± 0.0639 (4) 0.0280 ± 0.0270 (8) 0.0225 ± 0.0215 (8)
Kidney 0.476 ± 0.244 (6) 0.285 ± 0.106 (6) 0.0608 ± 0.0598 (8) 0.0124 ± 0.0114 (8)
Emunctories (total) 1.66 ± 0.658 (17) 0.736 ± 0.235 (16) 0.0518 ± 0.0243 (24) 0.0371 ± 0.0170 (24)
Urogenital system
Bladder 0.181 ± 0.0911 (6) 0.0820 ± 0.0810 (4) 0 (8) 0 (8)
Testicle 0.228 ± 0.160 (5) 0 (8) 0 (8) 0 (8)
Seminal vesicle 0.145 ± 0.0953 (5) 0 (8) 0 (8) 0 (8)
Epididymis 0.0997 ± 0.0634 (5) 0 (8) 0 (8) 0 (8)
Prostate 0.180 ± 0.127 (5) 0 (8) 0 (8) 0 (8)
Ovary 0.0753 ± 0.0743 (4) 0.0683 ± 0.0673 (4) 0 (8) 0 (8)
Uterus 0.0722 ± 0.0712 (4) 0.0743 ± 0.0733 (4) 0 (8) 0 (8)
Vagina 0.0264 ± 0.0254 (4) 0.0912 ± 0.0902 (4) 0 (8) 0 (8)
Digestive system
Esophagus 0.178 ± 0.0935 (6) 0.0799 ± 0.0789 (4) 0 (8) 0 (8)
Stomach 0.168 ± 0.0837 (6) 0.0536 ± 0.0526 (4) 0 (8) 0 (8)
Duodenum 0.218 ± 0.107 (6) 0.152 ± 0.0683 (6) 0 (8) 0 (8)
Small intestine 0.211 ± 0.110 (6) 0.102 ± 0.0544 (6) 0 (8) 0 (8)
Colon 0.130 ± 0.0625 (6) 0.801 ± 0.711 (6) 0 (8) 0 (8)
Rectal 0.0699 ± 0.0689 (5) 0 (8) 0 (8) 0 (8)
Pancreas 0.278 ± 0.175 (6) 0.149 ± 0.107 (4) 0 (8) 0 (8)
Lymph system
Thymus 0.211 ± 0.140 (6) 0.0821 ± 0.0656 (4) 0 (8) 0 (8)
Spleen 0.267 ± 0.170 (6) 0.168 ± 0.106 (4) 0 (8) 0 (8)
Submandibular node 0.141 ± 0.0895 (6) 0.528 ± 0.403 (5) 0 (8) 0 (8)
Mesenteric node 0.0924 ± 0.0914 (5) 1.41 ± 1.12 (4) 0 (8) 0 (8)
Exocrine system
Parotid gland 0.178 ± 0.113 (6) 0.134 ± 0.0917 (4) 0 (8) 0 (8)
Submandibular gland 0.305 ± 0.207 (6) 0.168 ± 0.120 (4) 0 (8) 0 (8)
Sublingual gland 0.169 ± 0.108 (6) 0.105 ± 0.0703 (4) 0 (8) 0 (8)
Lacrimal gland 0.100 ± 0.0990 (5) 0 (8) 0 (8) 0 (8)
Endocrine system
Adrenal glands 0.434 ± 0.276 (6) 0.487 ± 0.415 (5) 0 (8) 0 (8)
In summary, we showed, for the irst time, that orally administered DPAA accumulated in the CNS tissues of primates. This inding could contribute to future studies to investigate the dynamics and metabolism of DPAA in humans.
Acknowledgements This work was supported by JSPS KAKENHI Grant Nos. JP20390039, JP16590811 and JP15K08148 from the pro-gram Grants-in-Aid for Scientiic Research of the MEXT, Japan, and a Grant-in-Aid for research on Study (toxic study group) of the Health Efects of DPAA supported by the Ministry of the Environment.
Authors’ contributions KI and AT designed the research; YS, TH, RT, TN, NI, YS, and TM performed the research; TM and KI ana-lyzed the data and wrote the paper.
Compliance with ethical standards
Conlict of interest The authors declare no conlicts of interest in association with the present study.
Open Access This article is distributed under the terms of the
Creative Commons Attribution 4.0 International License (http://
creativecommons.org/licenses/by/4.0/), which permits unrestricted use, distribution, and reproduction in any medium, provided you give appropriate credit to the original author(s) and the source, provide a link to the Creative Commons license, and indicate if changes were made.
References
Aposhian HV (1997) Enzymatic methylation of arsenic species and other new approaches to arsenic toxicity. Annu Rev Pharmacol
Toxicol 37:397–419. doi:10.1146/annurev.pharmtox.37.1.397
Hempel M, Daus B, Vogt C, Weiss H (2009) Natural attenuation potential of phenylarsenicals in anoxic groundwaters. Environ Sci Technol 43:6989–6995
Ishii K, Tamaoka A, Otsuka F, Iwasaki N, Shin K, Matsui A, Endo G, Kumagai Y, Ishii T, Shoji S, Ogata T, Ishizaki M, Doi M, Shimojo N (2004) Diphenylarsinic acid poisoning from chemical weapons in Kamisu, Japan. Ann Neurol 56:741–745. doi:10.1002/ana.20290
Ishii K, Itoh Y, Iwasaki N, Shibata Y, Tamaoka A (2014) Detec-tion of diphenylarsinic acid and its derivatives in human serum and cerebrospinal luid. Clin Chim Acta 431:227–231. doi:10.1016/j.cca.2014.01.029
Juárez-Reyes A, Jiménez-Capdeville ME, Delgado JM, Ortiz-Pérez D (2009) Time course of arsenic species in the brain and liver of mice after oral administration of arsenate. Arch Toxicol
83:557–563. doi:10.1007/s00204-008-0378-7
Kinoshita K, Shida Y, Sakuma C, Ishizaki M, Kiso K, Shikino O, Ito H, Morita M, Ochi T, Kaise T (2005) Determination of diphenylarsinic acid and phenylarsonic acid, the degradation products of organoarsenic chemical warfare agents, in well water by HPLC-ICP-MS. Appl Organomet Chem 19:287–293. doi:10.1002/aoc.789
Kobayashi Y, Hirano S (2013) The role of glutathione in the metab-olism of diphenylarsinic acid in rats. Metallomics 5:469–478. doi:10.1039/C2MT20228J
Kobayashi Y, Negishi T, Mizumura A, Watanabe T, Hirano S (2008) Distribution and excretion of arsenic in cynomolgus monkey The number between brackets indicates the number of samples examined
Table 3 (continued)
PMAA (ng As/g) after administration
Days 5 (average ± SEM) Days 29 (average ± SEM) Days 170 (average ± SEM) Days 339 (average ± SEM)
Thyroid 0.582 ± 0.406 (6) 0.858 ± 0.298 (6) 0 (8) 0 (8)
Respiratory system
Trachea 0.0563 ± 0.0355 (6) 0.0662 ± 0.0652 (4) 0 (8) 0 (8)
Lung 0.345 ± 0.157 (6) 0.177 ± 0.0610 (6) 0.0267 ± 0.0257 (8) 0 (8)
Muscular system
Femoral muscle 0.305 ± 0.133 (6) 0.101 ± 0.0802 (4) 0.0276 ± 0.0266 (8) 0 (8)
Tongue 0.197 ± 0.0872 (5) 0.143 ± 0.112 (4) 0.0716 ± 0.0574 (8) 0 (8)
Sense organs
Eyeball 0 (8) 0 (8) 0 (8) 0 (8)
Skin 0.431 ± 0.392 (6) 0 (8) 0 (8) 0 (8)
Blood–vascular system
Heart 0.217 ± 0.114 (6) 0 (8) 0 (8) 0 (8)
Aorta 0 (8) 0 (8) 0 (8) 0 (8)
Other tissues (total) 0.199 ± 0.0268 (186) 0.207 ± 0.0514 (145) 0.00462 ± 0.00205 (272) 0 (8)
Body luids
Cerebrospinal luid 0 (8) 0 (8) 0 (8) 0 (8)
Bile 0 (8) 0 (8) 0 (8) 0 (8)
Hemocyte 0 (8) 0.0161 ± 0.0151 (6) 0 (8) 0 (8)
following repeated administration of diphenylarsinic acid.
Arch Toxicol 82:553–561. doi:10.1007/s00204-007-0270-x
Kurata H (1980) Lessons learned from the destruction of the chemical weapons of the Japanese Imperial Forces. In: Chemical weap-ons: destruction and conversion. Stockholm International Peace Research Institute, London, pp 77–93
Naranmandura H, Suzuki N, Takano J, McKnight-Whitford T, Ogra Y, Suzuki KT, Le XC (2009) Systemic distribution and specia-tion of diphenylarsinic acid fed to rats. Toxicol Appl Pharmacol 237:214–220. doi:10.1016/j.taap.2009.03.023
Negishi T, Matsunaga Y, Kobayashi Y, Hirano S, Tashiro T (2013) Developmental subchronic exposure to diphenylarsinic acid induced increased exploratory behavior, impaired learning behavior, and decreased cerebellar glutathione concentration in rats. Toxicol Sci 136:478–486. doi:10.1093/toxsci/kft200
Ozone K, Ueno S, Ishizaki M, Hayashi O (2010) Toxicity and oxida-tive stress induced by organic arsenical diphenylarsinic acid and inorganic arsenicals and their efects on spatial learning ability in mice. J Health Sci 56:517–526. doi:10.1248/jhs.56.517
Rodríguez VM, Del Razo LM, Limón-Pacheco JH, Giordano M, Sánchez-Peña LC, Uribe-Querol E, Gutiérrez-Ospina G, Gon-sebatt ME (2005) Glutathione reductase inhibition and methyl-ated arsenic distribution in Cd1 mice brain and liver. Toxicol Sci 84:157–166. doi:10.1093/toxsci/ki057
Rodríguez VM, Limón-Pacheco JH, Carrizales L, Mendoza-Trejo MS, Giordano M (2010) Chronic exposure to low levels of inorganic arsenic causes alterations in locomotor activity and
in the expression of dopaminergic and antioxidant systems in the albino rat. Neurotoxicol Teratol 32:640–647. doi:10.1016/j. ntt.2010.07.005
Shibata Y, Tsuzuku K, Komori S, Umedzu C, Imai H, Morita M (2005) Analysis of diphenylarsinic acid in human and environ-mental samples by HPLC-ICP-MS. Appl Organomet Chem 19:276–281. doi:10.1002/aoc.792
Umezu T, Nakamiya K, Kita K, Ochi T, Shibata Y, Morita M (2012) Diphenylarsinic acid produces behavioral efects in mice rel-evant to symptoms observed in citizens who ingested polluted
well water. Neurotoxicol Teratol 34:143–151. doi:10.1016/j.
ntt.2011.08.007
Vahter M, Marafante E (1985) Reduction and binding of arsenate in marmoset monkeys. Arch Toxicol 57:119–124
Vahter M, Couch R, Nermell B, Nilsson R (1995) Lack of methyla-tion of inorganic arsenic in the chimpanzee. Toxicol Appl
Phar-macol 133:262–268. doi:10.1006/taap.1995.1150
Weksler BB, Subileau EA, Perrière N, Charneau P, Holloway K, Leveque M, Tricoire-Leignel H, Nicotra A, Bourdoulous S, Turowski P, Male DK, Roux F, Greenwood J, Romero IA, Cou-raud PO (2005) Blood–brain barrier-speciic properties of a human adult brain endothelial cell line. FASEB J 19:1872–1874. doi:10.1096/j.04-3458je
World Health Organization (2001) International Programme on Chemical Safety, Environmental Health Criteria 224: Arsenic
and arsenic compounds, 2nd ed. Geneva. http://whqlibdoc.who.