Article
Does Firms’ Innovation Promote Export Growth
Sustainably?—Evidence from Chinese
Manufacturing Firms
Liangfeng Hao *, Bin Qiu and Lisette Cervantes
School of Economics and Management, Southeast University, Nanjing 210000, China; [email protected] (B.Q.); [email protected] (L.C.)
* Correspondence: [email protected]; Tel.: +86-25-5209-0719
Academic Editors: Hongbo Liu, Sizhong Sun and Iain Gordon
Received: 22 September 2016; Accepted: 9 November 2016; Published: 15 November 2016
Abstract:Recent theoretical analysis and empirical studies have emphasized that firms’ innovation could significantly improve export growth. However, the positive effect of innovation on exports is likely to change due to unstable domestic offsetting for innovation and increasing worldwide competition for trade. This study aims to explore the dynamic link between them. We first develop a theoretical model between innovation and export growth based on the theory of heterogeneity. Export growth is measured through the dimensions of extensive margin and intensive margin so as to better investigate the effect of innovation on export performance. The propositions of mechanism analysis reveal that the effect of innovation on exports is non-linear rather than sustainable. An empirical study is followed to test the propositions by using data from a representative panel of Chinese manufacturing firms. Consistent with the theoretical predictions, the results show an inverted U-shaped relationship between innovation and extensive margin and a U-shaped relationship between innovation and intensive margin. The non-linear relations are verified by a threshold effect test. Further study shows less innovation and more firms on the left side of the relation curves. The distribution suggests irregular innovation ability among the exporters. Moreover, the role of innovation is more important for export growth and the corresponding threshold is higher in terms of high technological sectors. The contribution of this study is to introduce a comprehensive framework to investigate the dynamic effect of innovation on export growth, serving as a modest spur to induce the following studies to explore the sustainability of innovation effect.
Keywords:innovation; export growth; sustainability; threshold effect
1. Introduction
The theory of economic growth reveals that the economy could achieve sustainable growth without external forces due to the endogenous promotion effect of innovation progress. For economic growth, the role of exporting is becoming more and more important with the advance of economic globalization. Plentiful studies have revealed the positive effect of innovation on export growth. However, most of the literature just focused on the promoting impact rather than the sustainable effect of innovation. This study aims to introduce a comprehensive framework for how innovation affects export growth dynamically. In our study, the extensive margin and intensive margin of export growth are measured at the firm level, where the extensive margin is represented by the new entry of a firm to the international market, and the intensive margin is represented by the increasing scale of exporters [1,2]. The theoretical analysis is developed on the work by Butos [3] and Caldera [4] that predicted that innovative firms are more likely to export. The propositions of this study show that there is a non-linear relationship between innovation and export growth, where the relationship
between innovation and extensive margin is an inverted U shape; meanwhile, the relationship between innovation and intensive margin is U shaped. Empirical work is followed to test the predictions from a representative panel of Chinese manufacturing firms over the period 2001–2009 using a Heckman model. Different from the results of previous studies, wherein firms’ innovation can positively and sustainably affect the export growth, we found a non-linear relationship between innovation and exports, which is in line with the theoretical predictions. The fact that firms’ innovation cannot sustainably promote export growth can be explained by insufficient intellectual property protection, which is likely to increase the innovation risk due to the imitative threat from others. The U-shaped relationship between innovation and intensive margin suggests that there is a threshold to increase the export scale. The result is verified by a threshold test. The synergistic effect of innovation and productivity on export growth is significant and positive, indicating that innovation can promote export growth through improving firms’ productivity. The statistics of firms based on the inflection point shows less innovation and more firms on the left side of the relation curves. This distribution shows a low innovation level and uneven innovation ability among exporters.
This study also investigates the effect of innovation on export growth across sectors. Sectors are divided into high technological and low technological firms according to the innovation intensity. According to the different dependence of technology among sectors, the effect of innovation on export growth is irregular. Firms with higher technology tend to innovate for improving the product quality with respond to the demand of developing countries. For higher technological sectors, firms’ innovation can positively improve the extensive margin of exports for a wider interval; meanwhile, the threshold of intensive margin for high-tech sectors is comparatively higher.
2. Literature Review
The first strand of the literature examines the link between innovation and exports. The relationship is supported by previous theoretical studies. International trade theories differ in their predictions as to how innovation increases the dual margins of export growth in the following two aspects. First, innovation can introduce new products into the international market or diversify the commodities used for trade, which can promote the extensive margin of export growth (Krugman [5], Grossman et al. [6]); second, innovation can increase the quantity of exports by increasing firms’ productivity (Eaton et al. [7,8]) or improving product quality (Grossman et al. [9]), which can increase the intensive margin of export growth. Innovation could affect productivity, leading to heterogeneity. In the models of Yeaple [10], Aw et al. [11,12], Butos [3], and Caldera [4], a firm’s productivity could be improved by innovation, which can increase the firms’ export success. However, the theories focused more on the relationship between innovation and export decisions rather than the relationship between innovation and export scale (Basile [13]; Wagner [14]). In addition, the promotion effect of innovation on exports in previous studies is considered as sustainable rather than dynamic. The contribution of the current paper is to introduce a comprehensive framework to investigate the dynamic relationship between innovation and export growth, both from the perspectives of extensive margin and intensive margin.
Imbriani et al. [19] observed a positive-quality effect and a strong impact of non-technological innovations over future exports brought by product innovation. Cassiman et al. [20] showed that the strong positive association between productivity and exports is related to firms’ earlier product innovation. Lachenmaier et al. [21], Bartel et al. [22], and Becker et al. [23] demonstrated that firms’ innovation can help the firms to exploit revenue gains from exports and emphasize that both product innovation and process innovation could stand for the promotion of productivity and exports. Further studies suggest that product innovation plays a more important role than process innovation in trade-oriented countries [24–26]. In particular, some studies reveal that the effect of innovation on exports is insufficient or moderate. Jakob [27] found that R&D stock is not influential for exports and domestic patents had substantially lower effects on exports than external patents. Damijan et al. [28] considered that proving a direct link from innovation through higher productivity into export was not an easy task. Yi et al. [29] held the view that the effect of innovation on exports was moderate, conditioned by institutional forces such as foreign ownership, business group affiliation, and the degree of regional marketization. However, the positive or negative effect of innovation on exports is probably dynamic rather than constant. This study contributed to the exploration based on data from Chinese manufacturing firms.
The third strand of the literature concentrates on the decomposition of export growth. According to previous studies, the breadth of exports represents the extensive margin, and the depth of exports represents the intensive margin [30]. Hummels et al. [31] took the lead in investigating the decomposition of export growth through product categories, revealing that larger economies export a wider set of goods (extensive margin) and richer countries export high quantities (intensive margin) at modestly higher prices. Felbermayr et al. [32] proposed a gravity model to explore the export growth on both margins, in which the results showed that technological improvements in transport and communication as well as GATT or WTO membership can be explained for “distance puzzle”, partially in line with the results drawn by Dutt et al. [33]. Helpman et al. [34] explored the impact of trade frictions on trade flows, where the extensive margin refers to the trade volume per exporter and the intensive margin refers to the number of exporters. Besedeš et al. [35] claimed that developing countries had greater instability in terms of extensive margin. The consistent findings of Felbermayr et al. [32], Helpman et al. [34] and Besedeš et al. [35] revealed that the majority of the growth in trade was due to the intensive margin rather than the extensive margin. Focusing on Chinese industrial enterprises, Chen [36] argued that innovation played a positive role in promoting extensive and intensive export margins at a macro level. However, most of the studies just measured the dual margins of export growth at the country level, ignoring the effect of key factors on firms’ export growth. The contribution of this study is to introduce a firm’s innovation into the heterogeneity theory framework to explore the impact of innovation on the dual margins of export growth, both from the perspectives of theoretical analysis and empirical progress.
The remainder of the study is organized as follows. Section3presents the mechanisms analysis. Section4gives data for Chinese manufacturing firms and introduces the Heckman model to correct the sample selection bias. Section5presents an empirical strategy to estimate the effect of innovation on firms’ export growth and launches the robustness check by threshold test. Section6is the conclusion.
3. Mechanisms Analysis
3.1. Profit Function
3.1.1. Demand
The demand of our framework is modeled on the standard setup used in recent trade studies (e.g., [1,2]). Demand is characterized by a representative consumer with CES preferences over a continuum of varietiesiof a goodq:
U=
N Z
0
q(i)ρdi
1/ρ
, where 0<ρ<1 and i∈(0, N) (1)
In line with the studies, it is assumed that consumers maximize their utility subject to the budget constraint:
Z N
0 p(i)q(i)di=E (2)
The demand for a product follows constant elasticity of substitutionσ, which equals 1/(1−ρ) > 1. Total demand for varietyican then be written as:
q(i) = E P(
p(i) P )
−σ
, (3)
whereP= [ N
R
0 p(i)
(1−σ) di]
1 1−σ
is the price index.
3.1.2. Supply
The supply side of the economy is characterized by a monopolistically competitive industry, where each firm produces a single varietyiof goodq. As proposed by Melitz [1], firms need to draw their productivity from a known Pareto cumulative distribution functionG(ψ) =1−ψ-kwithk> 1. The profit maximizing price (pI) is a constant markup over marginal costc
Iwith CES preferences, expressed more formally as:
pI(ϕi) = 1
ρ
cI
ϕi
. (4)
We can draw the revenue from Equations (3) and (4):
r(ϕi) =p(ϕi)q(ϕi) =Ei
Pρϕi
ci σi−1
. (5)
Then the profit function is
πI(ϕi) = 1
σr
I(ϕ i)−
Z
d fiI, (6)
in whichdfiIindicates the marginal cost of innovation.
3.2. Innovation and Export Growth
3.2.1. Extensive Margin
A firm will export if the profits from the domestic and foreign market are jointly larger than the profit from serving only the domestic market:
πI(ϕi) +π∗I(ϕi)>πI(ϕi) (7)
"
τ1−σj∗E∗ j(I=0)
Pj∗ρ∗jσ
∗ j−1 1
σj∗ϕ
σ∗ j−1 i(I=0)
#
c1i(−I=σj∗0)> fix (8)
"
τ1−σ∗jE∗
j(I=1)(Pj∗ρ∗j) σj∗−1 1
σj∗ϕ
σ∗ j−1 i(I=1)
#
c1i(−I=σj∗1)− Z
d fi(I=1)> fix. (9)
We follow the hypothesis that investment in innovation could bring about more net profit than non-innovation:
"
τ1−σj∗∆E∗
j(I=1)(Pj∗ρj∗)σj
∗−1 1
σj∗
∆ϕσj∗−1 i(I=1)
# ∆c1−σj∗
i(I=1)>∆fi(I=1). (10)
Since there is an interactive promoting effect between innovation and export growth, the exporting experience could enhance the innovative capacity, while in turn the innovation behavior could improve the export growth [15,17]. As a result of the circulation cumulative causal effect, the productivity of an innovator is higher than the productivity of a non-innovator (ψI=1>ψI=0), while the marginal costs are correspondingly lowercI=1<cI=0. As innovation can improve the quality and variety of product, E*I=1>E*I=0. Comparing Equations (8) and (9), firms will choose to innovate for export. The preference type of investors is assumed to be risk aversion. The innovation risk is increasing due to the financial restraints and imitative threat from other producers. If the expense of innovation is so high that the marginal benefit from innovation cannot make up the marginal cost, the effect turns negative. Thus we can draw up a proposition (Proposition1):
Proposition 1. There is an inverted U-shaped relationship between innovation and extensive margin of export growth.
3.2.2. Intensive Margin
When it comes to intensive margin, we can draw the profit formula from Equations (5)–(7):
πI(ϕi) +πj∗I(ϕi) = 1
σEIi(PρϕIi)
σ−1c1−σ Ii −
Z
d fI+τ1−σj∗EIij∗(Pj∗ρ j∗)σj
∗−1 1
σj∗c 1−σj∗ Ii ϕ
σj∗−1
Ii −fx (11)
To obtain the profit maximization, we take the derivative of productivityϕiI:
σ−1
σ EIi(Pρ)
σ−1ϕ
Iiσ−2c1Ii−σ+τ1−σj
∗
EIij∗(Pj∗ρj∗)σj
∗−1σj∗−1
σj∗ c 1−σj∗ Ii ϕ
σj∗−2
Ii =0 (12)
Then the formula can be changed into:
eij∗ =
σ−1 σ (Pρ)
σ−1
h σ−1
σ (Pρ) σ−1
−τ1−σj∗(P j∗ρj∗)σj
∗−1σj∗−1 σj∗ c
σ−σj∗ Ii ϕ
σj∗−σ Ii
i, (13)
in which eij∗ is the proportion of foreign consumption. We can conclude that eij∗ depends on cσIi−σ∗ϕIiσ∗−σfrom the equation. According to the expressions of∂∂ecij∗
iI and ∂eij∗ ∂ϕiI, ifσj
*>σ, then ∂eij∗ ∂ci(I=1) <0, ∂eij∗
∂ϕi(I=1)
> 0; ifσ >σj*, then ∂eij ∗
∂ci(I=1)
> 0, ∂eij ∗
∂ϕi(I=1)
< 0. An exporter’s innovation is likely to improve
the productivity and reduce the marginal cost, which is represented by ∂ci(I=1) ∂(I=1) < 0,
∂ϕi(I=1) ∂(I=1) > 0.
Meanwhile, there are relations of∂(∂Ie=ij∗1) = ∂eij∗ ∂ci(I=1)
∂ci(I=1) ∂(I=1),
∂eij∗ ∂(I=1) =
∂eij∗ ∂ϕi(I=1)
∂ϕi(I=1)
∂(I=1). Therefore, ifσj*>σ, then ∂(∂Ie=ij∗1) > 0; while ifσ > σj*, then ∂eij
∗
∂(I=1) < 0. It is suggested that investment in innovation
comparatively larger, leading to a reduction in firms’ export scale. Conversely, if the foreign product elasticity of substitution is comparatively larger, the investment in innovation is likely to meet the diversified foreign demand, leading to improve the export scale. It shows a U-shaped relationship, especially in cases where the requirement for innovation investment is larger to meet the diversified foreign demand with higher product elasticity of substitution. Thus, we can form another proposition (Proposition2):
Proposition 2. There is a U-shaped relationship between innovation and intensive margin.
4. Data and Modeling
4.1. Data
This study uses Chinese industrial enterprise database over the period 2001–2009 compiled by the National Bureau of Statistics (NBS). This dataset provides an appropriate random sample of Chinese industrial firms. The dataset is representative as it consists of more than 90% of manufacturing firms and provides plentiful information for this study. Firstly, it allows for tracing the firms’ innovation and export performance over time; secondly, there is a large sample of firms distributed over different regions in China; thirdly, it includes many items that can affect firms’ export behavior, such as the value of new products, firms’ ages, number of employees, value of tax, accounts receivable ratios, and so on; fourth, it covers different sectors defined at the two-digit level in the ISIC rev.4 classification. After cleaning up unlikely values, large spikes, and missing values, the unbalanced panel of firms includes on average 495,763 firms with a total number of 1,144,415 observations over the period 2001–2009. The summary statistics of innovators and exporters is described in more detail in AppendixA.
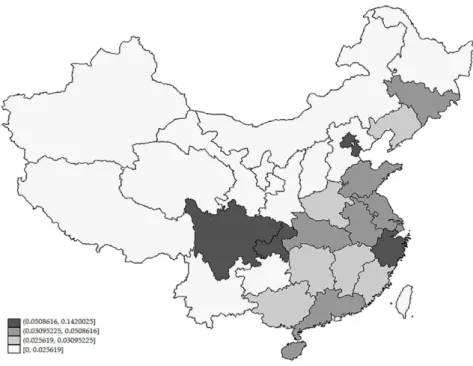
Figures1and2are the spatial distributions of exporters and innovators, where the darker color indicates a larger number of exporters and innovators in different regions. The result shows that exporters and innovators are concentrated in eastern regions, including Beijing, Tianjin, Shandong, Jiangsu, Zhejiang, Guangdong, and other coastal areas, while in the midwestern area the strength of exports and innovation are comparatively weak. Although the innovation level in Chongqing and Sichuan is comparatively higher, there is a smaller export share due to the fact that the location is far from the seaports; meanwhile, less direct foreign investment reduces the export scale to a certain extent.
Figure 2.The spatial distribution of innovators.
4.2. Modeling
The use of OLS estimates may lead to measurement bias since it was found that among the observed values, 63.73 percent of export delivery value is 0. To minimize the bias, following Helpman et al. [34], a Heckman selection model is used to correct the sample selection bias. The model, using a comprehensive study of exporting decision and exporting scale, can better investigate the relationship among innovation and dual margins of export growth simultaneously.
According to Figures3and4, there is a quadratic nonlinear relationship between innovation and exports. Based on the theoretical propositions and numerical simulations, the Heckman model is set as follows:
Pr(EMit|Zit−1) =αinnoit−1+βinnoit−12+δlnTFPit−1+θinnoit−1×lnTFPit−1+γZit−1 +ϕexportit−1+ρj+ωt+κj+ei
(14)
E(I Mit|EM =1) =αinnoit−1+βinnoit−12+δlnTFPit−1+θinnoit−1×lnTFPit−1+γZit−1 +ηλ+ρj+ωt+κj+ei
(15)
innoit-1* TFPit-1to measure the synergistic effect on exports since Bernard et al. [42] highlighted that, compared to non-exporters, exporters display higher productivity.
Zit-1indicates the other control variables that affect the exporting performance, such as a firm’s experience (Agnihotri et al. [43]), a firm’s size (Serrasqueiro et al. [44]), the regional institution factor (Rasiah [45]), financial restrictions (Riding et al. [46]), as well as a firm’s location (Freeman et al. [47]). In this model, the age measures a firm’s experience in terms of the number of years since the establishment of the firm. The number of employees is used to measure a firm’s size. The value of tax reflects the institutional factor in different regions and the receivable accounts ratio measures the financial restrict. The distance from the nearest seaport is used to measure the effect of a firm’s location on exports. This study also introduces the National Geographic Concentration index of 284 cities concerning the effect of industrial agglomeration on exports (Long et al. [48]). All the explanatory variables are one year lagged to reduce the endogeneity concerning the mutual effects among exports and other variables. Table1gives the descriptive statistics of the variables. In addition, Faustino et al. [49] suggested that exports in the previous period held a positive effect on contemporaneous exports, confirming the sunk cost hypothesis for exports (Robert et al. [50]). Therefore, we introduceExportit-1 to measure the export trend. Fixed effects are controlled by generating regional dummies, industrial dummies, and year dummies. Moreover, we deal with the corresponding index deflator using the consumer price index, producer price index, raw materials, fuel and power purchase price indices, and the price index of investment in fixed assets so as to eliminate the error caused by price factors. The basic year is 2000.
− −
− − − −
Figure 3.The numerical simulation between innovation and extensive margin of export growth.
− −
− − − −
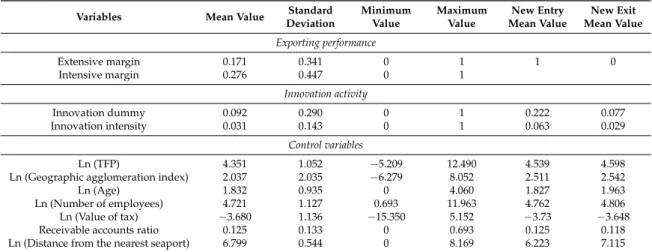
Table 1.The descriptive statistics of variables.
Variables Mean Value Standard
Deviation
Minimum Value
Maximum Value
New Entry Mean Value
New Exit Mean Value
Exporting performance
Extensive margin 0.171 0.341 0 1 1 0
Intensive margin 0.276 0.447 0 1
Innovation activity
Innovation dummy 0.092 0.290 0 1 0.222 0.077
Innovation intensity 0.031 0.143 0 1 0.063 0.029
Control variables
Ln (TFP) 4.351 1.052 −5.209 12.490 4.539 4.598
Ln (Geographic agglomeration index) 2.037 2.035 −6.279 8.052 2.511 2.542
Ln (Age) 1.832 0.935 0 4.060 1.827 1.963
Ln (Number of employees) 4.721 1.127 0.693 11.963 4.762 4.806
Ln (Value of tax) −3.680 1.136 −15.350 5.152 −3.73 −3.648
Receivable accounts ratio 0.125 0.133 0 0.693 0.125 0.118
Ln (Distance from the nearest seaport) 6.799 0.544 0 8.169 6.223 7.115
The statistics are from a Chinese industrial firms’ database for the years 2001–2009. A new entry means that non-exporters enter into the international market. A new exit means that exporters exit the international market.
5. Empirical Results
In this section we define the empirical approach to test the main prediction of the theoretical model.
5.1. Baseline Regression Results for Innovation and Exports
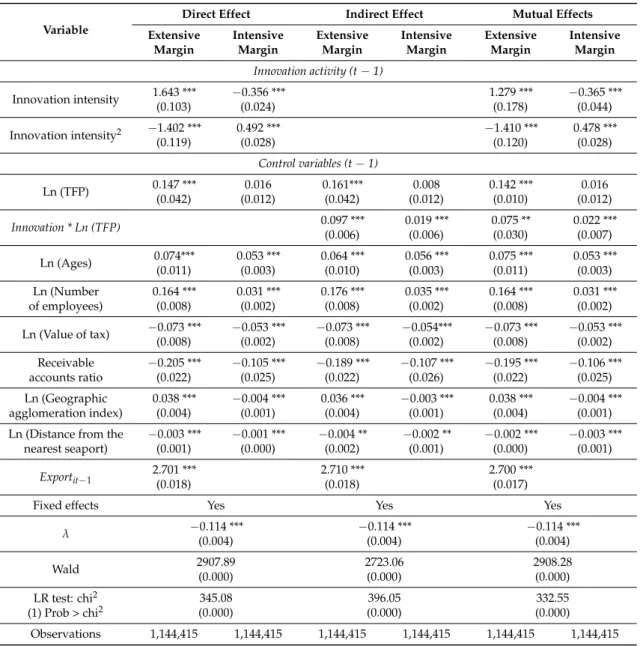
Table2presents the baseline results obtained through estimation using the Heckman model after controlling for the fixed effects. The LR testp-value and Waldp-value are zero, which proves that the Heckman method is suitable and significant. The first column inspects the direct impact of innovation on dual margins of exports without controlling the interaction term ofinnovation * log TFP. The monomial coefficient of innovation against extensive margin is positive, while the monomial coefficient of the intensive margin is negative. Meanwhile, the quadratic term of extensive margin is negative, and the quadratic term of intensive margins is positive. The results suggest that there is a non-linear inverted U-shaped relationship between innovation and extensive margin, whereas there is a non-linear U-shaped relationship between innovation and intensive margin. The second column inspects the indirect impact of innovation on dual margins of export growth. The interaction terms of innovation andTFPare significantly positive for extensive margin and intensive margins. This is suggestive of the fact that the relationship between innovation and exports runs through productivity just because innovative firms become more productive. The third column inspects the mutual effects, which are in line with the results drawn above. The effect of productivity is insignificant in terms of intensive margin of exports. It suggests that exporters try to improve the quality and sophistication of products to increase the exporting scale rather than improve the technical efficiency to a certain extent [51,52].
terms of export growth [47]. Finally, the positive and significant estimate onExportit–1proved the positive effect on contemporaneous exports [49,50].
Table 2.Effect of innovation on export growth.
Variable
Direct Effect Indirect Effect Mutual Effects
Extensive Margin Intensive Margin Extensive Margin Intensive Margin Extensive Margin Intensive Margin
Innovation activity (t−1)
Innovation intensity 1.643 *** (0.103)
−0.356 *** (0.024)
1.279 *** (0.178)
−0.365 *** (0.044)
Innovation intensity2 −1.402 *** (0.119) 0.492 *** (0.028) −1.410 *** (0.120) 0.478 *** (0.028)
Control variables (t−1)
Ln (TFP) 0.147 *** (0.042) 0.016 (0.012) 0.161*** (0.042) 0.008 (0.012) 0.142 *** (0.010) 0.016 (0.012)
Innovation * Ln (TFP) 0.097 ***
(0.006) 0.019 *** (0.006) 0.075 ** (0.030) 0.022 *** (0.007)
Ln (Ages) 0.074*** (0.011) 0.053 *** (0.003) 0.064 *** (0.010) 0.056 *** (0.003) 0.075 *** (0.011) 0.053 *** (0.003) Ln (Number of employees) 0.164 *** (0.008) 0.031 *** (0.002) 0.176 *** (0.008) 0.035 *** (0.002) 0.164 *** (0.008) 0.031 *** (0.002)
Ln (Value of tax) −0.073 *** (0.008)
−0.053 *** (0.002)
−0.073 *** (0.008)
−0.054*** (0.002)
−0.073 *** (0.008)
−0.053 *** (0.002) Receivable accounts ratio −0.205 *** (0.022) −0.105 *** (0.025) −0.189 *** (0.022) −0.107 *** (0.026) −0.195 *** (0.022) −0.106 *** (0.025) Ln (Geographic agglomeration index) 0.038 *** (0.004) −0.004 *** (0.001) 0.036 *** (0.004) −0.003 *** (0.001) 0.038 *** (0.004) −0.004 *** (0.001)
Ln (Distance from the nearest seaport)
−0.003 *** (0.001)
−0.001 *** (0.000)
−0.004 ** (0.002)
−0.002 ** (0.001)
−0.002 *** (0.000)
−0.003 *** (0.001)
Exportit−1 2.701 ***(0.018) 2.710 ***(0.018) 2.700 ***(0.017)
Fixed effects Yes Yes Yes
λ −0.114 ***
(0.004) −0.114 *** (0.004) −0.114 *** (0.004) Wald 2907.89 (0.000) 2723.06 (0.000) 2908.28 (0.000)
LR test: chi2 (1) Prob > chi2
345.08 (0.000) 396.05 (0.000) 332.55 (0.000)
Observations 1,144,415 1,144,415 1,144,415 1,144,415 1,144,415 1,144,415
*** and ** indicate significance at the 1% and 5% level. Robust standard errors are reported in parentheses.
5.2. Regression Results for Innovation and Exports in Different Technological Sectors
Regarding the technological dependence of various sectors, the effects of innovation on export growth are irregular. For example, the manufacture of computer, electronic, and optical products requires more technological expertise than the manufacture of textiles for export.
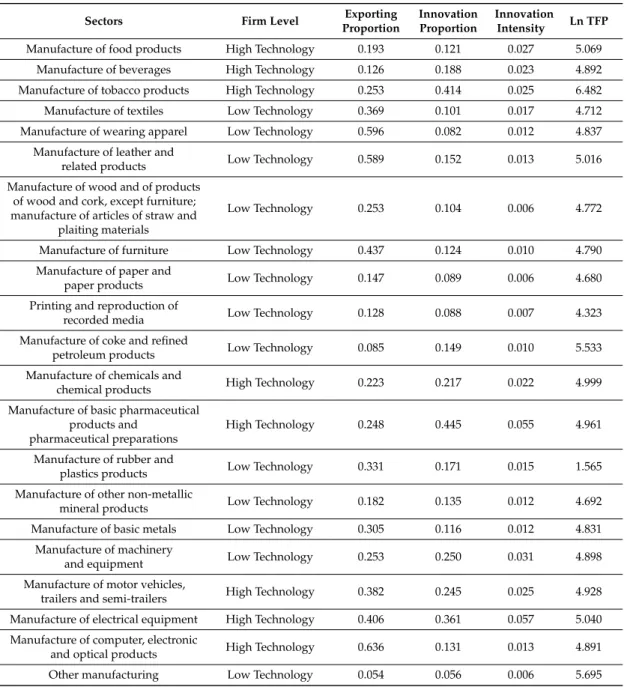
As shown in AppendixB, TableB1shows the statistics of innovation and export patterns by sector, as defined at the two-digit level in the ISIC rev.4 classification. In general, the number of low-technology sectors is larger, indicating that the innovation intensity of Chinese manufacturing firms is insufficient.
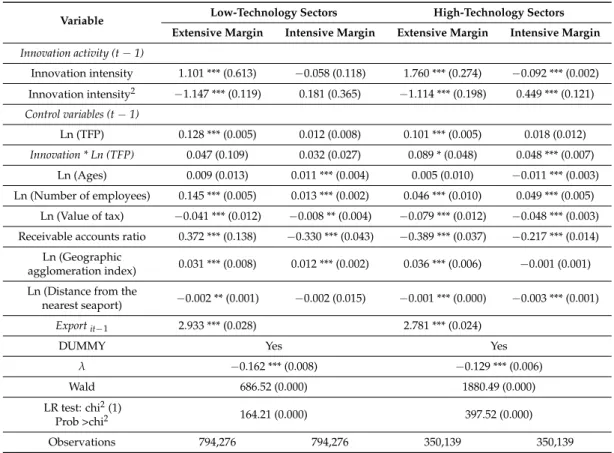
calculation. Different from the extensive margin, both the monomial and quadratic coefficients are insignificant for intensive margin, indicating that there is no direct relationship between innovation and export scale. In addition, the interactive effects between innovation and productivity are not significant, due to the dependence on the endowment of resources for lower technology sectors that require less technological content.
For high-tech sectors, the monomial and quadratic coefficients of innovation are significant for both extensive margin and intensive margin. In terms of intensive margin, the monomial coefficient is negative and the quadratic coefficient is positive, consistent with the baseline regression results drawn above. According to the coefficients of intensive margin, the inflection point of the inverted U-shaped relationship is 0.79, which is larger than the value of the baseline regression result; correspondingly, the inflection point of the U-shaped relationship is 0.45, which is also larger than the value drawn above. The comparison suggests that, for high-tech sectors, innovation can improve the extensive margin of exports for a wider interval; meanwhile the threshold for intensive margin is higher, indicating that innovation plays a more important role in technological sectors that require greater product diversification and sophistication [36,53,54].
Table 3.Effect of innovation on export growth in different technological sectors.
Variable Low-Technology Sectors High-Technology Sectors
Extensive Margin Intensive Margin Extensive Margin Intensive Margin
Innovation activity (t−1)
Innovation intensity 1.101 *** (0.613) −0.058 (0.118) 1.760 *** (0.274) −0.092 *** (0.002)
Innovation intensity2 −1.147 *** (0.119) 0.181 (0.365) −1.114 *** (0.198) 0.449 *** (0.121) Control variables (t−1)
Ln (TFP) 0.128 *** (0.005) 0.012 (0.008) 0.101 *** (0.005) 0.018 (0.012) Innovation * Ln (TFP) 0.047 (0.109) 0.032 (0.027) 0.089 * (0.048) 0.048 *** (0.007)
Ln (Ages) 0.009 (0.013) 0.011 *** (0.004) 0.005 (0.010) −0.011 *** (0.003) Ln (Number of employees) 0.145 *** (0.005) 0.013 *** (0.002) 0.046 *** (0.010) 0.049 *** (0.005)
Ln (Value of tax) −0.041 *** (0.012) −0.008 ** (0.004) −0.079 *** (0.012) −0.048 *** (0.003) Receivable accounts ratio 0.372 *** (0.138) −0.330 *** (0.043) −0.389 *** (0.037) −0.217 *** (0.014)
Ln (Geographic
agglomeration index) 0.031 *** (0.008) 0.012 *** (0.002) 0.036 *** (0.006) −0.001 (0.001)
Ln (Distance from the
nearest seaport) −0.002 ** (0.001) −0.002 (0.015) −0.001 *** (0.000) −0.003 *** (0.001) Exportit−1 2.933 *** (0.028) 2.781 *** (0.024)
DUMMY Yes Yes
λ −0.162 *** (0.008) −0.129 *** (0.006)
Wald 686.52 (0.000) 1880.49 (0.000)
LR test: chi2(1)
Prob >chi2 164.21 (0.000) 397.52 (0.000)
Observations 794,276 794,276 350,139 350,139
***, ** and * indicate significance at the 1%, 5% and 10% level. Robust standard errors are reported in parentheses.
5.3. Threshold Effect Test
The non-linear relationships between innovation and export growth could be examined by a threshold test by constructing balanced panel data. The multiple threshold model of Hansen [55] could be written as:
yit =ui+β1xitI(qit≤γ1) +β2xitI(γ1<qit ≤γ2) +β3xitI(qit≥γ2) +eit (16)
The random disturbance termeitis assumed to be independent and identically distributed with zero and finite varianceσ2. In our model, the threshold variable is set as the lagged productivity because firms’ innovation behavior could affect the export performance through heterogeneous productivity. The threshold value is estimated as ˆγ=argminS1(γ), whereS1(γ)indicates the sum of squared errors.
5.3.1. Testing for Threshold
According to the model of Hansen [55], the significance of threshold and the number of thresholds could be determined by bootstrap estimation of the asymptoticp-value. In terms of extensive margin of exports, we find that the test for a single threshold is significant, with a bootstrapp-value of 0.05. On the other hand, the tests for the double and third thresholds are not close to being statistically significant, with a bootstrapp-value of 0.68 and 0.88, respectively. We conclude that there is strong evidence that there is a single threshold in the regression relationship. Correspondingly, the threshold for intensive margin of exports is single too.
To test the validity of the threshold value, Hansen [55] argued that the best way to form confidence intervals forγis to use the likelihood ratio, whereLR1(γ) = (S1(γ)−S1(γˆ))/ ˆσ2. A test of H0:γ=γ0 is rejected at asymptotic levelαifLR1(γ0)exceedsc(α), wherec(α) =−2log 1−√1−α. It is easy to
calculate that the 10% critical value is 6.53, the 5% is 7.35, and the 1% is 10.59. Referring to the value of LR1(γ)and the simulation of the single threshold test shown in AppendixC, the thresholds are proved to be statistically valid.
5.3.2. Threshold Estimation
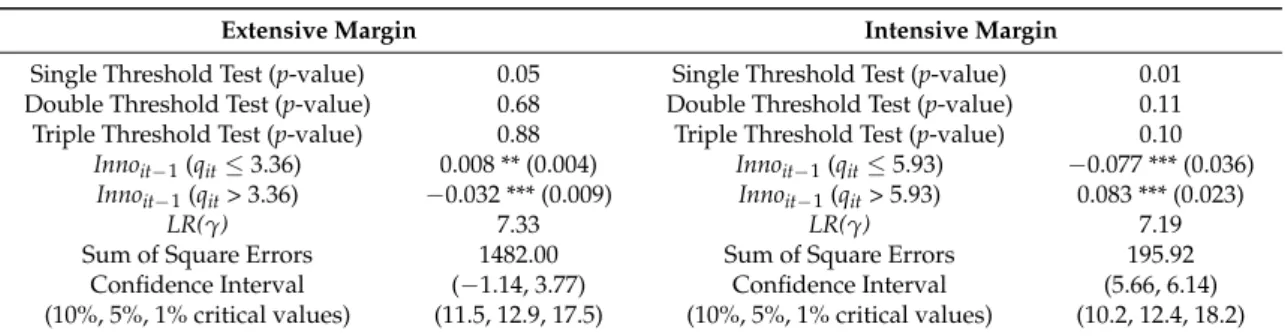
Table4is the result of threshold estimation between innovation and export growth. According to the threshold test, it is suggested that there is a non-linear relationship between innovation and extensive margin, characterized by a single threshold value of 3.36. The confidence interval is (−1.14, 3.77). According to the coefficients of innovation, whenq≤3.36, the impact of innovation on extensive margin is significantly positive. Whenq> 3.36, the effect turns negative. The relationship is in line with the result drawn by the Heckman method.
In terms of intensive margin, there is a non-linear relationship characterized by a single threshold value, 5.93. The confidence interval is (5.66, 6.14). According to the coefficients of innovation, ifq ≤5.93, innovation constraints the growth of export scale, while ifq> 5.93, it is conducive to innovation. The estimation processed by the threshold test is in favor of the conclusions drawn by the Heckman method. In conclusion, the non-linear relationships between innovation and export growth appear to be robust.
Table 4.Effect of innovation on export growth based on threshold test.
Extensive Margin Intensive Margin
Single Threshold Test (p-value) 0.05 Single Threshold Test (p-value) 0.01
Double Threshold Test (p-value) 0.68 Double Threshold Test (p-value) 0.11
Triple Threshold Test (p-value) 0.88 Triple Threshold Test (p-value) 0.10
Innoit−1(qit≤3.36) 0.008 ** (0.004) Innoit−1(qit≤5.93) −0.077 *** (0.036)
Innoit−1(qit> 3.36) −0.032 *** (0.009) Innoit−1(qit> 5.93) 0.083 *** (0.023)
LR(γ) 7.33 LR(γ) 7.19
Sum of Square Errors 1482.00 Sum of Square Errors 195.92
Confidence Interval (−1.14, 3.77) Confidence Interval (5.66, 6.14)
(10%, 5%, 1% critical values) (11.5, 12.9, 17.5) (10%, 5%, 1% critical values) (10.2, 12.4, 18.2)
*** and ** indicate significance at the 1% and 5% level. Robust standard errors are reported in parentheses.
5.4. Further Statistics and Analysis
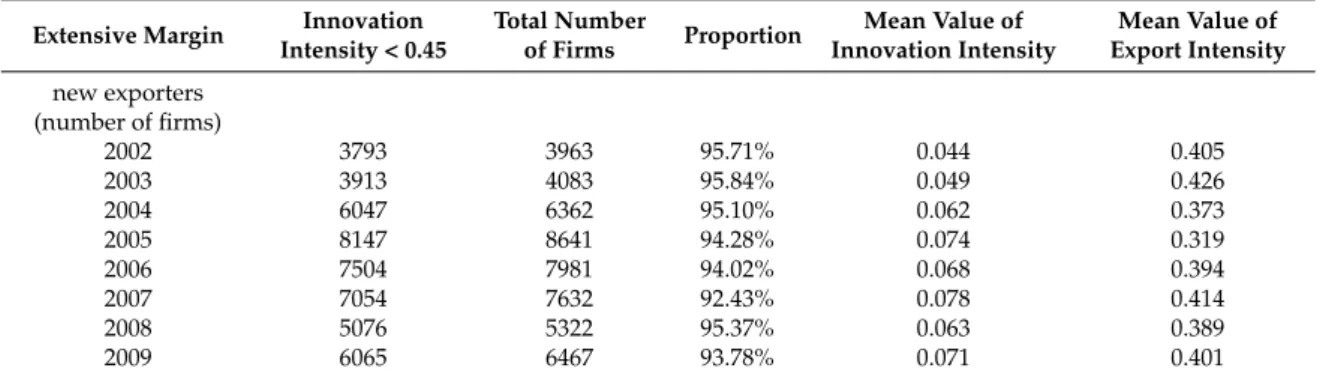
empirical results, Table 5shows the statistics of firms based on the inflection value of extensive margin. In terms of new exporters, innovation could greatly improve the propensity of firms within a certain interval (innovation intensity < 0.45). This result is partly in line with the findings of Lachenmaier et al. [21] for Germany, Caldera [4] and Cassiman et al. [24] for Spain, Ganotakis et al. [39] for the United Kingdom, and Bernard et al. [42] for the USA, suggesting that innovation could attribute to a firm’s export decisions. According to the proportion and mean value of innovation intensity, it can be concluded that less innovation and more firms are distributed on the left side of the relationship curve. There is space for new exporters to improve the innovation level.
Table 5.The statistics of firms based on the empirical results of extensive margin.
Extensive Margin Innovation Intensity < 0.45
Total Number
of Firms Proportion
Mean Value of Innovation Intensity
Mean Value of Export Intensity
new exporters (number of firms)
2002 3793 3963 95.71% 0.044 0.405
2003 3913 4083 95.84% 0.049 0.426
2004 6047 6362 95.10% 0.062 0.373
2005 8147 8641 94.28% 0.074 0.319
2006 7504 7981 94.02% 0.068 0.394
2007 7054 7632 92.43% 0.078 0.414
2008 5076 5322 95.37% 0.063 0.389
2009 6065 6467 93.78% 0.071 0.401
The statistics are from a Chinese industrial firms’ database for the years 2001–2009.
In terms of intensive margin, the non-linear U-shaped relationship denotes that there is an innovation threshold for a firm to increase the export scale, which is consistent with the finding of Ganotakis et al. [39] that innovation cannot increase subsequent export intensity. The inflection value is 0.38. Table6shows the statistics of firms based on the inflection value of intensive margin. According to the proportion and mean value of innovation intensity, the intensive margin of export growth is concentrated among lower innovation level firms and the innovation ability among firms is irregular. Moreover, the great disparity in innovation ability is not conducive to firms’ development against a backdrop of international technological competition.
Table 6.The statistics of firms based on the empirical results of intensive margin.
Intensive Margin Innovation Intensity > 0.38
Total Number
of Firms Proportion
Mean Value of Innovation Intensity
Mean Value of Export Intensity
exporters of scale increase (number of firms)
2002 266 1441 18.46% 0.638 0.248
2003 341 1723 19.79% 0.651 0.278
2004 487 2026 24.06% 0.672 0.313
2005 679 2398 28.32% 0.692 0.348
2006 785 2761 28.43% 0.687 0.356
2007 871 3087 28.21% 0.696 0.340
2008 572 1873 30.54% 0.673 0.314
2009 722 2608 27.68% 0.685 0.327
The statistics are from a Chinese industrial firms’ database for the years 2001–2009.
dominated by developed countries; third, the input of firms’ innovation must be compensated for by consumer demand. However, the export destinations of China are concentrated in developed countries, where the product quality and diversity are even more attractive, which means that firms lack the motivation to innovate because of the shortage of international demand.
6. Discussion
6.1. Policy Implications
The findings on the role of firms’ innovation in driving the extensive margin and intensive margin of export growth appear to be relevant from a public policy perspective. Economic policies aimed at export promotion have been widely supported by the argument that involving firms in innovation leads to increased exports. Focused on Chinese manufacturing firms, this study has the following policy implications combined with the empirical results. Firstly, innovation collaboration with firms from advanced technology areas should be encouraged since the firms’ innovation in China remains at a low level. Secondly, the government should accelerate the procedure of intellectual property protection so as to minimize the risk of firms’ innovation and encourage more firms to join in innovation. Thirdly, more financial support should be attached to high-tech sectors in order to improve the technical complexity of exporting products. Finally, the “One Belt, One Road” initiative of China as well as the implementation of an international cooperation framework will increase the international demand for Chinese products.
6.2. Limitations and Further Discussion
There are several inherent limitations to this study, suggesting other avenues for future research. Especially in view of the fact that international spillover channels for innovation are particularly important to open economies (Coe et al. [57]; Keller [58]), a very important variable to take into account in the model would be the openness of firms’ innovation process. Then an interesting extension of the current paper could explore the effect of open innovation strategies on export growth. Recent studies have focused on the open innovation process among firms, revealing the positive effect on innovation performance [59–61]. As a consequence, when we take open innovation into consideration, the positive relationship between innovation and export growth is likely to be enhanced, from the perspective of both theoretical mechanism and empirical analysis. The linkage mechanisms are reflected as follows. Firstly, a firm making open innovation collaboration with foreign partners is likely to increase its capability to export to those countries, as innovation collaboration could contribute to meeting the local demand for different products. Secondly, an open innovation process could increase a firm’s ability to profit from intellectual property that they do not own, so that the positive effect of innovation on exports could be strengthened. Thirdly, an open innovation process with foreign partners could promote export growth by reducing trade barriers. The variety of external innovation channels used by a firm and the extent to which it relies on them could have different impacts on the extensive and intensive margins of export growth. However, in terms of this study, the analysis is just concentrated on the relationship between firms’ independent innovation and export growth; further investigation is needed to incorporate open innovation into the research framework.
7. Conclusions
a U-shaped relationship between innovation and intensive margin. The results are partially consistent with previous studies (e.g., Lachenmaier et al. [21]; Caldera [4]; Cassiman et al. [24]; Ganotakis et al. [39]; Bernard et al. [42]) except for the threshold effect. In terms of the Chinese case, Chen [36] argued that innovation played a positive role in promoting the dual margins of export growth, ignoring the sustainable effect of innovation.
A further insight reveals that the synergistic effect of innovation and productivity on exports is positive and significant, revealing that the relationship between innovation and exports runs through productivity as innovative firms become more productive. The insignificant effect of productivity on export scale suggests that exporters try to improve the quality and sophistication of products to meet foreign demand. The impact of innovation on exports is probably different, considering the specifications of individual sectors. Comparing with the results of different technological sectors, the estimation of innovation reveals that, for high-tech sectors, firms’ innovation can positively improve the extensive margin of export growth for a wider interval, and the threshold value is higher. Consistently, Verhoogen [38] and Hausmann [54] indicated that innovation played a more important role in technological sectors that required greater product diversification and sophistication. To reach a definite conclusion, this study further reports the threshold test result, which is in line with the results from the Heckman model. Moreover, the statistics of firms based on the inflection value of extensive margin show that most of the firms are distributed to the left side of the nonlinear curve, suggesting there is much room for innovation improvement. The statistics for intensive margin show less innovation and more firms on the left side of the relationship curve, indicating uneven innovation ability among the firms.
Acknowledgments: This work is supported by the Key Project of National Philosophy and Social Science Foundation of China under Grant No. 15AJY001 and the Key Project of National Philosophy and Social Science Foundation of Jiangsu Province, China under Grant No. 14EYA002. We appreciate the constructive suggestions from peer reviewers and the help of editors. Special thanks to 28th CESA Annual Conference at JCU Cairns, Australia for valuable comments and suggestions from other participants. All remaining errors are ours.
Author Contributions:Liangfeng Hao and Bin Qiu came up with the original idea for this work; Bin Qiu collected the related literature and designed the theoretical model. Liangfeng Hao and Lisette Cervantes dealt with the data and carried out the empirical analysis. All authors were committed to improving this paper and are responsible for the viewpoints mentioned in this work.
Conflicts of Interest:The authors declare no conflict of interest.
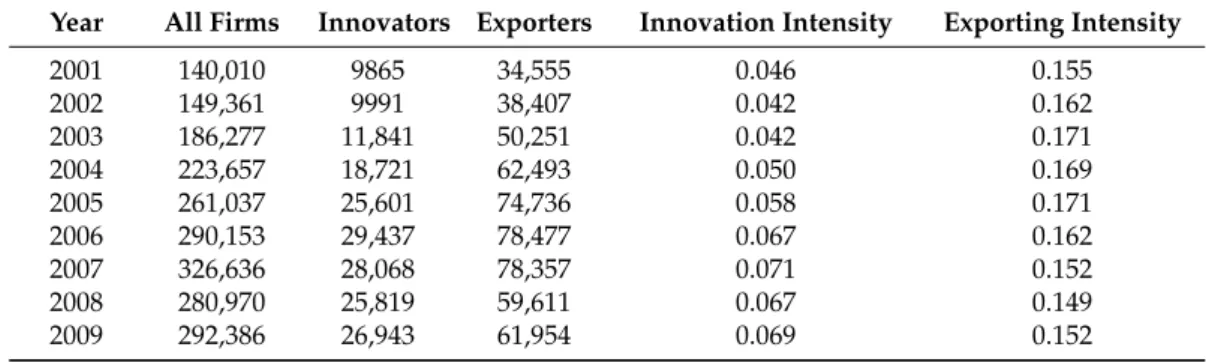
Appendix A
Table A1.The summary statistics for innovation and export patterns.
Year All Firms Innovators Exporters Innovation Intensity Exporting Intensity
2001 140,010 9865 34,555 0.046 0.155
2002 149,361 9991 38,407 0.042 0.162
2003 186,277 11,841 50,251 0.042 0.171
2004 223,657 18,721 62,493 0.050 0.169
2005 261,037 25,601 74,736 0.058 0.171
2006 290,153 29,437 78,477 0.067 0.162
2007 326,636 28,068 78,357 0.071 0.152
2008 280,970 25,819 59,611 0.067 0.149
2009 292,386 26,943 61,954 0.069 0.152
Appendix B
Table B1.The statistics of innovation and export patterns by sectors.
Sectors Firm Level Exporting
Proportion
Innovation Proportion
Innovation
Intensity Ln TFP
Manufacture of food products High Technology 0.193 0.121 0.027 5.069 Manufacture of beverages High Technology 0.126 0.188 0.023 4.892
Manufacture of tobacco products High Technology 0.253 0.414 0.025 6.482
Manufacture of textiles Low Technology 0.369 0.101 0.017 4.712 Manufacture of wearing apparel Low Technology 0.596 0.082 0.012 4.837
Manufacture of leather and
related products Low Technology 0.589 0.152 0.013 5.016
Manufacture of wood and of products of wood and cork, except furniture; manufacture of articles of straw and
plaiting materials
Low Technology 0.253 0.104 0.006 4.772
Manufacture of furniture Low Technology 0.437 0.124 0.010 4.790
Manufacture of paper and
paper products Low Technology 0.147 0.089 0.006 4.680
Printing and reproduction of
recorded media Low Technology 0.128 0.088 0.007 4.323
Manufacture of coke and refined
petroleum products Low Technology 0.085 0.149 0.010 5.533 Manufacture of chemicals and
chemical products High Technology 0.223 0.217 0.022 4.999 Manufacture of basic pharmaceutical
products and pharmaceutical preparations
High Technology 0.248 0.445 0.055 4.961
Manufacture of rubber and
plastics products Low Technology 0.331 0.171 0.015 1.565 Manufacture of other non-metallic
mineral products Low Technology 0.182 0.135 0.012 4.692 Manufacture of basic metals Low Technology 0.305 0.116 0.012 4.831
Manufacture of machinery
and equipment Low Technology 0.253 0.250 0.031 4.898
Manufacture of motor vehicles,
trailers and semi-trailers High Technology 0.382 0.245 0.025 4.928
Manufacture of electrical equipment High Technology 0.406 0.361 0.057 5.040 Manufacture of computer, electronic
and optical products High Technology 0.636 0.131 0.013 4.891 Other manufacturing Low Technology 0.054 0.056 0.006 5.695
Appendix C
Figure C1.The simulation of single threshold test (extensive margin).
Figure C2.The simulation of single threshold test (intensive margin).
References
1. Melitz, M. The impact of trade on intra-industry reallocations and aggregate industry productivity. Econometrica2003,71, 1695–1725. [CrossRef]
2. Bernard, A.B.; Eaton, J.; Jensen, J.B.; Kortum, S. Plants and productivity in international trade.Am. Econ. Rev.
2003,93, 1268–1290. [CrossRef]
3. Butos, P. Trade liberalization, exports and technology upgrading: Evidence on the impact of MERCOSUR on Argentinean firms.Am. Econ. Rev.2011,101, 304–340. [CrossRef]
5. Krugman, P.A. Model of innovation, technology transfer, and the World distribution of income. J. Political Econ.1979,87, 253–266. [CrossRef]
6. Grossman, G.M.; Helpman, E. Product development and international trade. J. Political Econ. 1989,97, 1261–1283. [CrossRef]
7. Eaton, J.; Kortum, S. Technology, trade and growth: A unified framework.Eur. Econ. Rev.2001,45, 742–755. [CrossRef]
8. Eaton, J.; Kortum, S. Technology, geography, and trade.Econometrica2002,70, 1741–1779. [CrossRef] 9. Grossman, G.M.; Helpman, E. Quality ladders and product cycles.Q. J. Econ.1991,106, 557–586. [CrossRef] 10. Yeaple, S.R. A simple model of firm heterogeneity, international trade and wages.J. Int. Econ.2005,65, 1–20.
[CrossRef]
11. Aw, B.Y.; Roberts, M.J.; Winston, T. The complementary role of exports and R&D investments as sources of productivity growth.NBER Work. Pap.2005. [CrossRef]
12. Aw, B.Y.; Roberts, M.J.; Daniel, Y.X. R&D investments, exporting, and the evolution of firm productivity. Am. Econ. Rev.2008,98, 451–456.
13. Basile, R. Export behavior of Italian manufacturing firms over the nineties: The role of innovation.Res. Policy.
2001,30, 1185–1201. [CrossRef]
14. Wagner, J. Exports and productivity: A survey of the evidence from firm-level data.World. Econ.2007,30, 60–82. [CrossRef]
15. Girma, S.; Gorg, H.; Hanley, A. R&D and exporting: A comparison of British and Irish firms.Rev. World Econ.
2008,144, 750–773.
16. Harris, R.I.; Moffat, J.D. R&D, Innovation & Exporting in Britain: An Empirical Analysis. Available online: https://www.researchgate.net/publication/268352733 (accessed on 18 March 2011).
17. Filipescu, D.A.; Prashantham, S.; Rialp, A.; Rialp, J. Technological innovation and exports: Unpacking their reciprocal causality.J. Int. Mark.2013,21, 23–38. [CrossRef]
18. Rodil, O.; Vence, X.; Carreira, M.C. The relationship between innovation and export behaviour: The case of Galician firms.Technol. Forecast. Soc. Chang.2015. [CrossRef]
19. Imbriani, C.; Morone, P.; Testa, G. Innovation, quality and exports: The case of Italian SMEs.J. Int. Trade Econ. Dev.2014,23, 1089–1111. [CrossRef]
20. Cassiman, B.; Golovko, E. Innovation and internationalization through exports.J. Int. Bus. Stud.2011,42, 56–75. [CrossRef]
21. Lachenmaier, S.; Wößmann, L. Does innovation cause exports? Evidence from exogenous innovation impulses and obstacles using German micro data.Oxf. Econ. Pap.2006,58, 317–350. [CrossRef]
22. Bartel, A.; Ichniowski, C.; Shaw, K. How does information technology affect productivity? Plant level comparisons of product innovation, process improvement, and worker skills.Q. J. Econ.2007,4, 1721–1758. [CrossRef]
23. Becker, S.O.; Egger, P.H. Endogenous product versus process innovation and a firm’s propensity to export. Empir. Econ.2007,44, 1–26. [CrossRef]
24. Cassiman, B.; Martinezros, E. Product innovation and exports: Evidence from Spanish manufacturing. IESE Work. Pap.2007. Available online: http://dev3.cepr.org/meets/wkcn/6/6652/papers/Cassiman.pdf (accessed on 21 May 2007).
25. Butter, F.D.; Möhlmann, J.L.; Wit, P. Trade and product innovations as sources for productivity increases: An empirical analysis.J. Prod. Anal.2008,30, 201–211. [CrossRef]
26. Butter, F.D.; Essaghir, A. Productivity effects of trade and product innovations: An empirical analysis for 13 OECD countries.Appl. Econ.2013,45, 4412–4418. [CrossRef]
27. Jakob, B.M. Innovations and manufacturing export performance in the OECD Countries.Oxf. Econ. Pap.
2008,60, 143–167.
28. Damijan, J.; Kostevc, ˇC.; Polanec, S. From innovation to exporting or vice versa? World Econ. 2010,33, 374–398. [CrossRef]
29. Yi, J.; Wang, C.; Kafouros, M. The effects of innovative capabilities on exporting: Do institutional forces matter?Int. Bus. Rev.2013,22, 392–406. [CrossRef]
30. Matthieu, C.; Pamina, K. Structural gravity equations with intensive and extensive margins.Can. J. Econ.
31. Hummels, D.; Klenow, P.L. The variety and quality of a nation’s exports.Am. Econ. Rev.2005,95, 704–723. [CrossRef]
32. Felbermayr, G.J.; Kohler, W. Exploring the intensive and extensive margins of world trade.Rev. World Econ.
2006,142, 642–674. [CrossRef]
33. Dutt, P.; Mihov, I.; Zandt, T.V. The effect of WTO on the extensive and the intensive margins of trade. J. Int. Econ.2013,2, 204–219. [CrossRef]
34. Helpman, E.; Melitz, M.J.; Rubinstein, Y. Estimating trade flows: Trading partners and trading volumes. Q. J. Econ.2008,123, 441–487. [CrossRef]
35. Besedeš, T.; Prusa, T.J. The role of extensive and intensive margins and export growth.J. Dev. Econ.2011,2, 371–379. [CrossRef]
36. Chen, W.C. The extensive and intensive margins of exports: The role of innovation.World Econ.2013,36, 607–635. [CrossRef]
37. Klepper, S. Entry, exit, growth, and innovation over the product life cycle.Am. Econ. Rev.1996,86, 562–583. 38. Verhoogen, E.A. Trade, quality upgrading, and wage inequality in the Mexican manufacturing sector.
Q. J. Econ.2008,123, 489–530. [CrossRef]
39. Ganotakis, P.; Love, J.M. R&D, product innovation, and exporting: Evidence from UK new technology based firms.Oxf. Econ. Pap.2011,63, 279–306.
40. Olley, G.S.; Pakes, A. The dynamics of productivity in the telecommunications equipment industry. Econometrica1996,64, 1263–1297. [CrossRef]
41. Levinsohn, J.; Petrin, A. Estimating production functions using inputs to control for unobservables. Rev. Econ. Stud.2003,70, 317–341. [CrossRef]
42. Bernard, A.B.; Jensen, J.B.; Redding, S.; Scott, P.K. Firms in international trade. J. Econ. Perspect. 2007. [CrossRef]
43. Agnihotri, A.; Bhattacharya, S. Determinants of export intensity in emerging markets: An upper echelon perspective.J. World Bus.2015,50, 687–695. [CrossRef]
44. Serrasqueiro, Z.S.; Nunes, P.M. Performance and size: Empirical evidence from Portuguese SMEs. Small Bus. Econ.2008,31, 195–217. [CrossRef]
45. Rasiah, R.; Shahrivar, R.B.; Yap, X.S. Institutional support, innovation capabilities and exports: Evidence from the semiconductor industry in Taiwan.Technol. Forecast. Soc. Chang.2016,109, 69–75. [CrossRef] 46. Riding, A.; Orser, B.J.; Spence, M.; Belanger, B. Financing new venture exporters.Small Bus. Econ.2012,38,
147–163. [CrossRef]
47. Freeman, J.; Styles, C. Does location matter to export performance? Int. Mark. Rev. 2013,31, 181–208. [CrossRef]
48. Long, C.; Zhang, X.B. Patterns of China’s industrialization: Concentration, specialization, and clustering. China Econ. Rev.2012,23, 593–612. [CrossRef]
49. Faustino, H.C.; Matos, P.V. Exports, productivity and innovation: New firm level empirical evidence. Appl. Econ.2015,47, 4918–4933.
50. Robert, M.J.; Tybout, J.R. The decision to export in Colombia: An empirical model of entry with sunk cost. Am. Econ. Rev.1997,87, 545–564.
51. Foster, L.; Haltiwanger, J.; Syverson, C. Reallocation, firm turnover, and efficiency: Selection in productivity or profitability?Am. Econ. Rev.2005,98, 394–425. [CrossRef]
52. Kugler, M.; Verhoogen, E. The quality-complementarity hypothesis: Theory and evidence from Colombia. NBER Work. Pap.2008. [CrossRef]
53. Imbs, J.; Wacziarg, R. Stages of diversification.Am. Econ. Rev.2003,90, 63–86. [CrossRef]
54. Hausmann, R.; Hwang, J.; Rodrik, D. What You Export Matters.J. Econ. Growth2007,12, 1–25. [CrossRef] 55. Hansen, B.E. Threshold effects in non-dynamic panels: Estimation, testing, and inference.J. Econ.1999,93,
345–368. [CrossRef]
56. Schott, P.K. The relative sophistication of Chinese exports.Econ. Policy.2008,23, 5–49. [CrossRef] 57. Coe, D.T.; Helpman, E. International R&D spillovers.Eur. Econ. Rev.1995,39, 859–877.
58. Keller, W. International Technology Diffusion.J. Econ. Lit.2004,42, 752–782. [CrossRef]
60. Ferreras-Méndez, J.L.; Newell, S.; Fernández-Mesa, A.; Alegre, J. Depth and breadth of external knowledge search and performance: The mediating role of absorptive capacity.Ind. Market. Manag. 2015,47, 86–97. [CrossRef]
61. West, J.; Bogers, M. Leveraging external sources of innovation: A review of research on open innovation. J. Prod. Innovat. Manag.2014,31, 814–831. [CrossRef]