Article
Spatial Determinants of Urban Land Expansion in
Globalizing Nanjing, China
Jianglong Chen1, Jinlong Gao1, Feng Yuan1and Yehua Dennis Wei2,3,*
1 Key Laboratory of Watershed Geographic Sciences, Nanjing Institute of Geography and Limnology, Chinese Academy of Sciences, Nanjing 210008, China; [email protected] (J.C.);
[email protected] (J.G.); [email protected] (F.Y.)
2 Key Research Institute of Yellow River Civilization and Sustainable Development & Collaborative and Innovation Center on Yellow River Civilization of Henan Province, Henan University, Kaifeng 45001, China 3 Department of Geography, University of Utah, Salt Lake City, UT 84112-9155, USA
* Correspondence: [email protected]; Tel.: +86-801-585-0545; Fax: +86-801-585-8218 Academic Editor: Vida Maliene
Received: 15 July 2016; Accepted: 25 August 2016; Published: 29 August 2016
Abstract: This paper proposes a cost-benefit framework to address the role of parcel and neighborhood conditions, as well as government policies, and investigates the spatial determinants of urban land expansion in Nanjing, one of the sub-centers of the Yangtze River Delta (YRD). Using spatial regression models, we find the significance of the economy of scale, agglomeration, accessibility, and government policies in Nanjing’s urban growth. In the earlier stage, urban expansion in Nanjing was mainly driven by the development of infrastructure. Since entering the 21st century, the emerging commercial and industrial sub-centers have become the major centers of growth, which has changed Nanjing’s spatial structure from compact monocentric to a polycentric one. We also highlight the importance of government policies that have been strengthened by various national strategies, including the “New-type Urbanization” and “Beautiful China” strategies. Different from cities in the Pearl River Delta, Nanjing has a more significant top-down process in its development, which indicates that the municipal government of Nanjing is playing a more important role in urban growth.
Keywords:urban land expansion; spatial determinant; cost-benefit analysis; spatial regression model; Nanjing; China
1. Introduction
Since the 1980s, China has experienced unprecedented urbanization [1]. From 1978 to 2015, the level of urbanization increased from 17.9% to 56.1%, and could reach 68% in the next two decades [2–4].
In order to cope with the serious social and economic problems induced by urban expansion, the Chinese government has executed the historically strictest policies of farmland protection and intensive land use to constrain fast growing farmland conversion, by introducing the so-called quota system for both the farmland conversion and construction [5]. Corresponding to the strict land resource management, scholars have carried out research on patterns, consequences, and mechanisms of urban growth and urban land expansion in China from two different perspectives [4]. One group focuses on the trajectories, mechanisms, and consequences of urban land expansion from institutional and political economy perspectives [6–9]. The other is more concerned with the patterns and effects from the neoclassical perspective and geographic information system (GIS) and remote sensing [10–12].
These studies have not only built a solid foundation for understanding patterns and driving forces of urban land expansion in China, but have also provided a strong scientific basis for making decisions in the management of land resources and urbanization nationally. However, macro policies need to be downscaled and implemented at micro geographical scales [13]. For instance, although the quota of farmland protection has been assigned by provincial governments, local governments still need to find places suitable for agriculture and protection [14]. It is important for scientific and authoritative planning to choose appropriate sites for growth and protection according to urban development realities [15]. Thus how well macro policies of spatial control are implemented highly depends on the knowledge of driving mechanisms of urban land use at a more micro spatial scale.
Because of scale dependence for most geographical phenomena, a significant mismatch between macro policies and micro realities have arisen in China [16,17]. Researchers have documented the underlying mechanisms of urban expansion and classified underlying factors into natural and socio-economic ones [7]. However, micro scale studies are relatively weak [11,12]. More efforts are still needed to detect the micro factors of urban land expansion in China. In this article, we therefore investigate the mechanisms of urban land expansion in Nanjing during three different periods of 1995–2001, 2001–2007, and 2007–2013 at the parcel level.
2. Study Area and Methodology
2.1. The Study Area
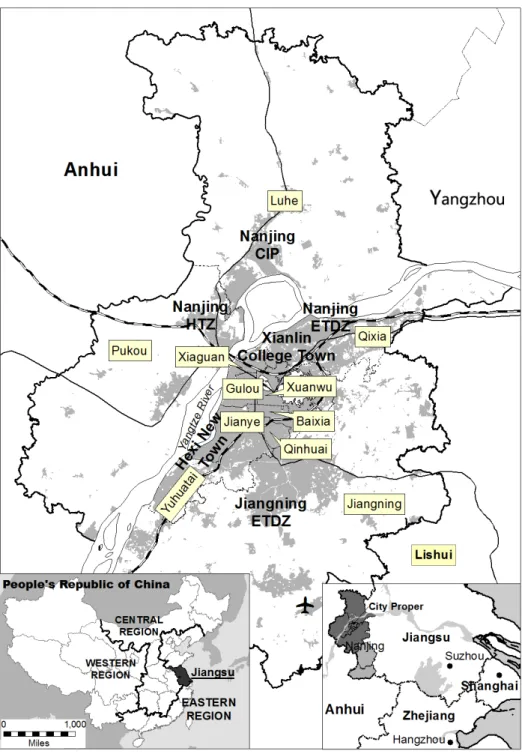
As a sub-center of the Yangtze River Delta that is China's largest globalizing city region, Nanjing exemplifies the rapidly growing coastal cities of China, as well as the important portals driving the development of inland provinces [18,19]. The gross domestic product (GDP) and population of the Nanjing municipality increased from RMB 102.1 billion yuan and 5.44 million in 2000 to RMB 882.1 billion yuan and 8.22 million in 2014, respectively.
Figure 1.Location and spatial organization of Nanjing, China. (HTDZ: High-Tech Development Zone; ETDZ: Economic and Technical Development Zone.)
2.2. Data Collection and Methods
U.S. Geological Survey (USGS), the distribution maps of important ecological areas and geological disaster-prone areas, the main roads in Nanjing, and the population census.
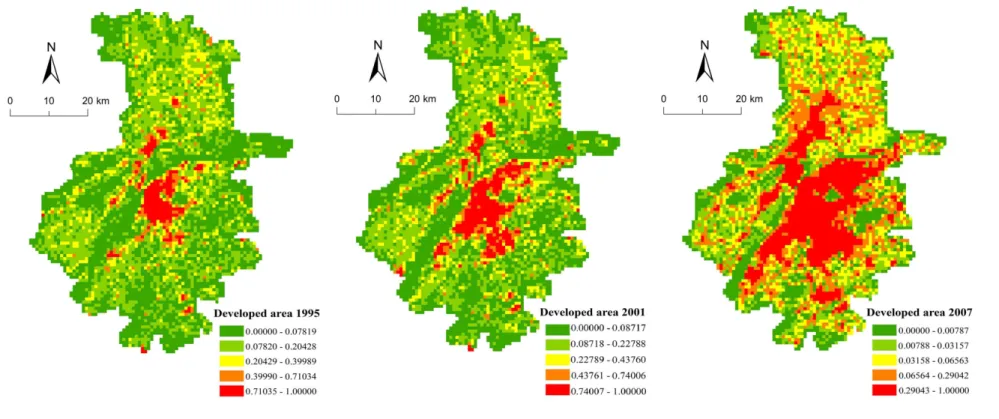
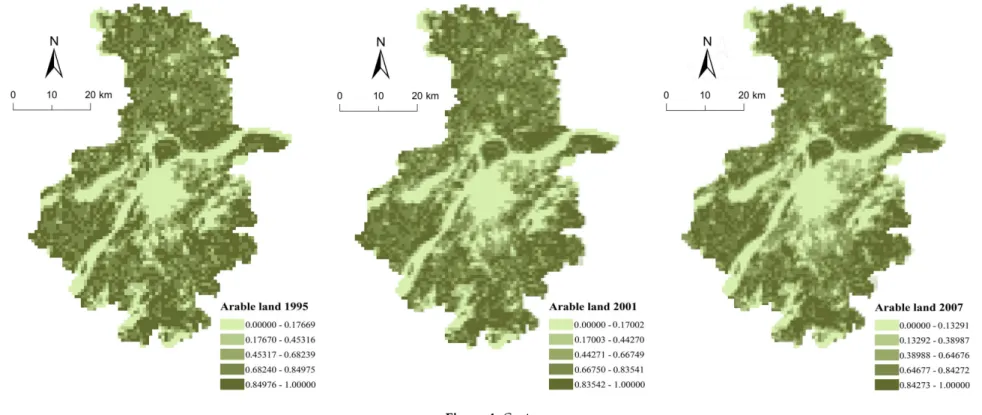
We processed the data in the following ways. Four cloud-free and less cloud coverage (less than 10%) images were firstly obtained to constitute the whole temporal sequence of the land use change. Then the geometric and atmospheric correction was implemented by ENVI 5.0 (Exelis Visual Information Solutions: Boulder, CO, USA), and the object oriented interpretation method was employed to generate land cover maps. Validated with the data of second national land use survey, five categories (i.e., construction land, agricultural land, forest and grass, water body, and unused land) were included in the land use maps. A total of 87 land cover samples collected from field campaigns using Global Positioning System (GPS), combined with 182 random samples generated from the visual interpretation were selected for accuracy assessment. The total accuracy and Kappa coefficient are 84% and 0.88, respectively (Figure2). Second, we used ArcView software to calculate the time costs from each grid to the destinations, including the central business district (CBD), three sub-centers, two railway stations, 42 highway exits, 14 important development zones (DZs), two river ports, and Lukou International Airport. Third, we estimated the population of each grid by calculating its share of urban and rural land in the towns and sub-districts, in which we also separated the population into urban and rural parts based on their household characteristics.
Figure 2. Urban land expansion in Nanjing, 1995–2013.
Considering scale dependence, the grid size used in this study is determined by an empirical formula, namely based on the quantity of sampling points, and the quantity of grids is roughly equivalent to half of the sampling points. This paper takes the quantity of construction land patches as the sampling points, and the quantity of construction land patches in the four years is around 10,000. After debugging and selecting 1 km×1 km grids multiple times, we generated around 5100 units of
analysis in total, and carried out the representative of the changes in the proportion of construction lands for each grid unit in 1995–2001, 2001–2007, and 2007–2013, respectively.
According to Tobler’s First Law of geography, everything is related to others, and near things are more related than distant ones [20–22]. Namely, for data with geographical space attributes, it is generally considered that a closer relationship exists between nearer variables than between spatially longer-distance variables [23]. The spatial effect expressed by spatial autocorrelation may be characterized and depicted with two models. One is the spatial error model (SEM) that shall be employed when the error terms of a model are spatially correlated. The other one is the spatial lag model (SLM) that will be functional when the spatial dependence between variables seems to be very critical for a model and induces spatial autocorrelation [24].
Accordingly, spatial econometrics the traditional OLS regression model (Equation (1)) can be improved using a spatial weight matrix, which represents the specific spatial links among spatial units [25].
Y=Xβ+ε (1)
Thus the SEM model (Equation (2)) and the SLM model (Equation (3)) can be specified as the following:
Y=Xβ+ρWY+ε (2)
Y=Xβ+λWε+ξ (3)
whereYis anN×1 vector of observations on the random variable.Xis anN×Mvector of observations
on explanatory variables.Wis anN×Nspatial weight matrix, andWYdenotes a spatially lagged
dependent variable.ρis a spatial autoregressive coefficient, andεis a vector of independent identically distributed (i.i.d.) random error term.λdenotes the spatial autocorrelation coefficient, which measures the spatial dependence function in a sample observation value, namely the direction and degree of influence of a neighboring area’s observed valueYon a local area’s observed valueY.ξis an i.i.d. well-behaved error.
Empirically, it is necessary to determine which spatial model is more suitable for objective facts according to certain judgment criteria. If it is discovered in the inspection of spatial dependence that Lagrange Multiplier (LM) against a spatial lag alternative (LMlag) is more significant than LMerror, and Robust LMlagis significant while Robust LMerroris insignificant, then it may be judged that the appropriate model is SLM. On the contrary, if LMerroris more significant statistically than LMlag, and Robust LMerroris significant while Robust LMlagis insignificant, it may be concluded that the SEM is the appropriate model [26].
3. Conceptual Framework and Statistical Models
3.1. Conceptual Framework and Determining Factors
Both the parcel and neighboring conditions of the land use parcel have effects on the benefits of urban land use change. The parcel-condition mainly denotes the scale economy for land development activities [30]. The scale economy highly depends on the area of land available, and more available land leads to higher scale benefit from development [10,31]. On the other hand, the neighboring condition is mainly related to agglomeration economies [32]. The development of neighbors will certainly induce the local expansion of urban land [33]. In addition, urban planning has always been closely associated with urban land expansion in developing socialist countries [15,34].
Similarly, the costs of urban land development also are linked to both the parcel and neighboring conditions of land parcels. The most important factor is the geological features of land use, including slope, elevation, and other physical conditions [10]. Another important factor impacting the development of urban land is the accessibility to urban commercial and industrial centers, and the proximity to transportation infrastructure [10,11]. The change in the traffic and transportation condition is a major explanatory variable which explains the increase of urban land demand [35]. With the diversifying of urban functions, the commercial and industrial activities tend to locate at different geographical spaces in the urban areas, which significantly induced the expansion of both the residential and industrial land in or around the city proper [3,36].
Figure 3. Figure 3.The systematic mechanism of urban land expansion at parcel level. The systematic mechanism of urban land expansion at parcel level.
Furthermore urban land expansion in China is also sensitive to the land use policies imposed by both the central and local states [37,38]. Particularly, the central government has introduced the “National New-type Urbanization Plan” (NNUP) and the notion of “Beautiful China”, which aim to improve ecological protection. Hereafter, the protection of natural environment has aroused increasing attention from politicians and academics [2,39,40]. Restricting development in a delimited reserve area is a major approach for the government to spatially implement environmental protection. Similar to the function of urban planning, the development in reservation areas is restricted by the government, which will face a series of punishments and a relatively high system cost [41].
3.2. Explanatory Variables and Statistical Models
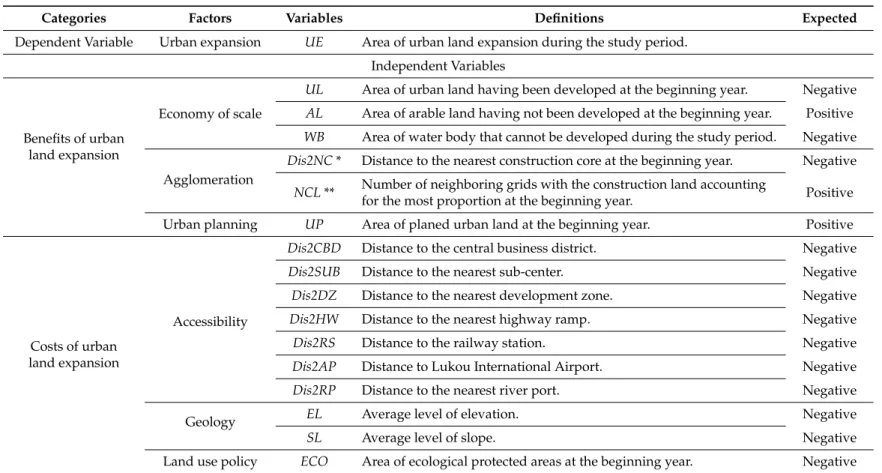
Table 1.The definitions of variables.
Categories Factors Variables Definitions Expected
Dependent Variable Urban expansion UE Area of urban land expansion during the study period. Independent Variables
Benefits of urban land expansion
Economy of scale
UL Area of urban land having been developed at the beginning year. Negative AL Area of arable land having not been developed at the beginning year. Positive WB Area of water body that cannot be developed during the study period. Negative
Agglomeration
Dis2NC* Distance to the nearest construction core at the beginning year. Negative
NCL** Number of neighboring grids with the construction land accounting
for the most proportion at the beginning year. Positive
Urban planning UP Area of planed urban land at the beginning year. Positive
Costs of urban land expansion
Accessibility
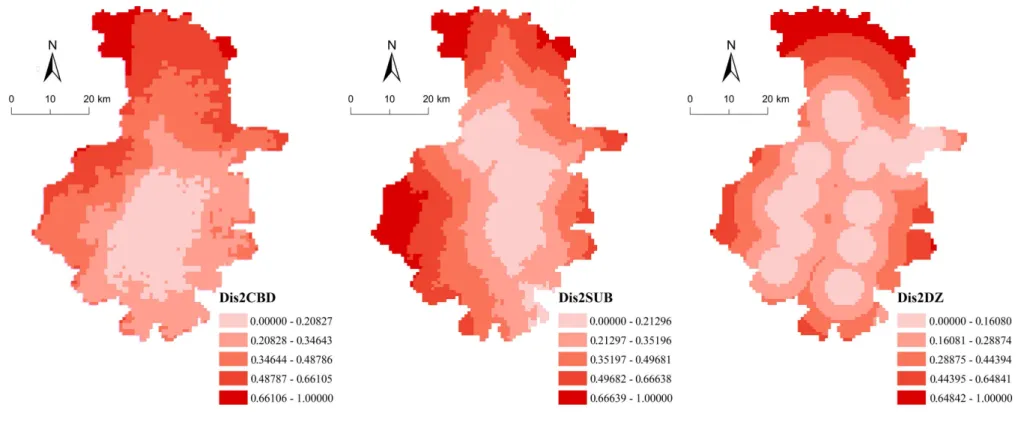
Dis2CBD Distance to the central business district. Negative Dis2SUB Distance to the nearest sub-center. Negative Dis2DZ Distance to the nearest development zone. Negative Dis2HW Distance to the nearest highway ramp. Negative
Dis2RS Distance to the railway station. Negative
Dis2AP Distance to Lukou International Airport. Negative Dis2RP Distance to the nearest river port. Negative
Geology EL Average level of elevation. Negative
SL Average level of slope. Negative
Through a collinearity inspection of each index element of urban land expansion in 1995–2001, 2001–2007, and 2007–2013, we have discovered that relatively strong correlations exist in the four variables of three study periods, namely the distance to railway station (Dis2RS), the distance to river port (Dis2RP), the distance to airport (Dis2AP), and the distance to central business district (Dis2CBD). Thus to avoid the problem of multicollinearity, we divided all of the explanatory variables into models for regression, respectively. Based on the spatial dependence analysis in Table2, the Spatial Lag Model (SLM) and Spatial Error Model (SEM) were employed to model the mechanisms of urban land expansion in different periods, respectively. Meanwhile, in order to eliminate the influence of the explanatory variable dimension on analysis, we have executed range standardization of explanatory variables according to the research of Cohen et al. [42]
Table 2.Diagnostics for spatial dependence and model selection.
Test
1995–2001 2001–2007 2007–2013
Model 1 Model 2 Model 3 Model 4 Model 5 Model 6 Model 7 Model 8 Model 9 Moran’s I
(error) 77.78 77.07 78.37 71.83 72.02 71.98 32.82 32.45 32.57
Lagrange Multiplier
(lag)
6011.62 5866.48 6093.48 3138.72 3160.13 5156.73 1059.47 1031.61 1040.13
Robust LM
(lag) 112.04 94.19 115.07 35.45 37.63 139.92 15.25 14.14 14.79
Lagrange Multiplier (error)
5930.40 5812.12 6011.42 5054.09 5072.38 5066.17 1044.40 1018.05 1025.92
Robust LM
(error) 30.82 39.83 33.01 150.81 149.88 49.36 0.18 * 0.57 * 0.58 *
LM
(SARMA) 6042.44 5906.31 6126.48 5189.53 5210.01 5206.09 1059.65 1032.19 1040.71
Model
Selected SLM SLM SLM SEM SEM SLM SLM SLM SLM
* Non-significant at 0.1 level, others significant at 0.01 level.
4. Results
4.1. Mechanism of Urban Land Expansion in Nanjing
In association with the aforementioned results of spatial dependence analysis, the underlying mechanism of urban land expansion in Nanjing is examined by applying the SLM/SEM considering both the cost and benefit of land development activities. As Table3reports, urban land expansion in Nanjing is sensitive to both the cost and benefit factors. The mechanism of cost-benefit system varies across time and indictors.
Table 3.Parameters of spatial regression models.
Factors Variables 1995–2001 2001–2007 2007–2013
Model 1 Model 2 Model 3 Model 4 Model 5 Model 6 Model 7 Model 8 Model 9
Constant 0.023 *** 0.019 *** −0.088 *** 0.226 *** 0.221 *** 0.004 0.071 *** 0.071 *** 0.074 ***
Economies of scale
UL −0.088 *** −0.087 *** −0.088 *** −0.124 *** −0.125 *** −0.121 *** −0.002 −0.003 –0.003
AL 0.013 ** 0.015 *** 0.013 ** 0.061 *** 0.061 *** 0.039 *** 0.001 0.002 0.001
WB −0.039 *** −0.041 *** −0.039 *** −0.052 *** −0.052 *** −0.030 *** −0.053 *** −0.049 *** –0.050 ***
Agglomeration Dis2NC 0.007 −0.005 −0.007 0.119 0.093 −0.001 0.011 0.009 0.009
NCL 0.053 *** 0.052 *** 0.053 *** 0.026 * 0.025 * 0.107 *** −0.023 −0.025 * –0.025
Urban plan UP 0.018 *** 0.014 *** 0.018 *** 0.008 0.008 0.016 ** 0.024 *** 0.022 *** 0.023 ***
Accessibility
Dis2CBD −0.040 *** - - −0.097 ** - - −0.008 * -
-Dis2SUB 0.002 0.013 0.024 −0.325 *** −0.344 *** −0.001 −0.023 ** −0.012 –0.020 **
Dis2DZ 0.009 0.027 ** 0.012 −0.157 ** −0.169 ** −0.026 * −0.084 *** −0.083 *** –0.080 ***
Dis2HW −0.024 ** −0.027 *** −0.033 *** 0.054 0.015 0.011 0.034 ** 0.042 *** 0.040 ***
Dis2RS - −0.084 *** — - 0.029 - - 0.007
-Dis2AP - −0.028 *** −0.023 *** - −0.031 −0.007 - 0.019 0.014
Dis2RP - - −0.033 *** - - −0.026 - - –0.020
Physical condition EL −0.008 −0.006 −0.010 −0.053 −0.049 0.024 −0.008 −0.013 –0.010
SL 0.001 0.007 0.004 0.023 0.021 0.002 −0.011 −0.001 –0.006
Land use policy ECO −0.015 ** −0.015 ** −0.014 ** −0.014 −0.013 −0.002 −0.015 *** −0.015 *** –0.015 ***
Weight_UE 0.843 *** 0.839 *** 0.031 *** 0.848 *** 0.843 *** 0.837 *** 0.523 *** 0.520 *** 0.521 ***
Akaike info criterion −10,577 −10,588 −10,572 −8722 −8718 −8694 −6437 −6437 −6437
Number of Observations 5106 5106 5106 5106 5106 5106 5106 5106 5106
Number of Variables 13 14 14 13 14 14 13 14 14
The coefficient of arable land (AL)was significantly positive, implying that urban land expansion in Nanjing is widely depending on the conversion of agricultural land uses before 2007, which is similar to Luo and Wei’s findings [11] and with the aforementioned negative correlation between the developed urban land (UL) and expansion. Thereafter, the coefficient ofALbecomes insignificant, reflecting that cities in China changed the growth trajectories with the increasing tight control over the quotas of the conversion of cultivated land to non-agricultural use [5,43]. In general, the urban expansion is constrained by the water body (WB) significantly, which can be interpreted as that the development of the area with more water body requires more technical and economic cost [10]. Following the theory of agglomeration economies, the number of construction land dominated grids (NCL) in the neighborhood encourages urban land expansion before 2007. It indicates that land development in urban China, particularly in Nanjing, has been influenced by the density of the construction sites [10]. In contrast, the distance to construction land cores (Dis2NC) did not have a significant influence, which is consistent with the findings by Oueslati and others [44].
4.2. Characteristics of Accessibility Variables
We found some other interesting points based on the coefficients of accessibility variables. Except for the distance to sub-centers (Dis2SUB) and the distance to development zones (Dis2DZ), all the accessibility variables had significantly negative effects on urban land expansion from 1995 to 2001. In the following two periods, external variables including the distance to highway (Dis2HW), railway (Dis2RS), airport (Dis2AP), and river port (Dis2RP) became insignificant or unexpected, while the impact of internal accessibility variables encompassing the distance to sub-centers (Dis2SUB) and development zones (Dis2DZ) increased as expected. The distance to central business district (Dis2CBD) has a weaker impact on urban land expansion in the recent period with the constant outward spreading of urban space [44]. The finding also confirms that the urban growth in Nanjing is driven by infrastructure development in the earlier stage, while since entering the 21st century, the emerging commercial and industrial sub-centers have become the major patterns of growth, which has changed Nanjing’s spatial structure from a compact monocentric to a polycentric one [18,45,46].
4.3. Impact of Ecological Protection Areas on Urban Land Expansion
In terms of the geological features, neither elevation (EL) nor slope (SL) had a significant influence on urban land expansion in Nanjing, because the difference of topographical conditions in Nanjing is not huge enough to result in a similar pattern of urban land expansion in terms of the geological conditions [47]. This result suggests that urban development in Nanjing is less influenced by the land suitability measured by slope than other Chinese cities such as Dongguan where the average geological features are better [10].
The influence of ecological protection areas (ECO) on urban land expansion is significantly negative in 1995–2001. However, the ecological policy gradually lost its functions in 2001–2007 with the increasing pressure of urban growth. Fortunately, there has been a reemphasis at the national level to strengthen ecological civilization construction in recent years [48,49]. Nanjing has delimited 78 important ecological areas including the prohibited development areas and restricted development areas [50], which consequently led to the recovery of the significant influence ofECOon urban land expansion in 2007–2013. This result suggests that the urban expansion in Nanjing is, in general, constrained by the strategy of urban sustainable development (SUD), which is in line with the requirements of NNUP, the first outline of China’s urbanization plan issued in March 2014 [3,40].
4.4. Relation between Planned Areas and Urban Land Expansion
local governments the leaders of land development. This finding is also contradictory to the study conducted by Zhu [51], focusing on the relationship of land use right and urban development in the early 1990s. The findings also suggest that the function of the market in recently developed cities like Nanjing is generally restricted by multiple urban plans. In addition, the management of China’s urban land is mainly restricted by two spatial planning systems, namely the urban master planning and land use planning [52]. The adoption of the urban master plan is generally a bottom-up procedure, while the land use plan has a top-down style. The difference of these two spatial plans consequently induced the dilemma of the under-development of the urban master plan and the over-development of the land use plan.
5. Conclusions
China has been experiencing tremendous urban land expansion or land urbanization [24]. Such expansion is often accredited to urbanization, industrialization, and economic transition in China [4,7,53]. The existing literature tends to focus on the patterns and mechanisms of urban land expansion, following the neoclassical “demand-side” perspective [11], but deemphasizing the fact that both the cost and benefit factors have important impacts on urban growth. This study examines urban land expansion in globalizing Nanjing by highlighting the cost and benefit of land development.
We found that urban land expansion in Nanjing is highly related to the benefit factors of agglomeration and scale economy, and the cost factors of proximity/accessibility and geological features, as well as the policies of urban master plans and ecological protection. By applying the spatial lag (SLM) and spatial error (SEM) models, the spatial determinants of urban land expansion in Nanjing between 1995 and 2013 were detected. Results indicate the importance of the cost and benefit factors in determining urban land expansion. Furthermore, the distance to CBD was found to have a significantly decreasing and negative effect on the urban land expansion in Nanjing, while the negative effect of distance to sub-centers and development zones increased in the study periods. This study indicates that emerging commercial and industrial sub-centers play a significant role in urban development.
Taking the roles of land use policy and urban planning into consideration, we have found that urban land expansion is sensitive to government policies of urban planning and ecological protection. Though scale economy and agglomeration had significant influences on the land development in the earlier stage of urban growth, the urban government rather than the local market is still the leader of urban growth in those second tier cities like Nanjing. This result indicates the dominance of the top-down process of land development in Nanjing, which is quite different from the bottom-up trajectories of other cities in the Yangtze River Delta (YRD) and the Pearle River Delta (PRD) [10,52,54]. This study underscores the potential of employing spatial autocorrelation analysis methodologies such as spatial lag/error models (SLM/SEM) to understand underlying mechanisms of urban land expansion. Applying advanced geospatial techniques such as spatial regime models [6], geographically and temporally weighted regression (GTWR) [3,55], and spatial panel models [56,57] have the potential to generate more insights into the trajectories of urban development in China.
The Nanjing case has also demonstrated that the cost-benefit framework is an appropriate conceptual tool for analyzing urban land expansion in Chinese cities by addressing parcel and neighborhood conditions, as well as government policies. In terms of limitations, since Nanjing exemplifies the rapidly growing coastal cities in China [19], the institutional and structural changes in Nanjing are not only somewhat different from those leading metropolises in the coastal regions, but also vary from the majority of inland cities [9].
Author Contributions:Jianglong Chen and Jinlong Gao were mainly responsible for data collection and analysis. All authors contributed to conceptual development and research design. Jinlong Gao and Jianglong Chen wrote the paper. Yehua Dennis Wei provided guidance and editorial assistance. All authors have read and approved the final manuscript.
Conflicts of Interest:The authors declare no conflict of interest.
References
1. Ding, C.; Lichtenberg, E. Land and urban economic growth in China.J. Reg. Sci.2011,51, 299–317. [CrossRef] 2. Bai, X.; Shi, P.; Liu, Y. Realizing China’s urban dream.Nature2014,509, 158–160. [CrossRef] [PubMed] 3. Gao, J.; Wei, Y.D.; Chen, W.; Yenneti, K. Urban land expansion and structural change in the Yangtze River
Delta, China.Sustainability2015,7, 10281–10307. [CrossRef]
4. Wei, Y.D.; Ye, X. Urbanization, land use, and sustainable development in China. Stoch. Environ. Res. Risk Assess.2014,28, 757–765. [CrossRef]
5. Tan, R.; Beckmann, V.; van den Berg, L.; Qu, F. Governing farmland conversion: Comparing China with the Netherlands and Germany.Land Use Policy2009,26, 961–974. [CrossRef]
6. Li, H.; Wei, Y.D.; Liao, F.H.; Huang, Z. Administrative hierarchy and urban land expansion in transitional China.Appl. Geogr.2015,56, 177–186. [CrossRef]
7. Gao, J.; Wei, Y.D.; Chen, W.; Chen, J. Economic transition and urban land expansion in Provincial China. Habitat Int.2014,44, 461–473. [CrossRef]
8. Wei, Y.D. Restructuring for growth in urban China: Transitional institutions, urban development, and spatial transformation.Habitat Int.2012,36, 396–405. [CrossRef]
9. Chen, J.; Gao, J.; Chen, W. Urban land expansion and the transitional mechanisms in Nanjing, China. Habitat Int.2016,53, 274–283. [CrossRef]
10. Liao, F.H.; Wei, Y.D. Modeling determinants of urban growth in Dongguan, China: A spatial logistic approach.Stoch. Environ. Res. Risk Assess.2014,28, 801–816. [CrossRef]
11. Luo, J.; Wei, Y.D. Modeling spatial variations of urban growth patterns in Chinese cities: The case of Nanjing. Lands. Urban Plan.2009,91, 51–64. [CrossRef]
12. Liu, Y.; Yue, W.; Fan, P. Spatial determinants of urban land conversion in large Chinese cities: A case of Hangzhou.Environ. Plan. B2011,38, 706–725. [CrossRef]
13. Chen, J.; Gao, J.; Yuan, F. Growth Type and Functional Trajectories: An Empirical Study of Urban Expansion in Nanjing, China.PLoS ONE2016,11, e0148389. [CrossRef] [PubMed]
14. Wang, J.; Chen, Y.; Shao, X.; Zhang, Y.; Cao, Y. Land-use changes and policy dimension driving forces in China: Present, trend and future.Land Use Policy2012,29, 737–749. [CrossRef]
15. Qian, Z. Master plan, plan adjustment and urban development reality under China’s market transition: A case study of Nanjing.Cities2013,30, 77–88. [CrossRef]
16. MacLeod, G. Place, politics and ‘scale dependence’ exploring the structuration of Euro-regionalism. Eur. Urban Reg. Stud.1999,6, 231–253. [CrossRef]
17. Hurlbert, A.H.; Jetz, W. Species richness, hotspots, and the scale dependence of range maps in ecology and conservation.Proc. Natl. Acad. Sci. USA2007,104, 13384–13389. [CrossRef] [PubMed]
18. Yuan, F.; Gao, J.; Wu, J. Nanjing—An ancient city rising in transitional China.Cities2016,50, 82–92. [CrossRef] 19. Wei, Y.D. Zone fever, project fever: Economic transition, development policy, and urban expansion in China.
Geogr. Rev.2015,105, 156–177. [CrossRef]
20. Sui, D.Z. Tobler’s first law of geography: A big idea for a small world?Ann. Assoc. Am. Geogr.2004,94, 269–277. [CrossRef]
21. Tobler, W. On the first law of geography: A reply.Ann. Assoc. Am. Geogr.2004,94, 304–310. [CrossRef] 22. Tobler, W.R. A computer movie simulating urban growth in the Detroit region.Econ. Geogr.1970,46, 234–240.
[CrossRef]
23. Anselin, L.; Getis, A. Spatial statistical analysis and geographic information systems.Ann. Reg. Sci.1992,26, 19–33. [CrossRef]
24. He, C.; Zhou, Y.; Huang, Z. Fiscal decentralization, political centralization, and land urbanization in China. Urban Geogr.2016,37, 436–457. [CrossRef]
26. Anselin, L.; Syabri, I.; Kho, Y. GeoDa: An introduction to spatial data analysis.Geogr. Anal.2006,38, 5–22. [CrossRef]
27. Muth, R.F. Economic change and rural-urban land conversions.Econ. J. Econ. Soc.1961,29, 1–23. [CrossRef] 28. Harvey, D.The Urbanization of Capital: Studies in the History and Theory of Capitalist Urbanization; Johns
Hopkins University Press: Baltimore, MA, USA, 1985.
29. Harvey, D. The geography of capitalist accumulation: A reconstruction of the Marxian theory.Antipode1975, 7, 9–21. [CrossRef]
30. Gao, J.; Li, S. Detecting spatially non-stationary and scale-dependent relationships between urban landscape fragmentation and related factors using geographically weighted regression.Appl. Geogr.2011,31, 292–302. [CrossRef]
31. Li, H.; Wei, Y.D.; Huang, Z. Urban Land Expansion and Spatial Dynamics in Globalizing Shanghai. Sustainability2014,6, 8856–8875. [CrossRef]
32. Braimoh, A.K.; Onishi, T. Spatial determinants of urban land use change in Lagos, Nigeria.Land Use Policy 2007,24, 502–515. [CrossRef]
33. Tan, R.; Liu, Y.; Liu, Y.; He, Q.; Ming, L.; Tang, S. Urban growth and its determinants across the Wuhan urban agglomeration, central China.Habitat Int.2014,44, 268–281. [CrossRef]
34. Sharifi, A.; Chiba, Y.; Okamoto, K.; Yokoyama, S.; Murayama, A. Can master planning control and regulate urban growth in Vientiane, Laos?Landsc. Urban Plan.2014,131, 1–13. [CrossRef]
35. Kivell, P.Land and the City: Patterns and Processes of Urban Change; Psychology Press: London, UK, 1993. 36. Xu, J.; Liao, B.; Shen, Q.; Zhang, F.; Mei, A. Urban Spatial Restructuring in Transitional Economy—Changing
Land Use Pattern in Shanghai China.Chin. Geogr. Sci.2007,17, 19–27. [CrossRef]
37. Zhang, Q.; Wallace, J.; Deng, X.; Seto, K.C. Central versus local states: Which matters more in affecting China’s urban growth?Land Use Policy2014,38, 487–496. [CrossRef]
38. Gao, B.; Liu, W.; Michael, D. State land policy, land markets and geographies of manufacturing: The case of Beijing, China.Land Use Policy2014,36, 1–12.
39. Wu, F.; Zhou, L. Beautiful China: The experience of Jiangsu’s rural village improvement program.Front. Plan. Vis. Futures Hum. Settl.2013, 156–169.
40. Fang, C.; Ma, H.; Wang, J. A Regional Categorization for “New-Type Urbanization” in China.PLoS ONE 2015,10, e0134253. [CrossRef] [PubMed]
41. Liu, Y.; Wang, L.; Long, H. Spatio-temporal analysis of land-use conversion in the eastern coastal China during 1996–2005.J. Geogr. Sci.2008,18, 274–282. [CrossRef]
42. Cohen, P.; Cohen, J.; Aiken, L.S.; West, S.G. The problem of units and the circumstance for POMP. Multivar. Behav. Res.1999,34, 315–346. [CrossRef]
43. Zhang, W.; Wang, W.; Li, X.; Ye, F. Economic development and farmland protection: An assessment of rewarded land conversion quotas trading in Zhejiang, China.Land Use Policy2014,38, 467–476. [CrossRef] 44. Oueslati, W.; Alvanides, S.; Garrod, G. Determinants of urban sprawl in European cities.Urban Stud.2015,
52, 1594–1614. [CrossRef] [PubMed]
45. Yue, W.; Liu, Y.; Fan, P. Polycentric urban development: The case of Hangzhou.Environ. Plan. A2010,42, 563–577. [CrossRef]
46. Wu, F. Polycentric urban development and land-use change in a transitional economy: The case of Guangzhou.Environ. Plan. A1998,30, 1077–1100. [CrossRef]
47. Xu, C.; Liu, M.; Zhang, C.; An, S.; Yu, W.; Chen, J.M. The spatiotemporal dynamics of rapid urban growth in the Nanjing metropolitan region of China.Landsc. Ecol.2007,22, 925–937. [CrossRef]
48. Liu, Y.; Fang, F.; Li, Y. Key issues of land use in China and implications for policy making.Land Use Policy 2014,40, 6–12. [CrossRef]
49. Liu, H.; Zhou, G.; Wennersten, R.; Frostell, B. Analysis of sustainable urban development approaches in China.Habitat Int.2014,41, 24–32. [CrossRef]
50. Fan, J.; Sun, W.; Zhou, K.; Chen, D. Major function oriented zone: New method of spatial regulation for reshaping regional development pattern in China.Chin. Geogr. Sci.2012,22, 196–209. [CrossRef]
51. Zhu, J. From land use right to land development right: Institutional change in China’s urban development. Urban Stud.2004,41, 1249–1267. [CrossRef]
53. Jiang, L.; Deng, X.; Seto, K.C. Multi-level modeling of urban expansion and cultivated land conversion for urban hotspot counties in China.Landsc. Urban Plan.2012,108, 131–139. [CrossRef]
54. Smith, N.R. Beyond top-down/bottom-up: Village transformation on China’s urban edge.Cities2014,41, 209–220. [CrossRef]
55. Huang, B.; Wu, B.; Barry, M. Geographically and temporally weighted regression for modeling spatio-temporal variation in house prices.Int. J. Geogr. Inform. Sci.2010,24, 383–401. [CrossRef]
56. Wang, W.; Yu, J. Estimation of spatial panel data models with time varying spatial weights matrices.Econ. Lett. 2015,128, 95–99. [CrossRef]
57. Elhorst, J.P. Specification and estimation of spatial panel data models.Int. Reg. Sci. Rev.2003,26, 244–268. [CrossRef]