The Global
Gender Gap Report
2017
Insight Report
Insight Report
The Global
Gender Gap Report
2017
The Global Gender Gap Report is an insight tool published annually by the World Economic Forum. The 2017 edition of the Report features a range of unique contextual data through a research collaboration with LinkedIn.
AT THE WORLD ECONOMIC FORUM Professor Klaus Schwab Founder and Executive Chairman Richard Samans
Head of the Centre for the Global Agenda; Member of the Managing Board
Saadia Zahidi
Head of Education, Gender and Work; Member of the Executive Committee Till Alexander Leopold
Project Lead, Education, Gender and Work Vesselina Ratcheva
Data Lead, Education, Gender and Work
AT HARVARD UNIVERSITY Professor Ricardo Hausmann
Director of the Center for International Development (CID) and Professor of the Practice of Economic Development at the Harvard Kennedy School of Government
AT THE UNIVERSITY OF CALIFORNIA, BERKELEY Professor Laura D’Andrea Tyson
Director of the Institute for Business and Social Impact at the Haas School of Business and Chair of the Board of Trustees of the Blum Center for Developing Economies We are very grateful to Milorad Kovacevic, Chief Statistician of the Human Development Report Ofice at the UNDP, and to our colleagues in the Education, Gender and Work System Initiative: Nada Abdoun, Piyamit Bing Chomprasob, Soia Michalopoulou, Paulina Padilla Ugarte, Valerie Peyre, Brittany Robles, Theodore Roos, Pearl Samandari and Susan Wilkinson. We gratefully acknowledge the outstanding support of LinkedIn’s research team, including Nick Eng, Paul Ko, Rachel Bowley, Chris Pham and Jackie Zhao. We also thank Nadiya Stasyshyn and Sue Duke for their institutional engagement and coordination. A special thank you to Michael Fisher for his excellent copyediting work, Neil Weinberg for his superb graphic design and layout, and to Kamal Kimaoui and the World Economic Forum’s Publications team for their invaluable collaboration on the production of this Report. We greatly appreciate, too, the outstanding work of design irms Accurat, which created the Report’s Country Proiles and online Data Explorer, and Graphéine, which created the cover. World Economic Forum
91-93 route de la Capite CH-1223 Cologny/Geneva Switzerland
Tel.: +41 (0)22 869 1212 Fax: +41 (0)22 786 2744 E-mail: [email protected] www.weforum.org
©2017 World Economic Forum All rights reserved.
No part of this publication may be reproduced or transmitted in any form or by any means, including photocopying and recording, or by any information storage and retrieval system. ISBN 978-1-944835-12-5
TERMS OF USE AND DISCLAIMER
The Global Gender Gap Report 2017 (herein: “Report”) presents information and data that were compiled and/or collected by the World Economic Forum (all information and data referred herein as “Data”). Data in this Report is subject to change without notice.
The terms country and nation as used in this report do not in all cases refer to a territorial entity that is a state as understood by international law and practice. The term covers well-deined, geographically self-contained economic areas that may not be states but for which statistical data are maintained on a separate and independent basis.
Although the World Economic Forum takes every reasonable step to ensure that the Data thus compiled and/or collected is accurately relected in this Report, the World Economic Forum, its agents, oficers, and employees: (i) provide the Data
“as is, as available” and without warranty of any kind, either express or implied, including, without limitation, warranties of merchantability, itness for a particular purpose and non- infringement; (ii) make no representations, express or implied, as to the accuracy of the Data contained in this Report or its suitability for any particular purpose; (iii) accept no liability for any use of the said Data or reliance placed on it, in particular, for any interpretation, decisions, or actions based on the Data in this Report.
Other parties may have ownership interests in some of the Data contained in this Report. The World Economic Forum in no way represents or warrants that it owns or controls all rights in all Data, and the World Economic Forum will not be liable to users for any claims brought against users by third parties in connection with their use of any Data.
The World Economic Forum, its agents, oficers, and employees do not endorse or in any respect warrant any third- party products or services by virtue of any Data, material, or content referred to or included in this Report.
Users shall not infringe upon the integrity of the Data and in particular shall refrain from any act of alteration of the Data that intentionally affects its nature or accuracy. If the Data is materially transformed by the user, this must be stated explicitly along with the required source citation.
For Data compiled by parties other than the World Economic Forum, users must refer to these parties’ terms of use, in particular concerning the attribution, distribution, and reproduction of the Data.
When Data for which the World Economic Forum is the source (herein “World Economic Forum”) is distributed or reproduced, it must appear accurately and be attributed to the World Economic Forum. This source attribution requirement is attached to any use of Data, whether obtained directly from the World Economic Forum or from a user.
Users who make World Economic Forum Data available to other users through any type of distribution or download environment agree to make reasonable efforts to communicate and promote compliance by their end users with these terms. Users who intend to sell World Economic Forum Data as part of a database or as a standalone product must irst obtain the permission from the World Economic Forum ([email protected]).
iii The Global Gender Gap Report 2017
v Preface
vii Key Findings
1 PART 1: MEASURING THE GLOBAL GENDER GAP
3 The Global Gender Gap Index 2017
3 Measuring the Global Gender Gap
7 Results and Analysis
25 Progress Over Time
27 Gender Gaps and Income
3 The Case for Gender Parity
27 Closing Occupational Gender Gaps
36 Conclusion
41 Appendices
41 Appendix A: Regional and Income Group Classifications, 2017
43 PART 2: COUNTRY PROFILES
45 User’s Guide: Exploring the Global Gender Gap Index Data
57 List of Countries
58 Country Profiles
347 Contributors
349 System Initiative Partners
Contents
v The Global Gender Gap Report 2017
Talent is one of the most essential factors for growth and
competitiveness. To build future economies that are both
dynamic and inclusive, we must ensure that everyone
has equal opportunity. When women and girls are not
integrated—as both beneficiary and shaper—the global
community loses out on skills, ideas and perspectives that
are critical for addressing global challenges and harnessing
new opportunities.
This report finds that, globally, gender parity is shifting
into reverse this year for the first time since the World
Economic Forum started measuring it. Yet there are also
many countries that have made considerable progress,
understanding that talent is a critical factor for growth.
These countries are poised for further success. This year’s
analysis also reveals gender gaps at the industry level and,
in particular, highlights that even though qualified women
are coming out of the education system, many industries
are failing to hire, retain and promote them, losing out on a
wealth of capacity.
As the world moves from capitalism into the era
of talentism, competitiveness on a national and on a
business level will be decided more than ever before by
the innovative capacity of a country or a company. In this
new context, the integration of women into the talent pool
becomes a must.
While no single measure can capture the complete
situation, the Global Gender Gap Index presented in this
report seeks to measure one important aspect of gender
equality: the relative gaps between women and men
across four key areas: health, education, economy and
politics.
The Index was developed in part to address the need
for a consistent and comprehensive measure for gender
equality that can track a country’s progress over time.
The Index does not seek to set priorities for countries
but, rather, to provide a comprehensive set of data and
a clear method for tracking gaps on critical indicators
so that countries may set priorities within their own
economic, political and cultural contexts. The Index also
points to potential role models by revealing those countries
that—within their region or income group—are leaders in
distributing resources more equitably between women and
men, regardless of the overall level of available resources.
The Forum’s work in the System Initiative on Shaping
the Future of Education, Gender and Work provides
a platform for leaders from all stakeholder groups to
collaborate, devise solutions and share best practices to
close gender gaps. In particular, because progress on
education has not resulted in equivalent gains for women in
earning opportunity, economic independence and
leadership, the Forum’s Closing the Gender Gap project
aims to accelerate the pace of change on gender parity
through global dialogue and a national public-private
cooperation model currently practiced in several future-
ready countries.
On behalf of the Forum, I would like to express my
appreciation to Till Alexander Leopold, Vesselina Ratcheva,
Richard Samans and Saadia Zahidi for their leadership of
this project. We greatly appreciate, too, the innovative data
collaboration with LinkedIn and the ongoing support of
Ricardo Hausmann and Laura D. Tyson. I would also like
to thank the whole team engaged in the System Initiative
on Shaping the Future of Education, Gender and Work
for their support in shaping this project. Finally, we are
inspired by the leadership of the Stewards and Partners of
the System Initiative on Shaping the Future of Education,
Gender and Work.
It is our hope that this latest edition of the report will
serve as a call to action to governments to accelerate
gender equality through bolder policy-making, to
businesses to prioritize gender equality as a critical
economic and moral imperative and to all of us to become
deeply conscious of the choices we make every day that
impact gender equality globally. We call upon every reader
of this report to join these efforts.
Preface
KLAUS SCHWAB
Founder and Executive Chairman, World Economic Forum
vii The Global Gender Gap Report 2017
The Global Gender Gap Index was first introduced by
the World Economic Forum in 2006 as a framework for
capturing the magnitude of gender-based disparities and
tracking their progress over time. This year’s edition of
the Report benchmarks 144 countries on their progress
towards gender parity on a scale from 0 (imparity) to
1 (parity) across four thematic dimensions—Economic
Participation and Opportunity, Educational Attainment,
Health and Survival, and Political Empowerment—
and provides country rankings that allow for effective
comparisons across regions and income groups. The
rankings are designed to create global awareness of the
challenges posed by gender gaps and the opportunities
created by reducing them. The methodology and
quantitative analysis behind the rankings are intended
to serve as a basis for designing effective measures for
reducing gender gaps. The methodology of the Index
has remained stable since its original conception in 2006,
providing a basis for robust cross-country and time-series
analysis.
The 2017 Report’s key findings are:
• Weighted by population, in 2017, the average progress
on closing the global gender gap stands at 68.0%—
meaning an average gap of 32.0% remains to be closed
worldwide across the four Index dimensions in order
to achieve universal gender parity, compared to an
average gap of 31.7% last year.
• On average, the 144 countries covered in the Report
have closed 96% of the gap in health outcomes
between women and men, unchanged since last
year, and more than 95% of the gap in educational
attainment, a slight decrease compared to last year.
However, the gaps between women and men on
economic participation and political empowerment
remain wide: only 58% of the economic participation
gap has been closed—a second consecutive year of
reversed progress and the lowest value measured by
the Index since 2008—and about 23% of the political
gap, unchanged since last year against a long-term
trend of slow but steady improvement.
Key Findings
• Despite this overall mixed picture and continued stalling
of progress at the global level, the situation is more
nuanced at the regional and country level. Out of the
142 countries covered by the Index both this year and
last year, 82 countries have increased their overall
gender gap score compared to last year, while 60
have seen it decrease. By contrast, last year’s Report
found negative outcomes in more than half of countries
surveyed. Moreover, as detailed in the Report, a
number of countries and regions have crossed symbolic
milestones on the path to gender parity for the first time
this year.
• Although this year’s edition of the Global Gender Gap
Index sees no new entrants to its top 10 list, there have
been notable rank changes. The top spots continue
to be held by smaller Western European countries,
particularly the Nordics that occupy the top three
positions, with two countries from the East Asia and
the Pacific region, one country from the Sub-Saharan
Africa region, one country from the Latin America and
the Caribbean region, and one country from the Eastern
Europe and Central Asia region also represented. All but
three countries in the Index top 10 have now crossed
the threshold of closing more than 80% of their overall
gender gap—up from five both last year and in 2015.
• At a global level, in 2017 four regions have a remaining
gender gap of less than 30%—two of which are
crossing this threshold for the first time this year.
Western Europe records a remaining gender gap of
25%, placing it ahead of North America, with a gap of
28%, Eastern Europe and Central Asia, with a gap of
29%, and Latin America and the Caribbean, with a gap
of 29.8%. The East Asia and the Pacific region ranks
ahead of Sub-Saharan Africa, with a remaining gender
gap of 31.7% and 32.4%, respectively, and South Asia,
with a gap of 34%. The Middle East and North Africa
region, for the first time this year, crosses the threshold
of having a remaining gender gap of slightly less than
40%.
viii The Global Gender Gap Report 2017
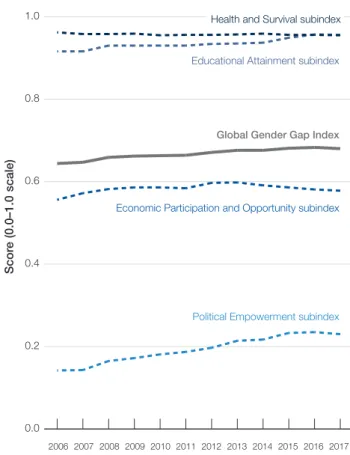
• On current trends, the overall global gender gap can be
closed in exactly 100 years across the 106 countries
covered since the inception of the Report, compared to
83 years last year. The most challenging gender gaps
remain in the economic and health spheres. Given the
continued widening of the economic gender gap, it will
now not be closed for another 217 years. However, the
education–specific gender gap could be reduced to
parity within the next 13 years. The political dimension
currently holds the widest gender gap and is also the
one exhibiting the most progress, despite a slowdown
in progress this year. It could be closed within 99 years.
The health gender gap is larger than it stood in 2006.
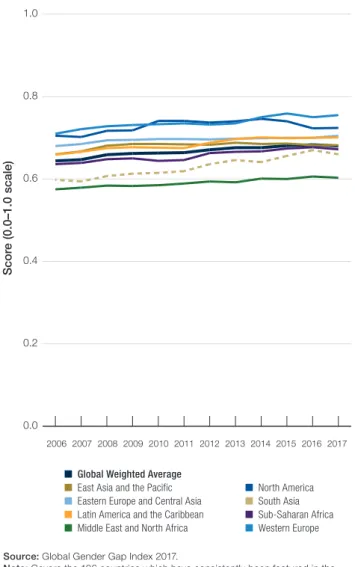
• While all world regions record a narrower gender gap
than they did 11 years ago, more efforts will continue to
be needed to accelerate progress. At the current rate of
progress, the overall global gender gap can be closed
in 61 years in Western Europe, 62 years in South Asia,
79 years in Latin America and the Caribbean, 102 years
in Sub-Saharan Africa, 128 years in Eastern Europe and
Central Asia, 157 years in the Middle East and North
Africa, 161 years in East Asia and the Pacific, and 168
years in North America.
• A variety of models and empirical studies have
suggested that improving gender parity may result in
significant economic dividends, which vary depending
on the situation of different economies and the specific
challenges they are facing. Notable recent estimates
suggest that economic gender parity could add an
additional US$250 billion to the GDP of the United
Kingdom, US$1,750 billion to that of the United States,
US$550 billion to Japan’s, US$320 billion to France’s
and US$310 billion to the GDP of Germany. Other
recent estimates suggest that China could see a
US$2.5 trillion GDP increase from gender parity and
that the world as a whole could increase global GDP
by US$5.3 trillion by 2025 by closing the gender gap in
economic participation by 25% over the same period.
• A key avenue for further progress is the closing of
occupational gender gaps. These gaps often reflect
a myriad set of factors that require adjustments
within the education sector, within companies and by
policymakers. In a research collaboration with LinkedIn,
the Report finds that men are distinctively under-
represented in Education and Health and Welfare, while
women are strongly under-represented in Engineering,
Manufacturing and Construction and Information,
Communication and Technology. Fair returns to skills
and the availability of deeper talent pools are disrupted
by existing gender biases—and the fields most
affected, such as the care economy and the emerging
technology sector, are losing out on the benefits of
diversity.
Part 1
Measuring the
Global Gender Gap
3 The Global Gender Gap Report 2017
The Global Gender Gap Index was first introduced by
the World Economic Forum in 2006 as a framework for
capturing the magnitude of gender-based disparities and
tracking their progress over time. The Index benchmarks
national gender gaps on economic, education, health
and political criteria, and provides country rankings
that allow for effective comparisons across regions and
income groups. The rankings are designed to create
global awareness of the challenges posed by gender
gaps and the opportunities created by reducing them. The
methodology and quantitative analysis behind the rankings
are intended to serve as a basis for designing effective
measures for reducing gender gaps.
Last year’s 11th edition introduced a number of
updated elements—namely, a higher threshold for
calculating gender gaps in estimated earned income, a
revised regional classification, and a refreshed visualization
of results—to evolve the Global Gender Gap Index for
its second decade. This year’s 12th edition continues
to build on the well-established strengths of the Report
by introducing an innovative online Data Explorer tool,
available on the Report website (http://reports.weforum.
org/global-gender-gap-report-2017/dataexplorer), which
enables readers to directly compare patterns of gender-
based inequities between countries as well as explore
comprehensive rankings by indicator, region and subindex.
The first part of this chapter reviews the underlying
concepts employed in creating the Global Gender Gap
Index and outlines the methods used to calculate it. The
second part presents the 2017 rankings, overall trends,
regional performance and notable country cases. It
also provides information on progress over time and
progress within income groups. Next, the Report lays
out the economic case for gender parity, with a focus on
the growing evidence of inter-linkages between gender
gaps and the future economic prospects and resilience
of industries and countries. Finally, the fourth part of this
chapter takes a deeper look at gender parity trends across
industries, presenting a range of innovative data about
evolving hiring trends and gender gaps in skills and fields
of study, based on a research collaboration with LinkedIn.
The Country Profiles contained in Part 2 of this Report
give a more detailed picture of the relative strengths and
weaknesses of each country’s performance compared
with that of other nations and relative to its own past
performance. The first page of each profile contains key
demographic and economic indicators as well as detailed
information on the country’s performance in both 2017
and in the year in which it was first featured in the Report.
The second page of the Country Profiles highlights more
than 70 gender-related indicators that provide a fuller
context for the country’s performance. These indicators
include information on workforce participation, economic
leadership, access to assets and technology, political
leadership, family, the care economy, education and
skills, and health-related factors. Interactive versions of
the Country Profiles are available on the Report website,
as part of the Report’s online Data Explorer tool (http://
reports.weforum.org/global-gender-gap-report-2017/
dataexplorer).
Measuring the Global
Gender Gap
The methodology of the Index has remained stable since
its original conception in 2006, providing a basis for robust
cross-country and time-series analysis. Last year’s edition
introduced an updated threshold for estimating gender
parity in earned income, adjusting the income level cap to
The Global Gender Gap
Index 2017
4 The Global Gender Gap Report 2017
better reflect contemporary costs of living and bringing the
Index in line with the latest thinking and methodology of
statistical reports by the United Nations and others. This
year’s edition removes this income level cap completely
and also updates its primary reference source for the sex
ratio at birth indicator. Sensitivity analysis of both changes
finds their impact on overall country scores and ranks to be
minimal.
1Three underlying concepts
There are three basic concepts underlying the Global
Gender Gap Index, forming the basis of how indicators
were chosen, how the data is treated and the scale
used. First, the Index focuses on measuring gaps
rather than levels. Second, it captures gaps in outcome
variables rather than gaps in input variables. Third, it
ranks countries according to gender equality rather than
women’s empowerment. These three concepts are briefly
outlined below. For a description of how these concepts
are captured by the construction techniques used in the
creation of the Index, please see the Construction of the
Index section below.
Gaps vs. levels
The Index is designed to measure gender-based gaps
in access to resources and opportunities in countries
rather than the actual levels of the available resources and
opportunities in those countries. We do this to disassociate
the Global Gender Gap Index from countries’ levels of
development. In other words, the Index is constructed
to rank countries on their gender gaps not on their
development level. For example, rich countries, generally
speaking, are able to offer more education and health
opportunities to all members of society, although this is
quite independent of the gender-related gaps that may
exist within those higher levels of health or education. The
Global Gender Gap Index rewards countries for smaller
gaps in access to these resources, regardless of the overall
level of resources. Thus, in the case of education, the Index
penalizes or rewards countries based on the size of the
gap between male and female enrolment rates, but not for
the overall levels of education in the country.
Outcomes vs. inputs
The second basic concept underlying the Global Gender
Gap Index is that it evaluates countries based on outcomes
Table 1: Structure of the Global Gender Gap Index
Subindex Variable Source
Economic Participation and Opportunity
Ratio: female labour force participation over male value International Labour Organization, ILOSTAT database, 2016 or latest available data
Wage equality between women and men for similar work (survey data, normalized on a 0-to-1 scale)
World Economic Forum, Executive Opinion Survey (EOS), 2016-17
Ratio: female estimated earned income over male value World Economic Forum calculations based on the United Nations Development Programme methodology (refer to Human Development Report 2007/2008)
Ratio: female legislators, senior officials and managers over male value
International Labour Organization, ILOSTAT database, 2016 or latest available data
Ratio: female professional and technical workers over male value
International Labour Organization, ILOSTAT database, 2016 or latest available data
Educational Attainment Ratio: female literacy rate over male value United Nations Educational, Scientific and Cultural Organization (UNESCO) Institute for Statistics, Education indicators, database, 2016 or latest available data Ratio: female net primary enrolment rate over male value UNESCO Institute for Statistics, Education indicators
database, 2016 or latest available data Ratio: female net secondary enrolment rate over male
value
UNESCO Institute for Statistics, Education indicators database, 2016 or latest available data
Ratio: female gross tertiary enrolment ratio over male value
UNESCO Institute for Statistics, Education indicators database, 2016 or latest available data
Health and Survival Sex ratio at birth (converted to female-over-male ratio) United Nations Population Division, World Population Prospects, 2016 or latest available data
Ratio: female healthy life expectancy over male value World Health Organization, Global Health Observatory database, 2015 or latest available data
Political Empowerment Ratio: females with seats in parliament over male value Inter-Parliamentary Union, Women in Politics: 2017, reflecting elections/appointments up to 1 June 2017 Ratio: females at ministerial level over male value Inter-Parliamentary Union, Women in Politics: 2017,
reflecting appointments up to 1 January 2017 Ratio: number of years with a female head of state (last
50 years) over male value
World Economic Forum calculations, reflecting situation as of 30 June 2017
5 The Global Gender Gap Report 2017
rather than inputs or means. Our aim is to provide a
snapshot of where men and women stand with regard to
some fundamental outcome indicators related to basic
rights such as health, education, economic participation
and political empowerment. Indicators related to country-
specific policies, rights, culture or customs—factors that we
consider “input” or “means” indicators—are not included
in the Index, but they are discussed further in the analytic
sections of this chapter, as well as being featured in the
Report’s Country Profiles. For example, the Index includes
an indicator comparing the gap between men and women
in high-skilled jobs such as legislators, senior officials and
managers (an outcome indicator) but does not include
data on the length of maternity leave (a policy indicator).
This approach has contributed significantly to the Index’s
distinctiveness over the years and, we believe, continues to
provide the most objective basis for discussing underlying
contextual factors.
2Gender equality vs. women’s empowerment
The third distinguishing feature of the Global Gender Gap
Index is that it ranks countries according to their proximity
to gender equality rather than to women’s empowerment.
Our aim is to focus on whether the gap between women
and men in the chosen indicators has declined, rather than
whether women are winning the so-called “battle of the
sexes”. Hence, the Index rewards countries that reach the
point where outcomes for women equal those for men,
but it neither rewards nor penalizes cases in which women
are outperforming men in particular indicators in some
countries. Thus, a country that has higher enrolment for
girls rather than boys in secondary school will score equal
to a country where boys’ and girls’ enrolment is the same.
The four subindexes
The Global Gender Gap Index examines the gap
between men and women in four fundamental categories
(subindexes): Economic Participation and Opportunity,
Educational Attainment, Health and Survival and
Political Empowerment. Table 1 (page 5) displays all four
of these subindexes and the 14 different indicators that
compose them, along with the sources of data used for
each.
Economic Participation and Opportunity
This subindex contains three concepts: the participation
gap, the remuneration gap and the advancement gap. The
participation gap is captured using the difference between
women and men in labour force participation rates. The
remuneration gap is captured through a hard data indicator
(ratio of estimated female-to-male earned income)
3and a
qualitative indicator gathered through the World Economic
Forum’s annual Executive Opinion Survey (wage equality
for similar work). Finally, the gap between the advancement
of women and men is captured through two hard data
statistics (the ratio of women to men among legislators,
senior officials and managers, and the ratio of women to
men among technical and professional workers).
Educational Attainment
This subindex captures the gap between women’s and
men’s current access to education through ratios of
women to men in primary-, secondary- and tertiary-level
education. A longer-term view of the country’s ability to
educate women and men in equal numbers is captured
through the ratio of the female literacy rate to the male
literacy rate.
Health and Survival
This subindex provides an overview of the differences
between women’s and men’s health through the use of
two indicators. The first is the sex ratio at birth, which
aims specifically to capture the phenomenon of “missing
women”, prevalent in many countries with a strong son
preference.
4Second, we use the gap between women’s
and men’s healthy life expectancy. This measure provides
an estimate of the number of years that women and men
can expect to live in good health by taking into account
the years lost to violence, disease, malnutrition and other
relevant factors.
Political Empowerment
This subindex measures the gap between men and women
at the highest level of political decision-making through the
ratio of women to men in ministerial positions and the ratio
of women to men in parliamentary positions. In addition,
we’ve included the ratio of women to men in terms of
years in executive office (prime minister or president)
for the last 50 years. A clear drawback in this category
is the absence of any indicators capturing differences
between the participation of women and men at local
levels of government. Should such data become available
at a globally comparative level in future years, it will be
considered for inclusion in the Index.
Construction of the Index
The overall Global Gender Gap Index is constructed
using a four-step process, outlined below. Some of the
indicators listed in Table 1 require specific standardization
or modification in order to be used in the Index. For further
information on the indicator-specific calculations, please
refer to the User’s Guide: Exploring the Global Gender Gap
Index Data section in Part 2 of this Report.
1. Convert to ratios
Initially, all data is converted to female-to-male ratios.
For example, a country with 20% of women in ministerial
positions is assigned a ratio of 20 women to 80 men, thus
a value of 0.25. This is to ensure that the Index is capturing
gaps between women and men’s attainment levels, rather
than the levels themselves.
6 The Global Gender Gap Report 2017
2. Truncate data at equality benchmark
As a second step, these ratios are truncated at the
“equality benchmark”. For all indicators, except the two
health indicators, this equality benchmark is considered to
be 1, meaning equal numbers of women and men. In the
case of sex ratio at birth, the equality benchmark is set
at 0.944
5, and in the case of healthy life expectancy the
equality benchmark is set at 1.06.
6Truncating the data at
the equality benchmarks for each assigns the same score
to a country that has reached parity between women and
men and one where women have surpassed men.
The type of rating scale chosen determines whether
the Index is rewarding women’s empowerment or gender
equality.
7To capture gender equality, two possible scales
were considered. One was a negative-positive scale
capturing the size and direction of the gender gap. This
scale penalizes either men’s advantage over women or
women’s advantage over men, and gives the highest points
to absolute equality. The second choice was a one-sided
scale that measures how close women are to reaching
parity with men, but does not reward or penalize countries
for having a gender gap in the other direction. We find the
one-sided scale more appropriate for our purposes, as it
does not reward countries for having exceeded the parity
benchmark. However, disparities in either direction are
recorded in the Country Profiles.
3. Calculate subindex scores
The third step in the process involves calculating the
weighted average of the indicators within each subindex
to create the subindex scores. Averaging the different
indicators would implicitly give more weight to the measure
Table 2: Calculation of weights within each subindex
Economic Participation and Opportunity Subindex
Ratio Standard deviation
Standard deviation
per 1% point change Weight
Female labour force participation over male value 0.160 0.063 0.199
Wage equality between women and men for similar work 0.103 0.097 0.310
Female estimated earned income over male value 0.144 0.069 0.221
Female legislators, senior officials and managers over male value 0.214 0.047 0.149
Female professional and technical workers over male value 0.262 0.038 0.121
TOTAL ...1
Educational Attainment Subindex
Ratio Standard deviation
Standard deviation
per 1% point change Weight
Female literacy rate over male value 0.145 0.069 0.191
Female net primary enrolment rate over male value 0.060 0.167 0.459
Female net secondary enrolment rate over male value 0.120 0.083 0.230
Female gross tertiary enrolement ratio over male value 0.228 0.044 0.121
TOTAL ...1
Health and Survival Subindex
Ratio Standard deviation
Standard deviation
per 1% point change Weight
Sex ratio at birth (converted to female-over-male ratio) 0.010 0.998 0.693
Female healthy life expectancy over male value 0.023 0.441 0.307
TOTAL ...1
Political Empowerment Subindex
Ratio Standard deviation
Standard deviation
per 1% point change Weight
Females with seats in parliament over male value 0.166 0.060 0.310
Females at ministerial level over male value 0.208 0.048 0.247
Number of years with a female head of state (last 50 years) over male value 0.116 0.086 0.443
TOTAL ...1
Note: Calculations are based on the Global Gender Gap Report 2006.
7 The Global Gender Gap Report 2017
that exhibits the largest variability or standard deviation. We
therefore first normalize the indicators by equalizing their
standard deviations. For example, within the Educational
Attainment subindex, standard deviations for each of the
four indicators are calculated. Then we determine what a
1% point change would translate to in terms of standard
deviations by dividing 0.01 by the standard deviation for
each indicator. These four values are then used as weights
to calculate the weighted average of the four indicators.
This way of weighting indicators allows us to make
sure that each indicator has the same relative impact
on the subindex. For example, an indicator with a small
variability or standard deviation, such as primary enrolment
rate, gets a larger weight within the Educational Attainment
subindex than an indicator with a larger variability, such as
tertiary enrolment rate. Therefore, a country with a large
gender gap in primary education (an indicator where most
countries have achieved near-parity between women and
men) will be more heavily penalized. Similarly, in the case
of the sex ratio at birth indicator (within the Health and
Survival subindex), where most countries have a very high
sex ratio and the spread of the data is small, the larger
weight will penalize more heavily those countries that
deviate from this value. Table 2 displays the values of the
weights used.
84. Calculate inal scores
For of all subindexes, the highest possible score is 1
(parity) and the lowest possible score is 0 (imparity),
thus binding the scores between inequality and equality
benchmarks.
9An unweighted average of each subindex
score is used to calculate the overall Global Gender Gap
Index score. Similar to subindex scores, this final value
ranges between 1 (parity) and 0 (imparity), thus allowing
for comparisons relative to ideal standards of equality
in addition to relative country rankings.
10The parity and
imparity benchmarks remain fixed across time, allowing
the reader to track individual country progress in relation
to an ideal standard of equality. Furthermore, the option of
roughly interpreting the final Index scores as a percentage
value that reveals how a country has reduced its gender
gap should help make the Index more intuitively appealing
to readers.
11Results and analysis
Country Coverage, 2017
We aim to include a maximum number of countries in the
Report every year, within the constraints posed by data
availability. To be included in the Report, a country must
have data available for a minimum of 12 indicators out of
the 14 that make up the Index. In 2017, we have been able
to include 144 countries in the Report. Of these, 106 have
consistently been included in the Report every year since
the first edition published in 2006.
Nearly 200 countries were considered for inclusion
in the Index this year. Out of the 144 ultimately covered in
this Report, 23 countries had one data point missing and,
in addition, seven further countries had two data points
missing. Missing data is clearly marked on each relevant
Country Profile. This year’s Report features one new
country never previously covered by the Index, Myanmar,
and one country not covered in last year’s edition, Fiji.
The Global Gender Gap Report groups countries into
eight broader geographical groupings: East Asia and the
Pacific; Eastern Europe and Central Asia; Latin America
and the Caribbean; Middle East and North Africa; North
America; South Asia; Sub-Saharan Africa; and Western
Europe. The classification of countries according to these
categories is detailed in Appendix A.
Global Results
Figure 1 provides a global snapshot of the gender gap
in the four subindexes. It shows that, on average, the
144 countries covered in the Report have closed 96% of
the gap in health outcomes between women and men,
unchanged since last year, and more than 95% of the gap
in educational attainment, a slight decrease compared to
Source: Global Gender Gap Index 2017.
Note: Covers all 144 countries featured in the 2017 index.
Figure 1: Global performance, 2017
Political Empowerment subindex
Health and Survival subindex
Educational Attainment subindex
Economic Participation and Opportunity subindex
Global Gender Gap Index 68%
58%
95%
96%
23%
8 The Global Gender Gap Report 2017
last year, which marked the highest value ever measured
for this subindex. However, the gaps between women and
men on economic participation and political empowerment
remain wide: only 58% of the economic participation gap
has been closed—a second consecutive year of reversed
progress and the lowest value measured by the Index since
2008—and about 23% of the political gap, unchanged
since last year against a long-term trend of slow but steady
improvement. Weighted by population, in 2017, the average
progress on closing the global gender gap stands at a
score of 0.680—which means that an average gap of 32%
remains to be closed worldwide across the four Index
dimensions in order to achieve universal gender parity. Last
year that average gap was 31.7%.
Despite this overall mixed picture and continued
stalling of progress at the global level, the situation is more
nuanced at the regional and country level. Out of the 142
countries covered by the Index both this year and last year,
82 countries have increased their overall gender gap score
compared to last year, while 60 have seen it decrease. By
contrast, last year’s Report had found negative outcomes
in more than half of countries surveyed. Moreover, as
detailed in the following sections of the Report, while a
number of countries and regions have crossed symbolic
milestones on the path to gender parity for the first
time this year, a number of major economies and high-
population countries have experienced reversals on their
past progress this year.
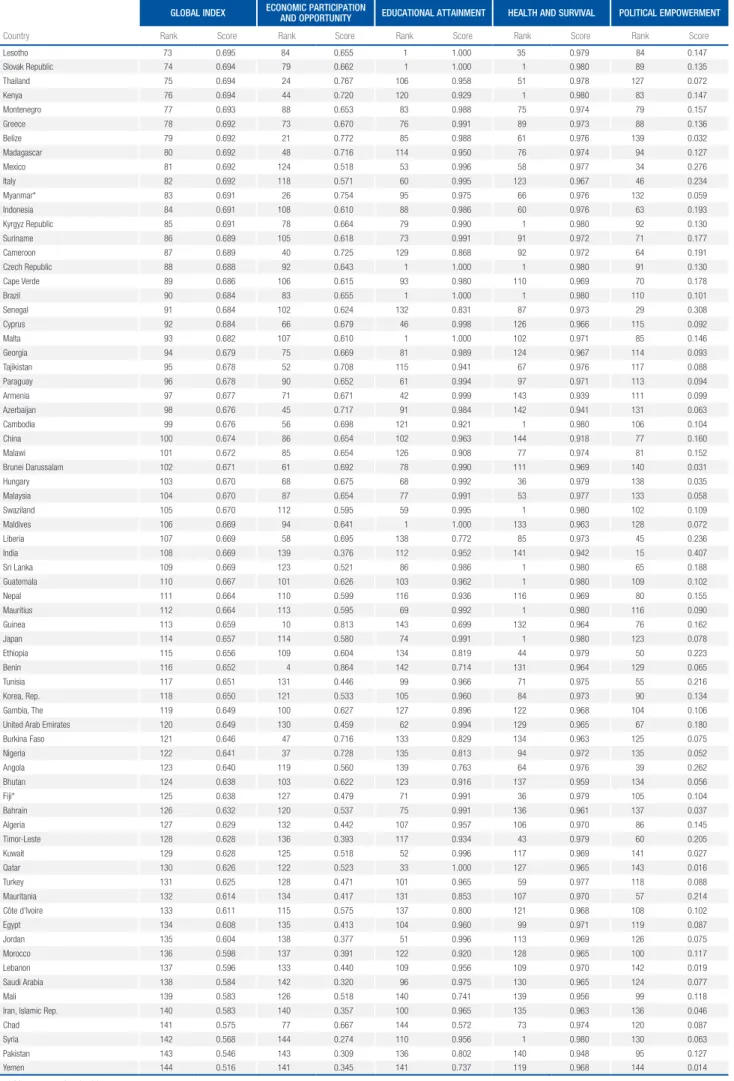
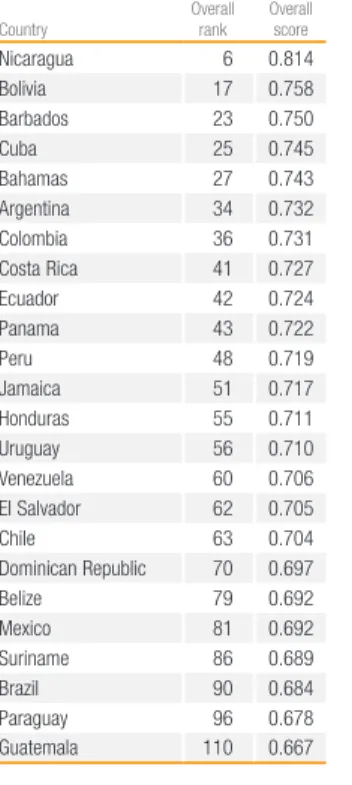
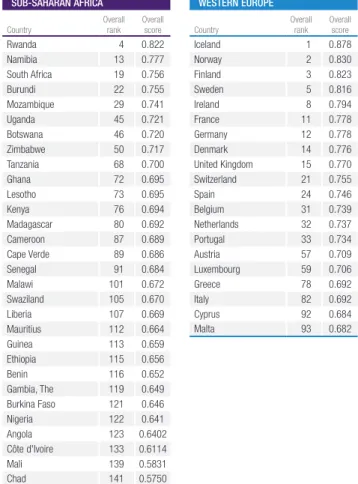
Table 3 (page 10) displays the 2017 Index and
subindex rankings, organized from highest to lowest by
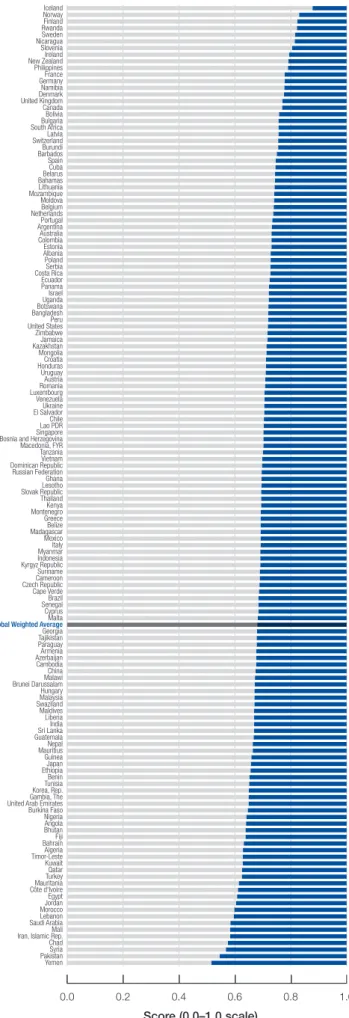
rank on the overall Index. Figure 2 visualizes the 2017
overall Index results, organized by size of countries’ overall
gender gaps left to be closed. No country in the world has
fully closed its gender gap, but four out of the five Nordic
countries and, for the first time this year, one country
each from the Sub-Saharan Africa, Latin America and the
Caribbean and Eastern Europe and Central Asia regions—
Rwanda, Nicaragua and Slovenia—have closed more than
80% of theirs. Yemen, the lowest-ranking country, has
closed slightly less than 52% of its gender gap. For further
analysis, refer to the Performance by Subindex, Top 10,
and Performance by Region and Country sections.
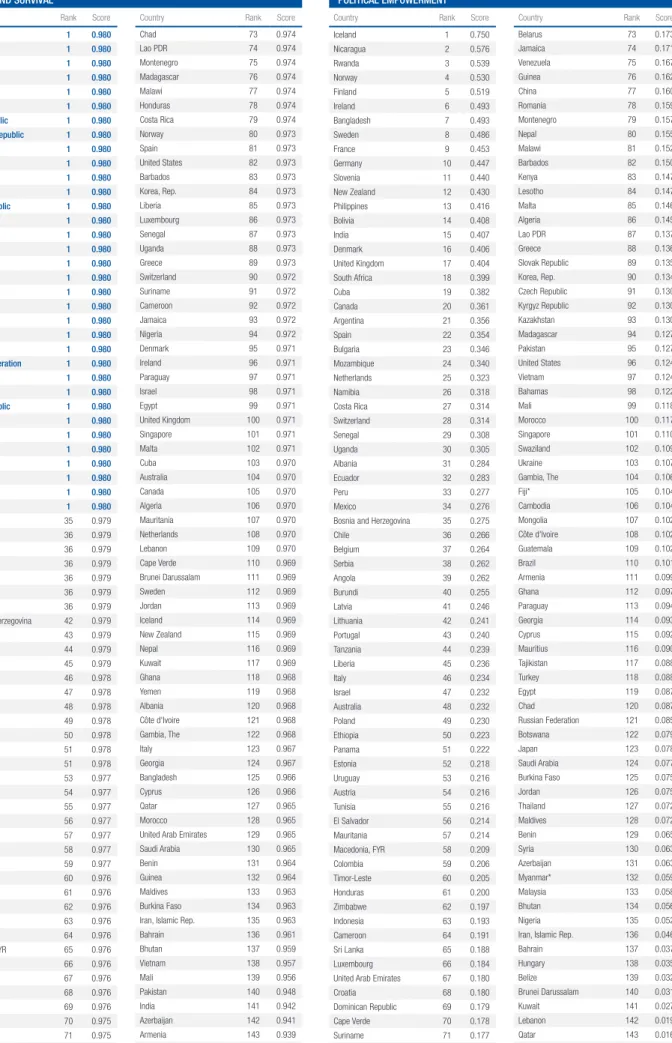
Performance by Subindex
Table 4 (page 12) displays the rankings by subindex,
organized highest to lowest by rank per subindex. On the
Economic Participation and Opportunity subindex,
13 countries (two more than last year), including six from
Sub-Saharan Africa—Burundi, Benin, Botswana, Rwanda,
Namibia and Guinea—and two Nordic countries—Norway
and Sweden—have closed more than 80% of their gap.
However, 18 countries (13 from the Middle East and North
Africa region) have closed less than 50% of the gap for
this subindex, with Pakistan and Syria holding the last
two spots. Thirty-one countries have scores below the
world average (0.585, weighted by population) on this
Figure 2: Gender gap by country, 2017
0.0 0.2 0.4 0.6 0.8 1.0
Yemen PakistanSyria Chad Iran, Islamic Rep.Mali Saudi ArabiaLebanon MoroccoJordan Egypt Côte d'IvoireMauritania TurkeyQatar Kuwait Timor-LesteAlgeria BahrainFiji BhutanAngola Nigeria Burkina Faso United Arab EmiratesGambia, TheKorea, Rep.Tunisia Benin EthiopiaJapan Guinea MauritiusNepal GuatemalaSri Lanka India Liberia Maldives SwazilandMalaysia Hungary Brunei DarussalamMalawi China Cambodia AzerbaijanArmenia ParaguayTajikistan Georgia Global Weighted AverageMalta Cyprus SenegalBrazil Cape Verde Czech RepublicCameroon Suriname Kyrgyz RepublicIndonesia MyanmarItaly Mexico MadagascarBelize Greece MontenegroKenya Thailand Slovak RepublicLesotho Ghana Russian Federation Dominican RepublicVietnam Tanzania Macedonia, FYR Bosnia and HerzegovinaSingapore Lao PDRChile El SalvadorUkraine Venezuela LuxembourgRomania Austria Uruguay HondurasCroatia Mongolia KazakhstanJamaica Zimbabwe United StatesPeru BangladeshBotswana UgandaIsrael Panama Ecuador Costa RicaSerbia Poland AlbaniaEstonia ColombiaAustralia ArgentinaPortugal NetherlandsBelgium Moldova MozambiqueLithuania BahamasBelarus SpainCuba BarbadosBurundi SwitzerlandLatvia South AfricaBulgaria Bolivia Canada United KingdomDenmark Namibia GermanyFrance Philippines New ZealandIreland Slovenia NicaraguaSweden RwandaFinland NorwayIceland
Score (0.0–1.0 scale)
Source: Global Gender Gap Index 2017.
9 The Global Gender Gap Report 2017
subindex. The Report’s Country Profiles include a wide
range of additional contextual data, including on workforce
participation, economic leadership, access to assets and
technology, and the care economy.
In 2017, 27 countries have fully closed the gap on the
Educational Attainment subindex, three countries more
than last year. Benin, Guinea and Chad hold the last three
spots on this subindex, with Chad having closed less than
60% of its education gender gap. In total, there are 18
countries where women still have less than 90% of the
education outcomes that men have—one less than last
year but a continued improvement over 2015, when this
was still the case for 22 countries. Thirty-three countries
have scores below the world average (0.953, weighted by
population) on this subindex. While the Index takes into
account four key indicators to measure the gender gap on
education outcomes, the Report’s Country Profiles provide
information on additional gaps between women and men—
on out-of-school children of primary and secondary school
age, education attainment rates, advanced and vocational
degrees, and gender gaps across various fields of study.
Thirty-four countries (four less than last year) have
fully closed their gender gap on the Health and Survival
subindex. Azerbaijan, Armenia and China are the lowest-
ranked countries, and no country currently has a gap
bigger than 90% on this subindex. Only six countries
have scores below the world average (0.956, weighted by
population) on this subindex. While the Index takes into
account two key measures of gender gaps, this year’s
Country Profiles present additional contextual data that
reveals differences between female and male health
outcomes from infectious disease, non-communicable
disease, accidental and intentional injuries and self-
harm. Additionally, the Country Profiles contain detailed
information on maternal health and domestic violence.
On the Political Empowerment subindex, only
Iceland has closed more than 70% of its gender gap. While
no other country has currently closed more than 60%
of its gender gap, four countries—Nicaragua, Rwanda,
Norway and Finland—have crossed the 50% threshold,
while 34 countries, from across all world regions, have
closed less than 10% of their gap (five less than last year).
Lebanon, Qatar and Yemen have the lowest rankings
on this subindex, having closed less than 2% of their
political gender gap. Weighted by population, 95 countries
rank below the subindex world average (0.227) this year.
In addition to the indicators included in the Index, the
Country Profiles present detailed information on women’s
political participation, such as the number of years since
the establishment of women’s suffrage, female heads of
government to date, and the existence of voluntary political
party quotas.
This year, the only countries to have fully closed their
gaps on both the Health and Survival and Educational
Attainment subindexes are five nations from the Eastern
Europe and Central Asia region—Czech Republic, Latvia,
Lithuania, Slovak Republic and Slovenia—as well as
Brazil. No country has yet fully closed either its Economic
Participation and Opportunity or Political Empowerment
subindex gaps.
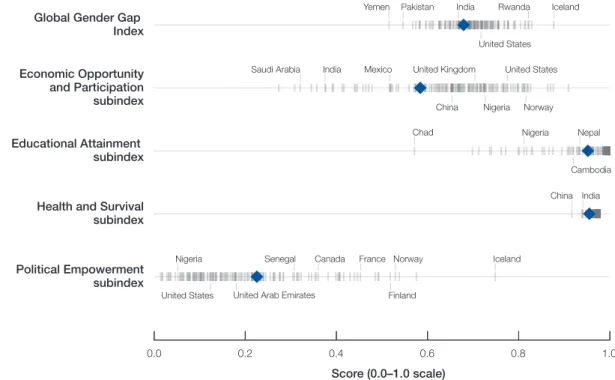
Figure 3 illustrates the range of country scores for the
four subindexes. The population-weighted average for each
subindex is highlighted by blue diamonds. The Educational
Attainment subindex is closing in on the Health and
0.0 0.2 0.4 0.6 0.8 1.0
Global Gender Gap
Index
Political Empowerment
subindex
Health and Survival
subindex
Economic Opportunity
and Participation
subindex
Educational Attainment
subindex
Score (0.0–1.0 scale)
Saudi Arabia
Pakistan
India
India
India Rwanda Iceland
Chad
United States
Nigeria Nepal Yemen
Iceland Norway
Cambodia Nigeria
United Arab Emirates Finland
Nigeria
China Mexico
France Senegal Canada
United States
Norway
United Kingdom
China United States
Figure 3: Range of scores, Global Gender Gap Index and subindexes, 2017
Source: Global Gender Gap Index 2017.
Note: Blue diamonds correspond to subindex averages.
10 The Global Gender Gap Report 2017
Table 3: Global rankings, 2017
GLOBAL INDEX ECONOMIC PARTICIPATION
AND OPPORTUNITY EDUCATIONAL ATTAINMENT HEALTH AND SURVIVAL POLITICAL EMPOWERMENT
Country Rank Score Rank Score Rank Score Rank Score Rank Score
Iceland 1 0.878 14 0.798 57 0.995 114 0.969 1 0.750
Norway 2 0.830 8 0.816 38 0.999 80 0.973 4 0.530
Finland 3 0.823 16 0.793 1 1.000 46 0.978 5 0.519
Rwanda 4 0.822 7 0.820 113 0.951 1 0.980 3 0.539
Sweden 5 0.816 12 0.809 37 0.999 112 0.969 8 0.486
Nicaragua 6 0.814 54 0.702 34 1.000 1 0.980 2 0.576
Slovenia 7 0.805 13 0.801 1 1.000 1 0.980 11 0.440
Ireland 8 0.794 50 0.710 1 1.000 96 0.971 6 0.493
New Zealand 9 0.791 23 0.768 43 0.998 115 0.969 12 0.430
Philippines 10 0.790 25 0.764 1 1.000 36 0.979 13 0.416
France 11 0.778 64 0.683 1 1.000 54 0.977 9 0.453
Germany 12 0.778 43 0.720 98 0.970 70 0.975 10 0.447
Namibia 13 0.777 9 0.813 41 0.999 1 0.980 26 0.318
Denmark 14 0.776 36 0.728 1 1.000 95 0.971 16 0.406
United Kingdom 15 0.770 53 0.705 36 0.999 100 0.971 17 0.404
Canada 16 0.769 29 0.744 1 1.000 105 0.970 20 0.361
Bolivia 17 0.758 60 0.692 108 0.956 69 0.976 14 0.408
Bulgaria 18 0.756 51 0.710 80 0.990 36 0.979 23 0.346
South Africa 19 0.756 89 0.652 64 0.993 1 0.980 18 0.399
Latvia 20 0.756 15 0.798 1 1.000 1 0.980 41 0.246
Switzerland 21 0.755 31 0.743 63 0.993 90 0.972 28 0.314
Burundi 22 0.755 1 0.911 128 0.876 1 0.980 40 0.255
Barbados 23 0.750 2 0.877 1 1.000 83 0.973 82 0.150
Spain 24 0.746 81 0.657 45 0.998 81 0.973 22 0.354
Cuba 25 0.745 99 0.629 1 1.000 103 0.970 19 0.382
Belarus 26 0.744 5 0.827 35 0.999 45 0.979 73 0.173
Bahamas 27 0.743 3 0.871 1 1.000 50 0.978 98 0.122
Lithuania 28 0.742 28 0.749 1 1.000 1 0.980 42 0.241
Mozambique 29 0.741 17 0.789 130 0.857 56 0.977 24 0.340
Moldova 30 0.740 11 0.811 66 0.992 1 0.980 72 0.176
Belgium 31 0.739 46 0.716 1 1.000 63 0.976 37 0.264
Netherlands 32 0.737 82 0.657 1 1.000 108 0.970 25 0.323
Portugal 33 0.734 35 0.730 70 0.992 55 0.977 43 0.240
Argentina 34 0.732 111 0.596 44 0.998 1 0.980 21 0.356
Australia 35 0.731 42 0.724 1 1.000 104 0.970 48 0.232
Colombia 36 0.731 32 0.740 30 1.000 1 0.980 59 0.206
Estonia 37 0.731 38 0.726 1 1.000 36 0.979 52 0.218
Albania 38 0.728 70 0.673 87 0.986 120 0.968 31 0.284
Poland 39 0.728 55 0.702 31 1.000 1 0.980 49 0.230
Serbia 40 0.727 72 0.670 47 0.997 1 0.980 38 0.262
Costa Rica 41 0.727 104 0.620 40 0.999 79 0.974 27 0.314
Ecuador 42 0.724 93 0.642 54 0.996 57 0.977 32 0.283
Panama 43 0.722 62 0.691 55 0.995 1 0.980 51 0.222
Israel 44 0.721 65 0.681 1 1.000 98 0.971 47 0.232
Uganda 45 0.721 59 0.693 124 0.913 88 0.973 30 0.305
Botswana 46 0.720 6 0.822 1 1.000 48 0.978 122 0.079
Bangladesh 47 0.719 129 0.465 111 0.954 125 0.966 7 0.493
Peru 48 0.719 98 0.632 82 0.988 49 0.978 33 0.277
United States 49 0.718 19 0.776 1 1.000 82 0.973 96 0.124
Zimbabwe 50 0.717 49 0.710 89 0.986 68 0.976 62 0.197
Jamaica 51 0.717 39 0.725 1 1.000 93 0.972 74 0.171
Kazakhstan 52 0.713 30 0.744 48 0.997 36 0.979 93 0.130
Mongolia 53 0.713 20 0.776 65 0.993 1 0.980 107 0.102
Croatia 54 0.711 63 0.689 58 0.995 1 0.980 68 0.180
Honduras 55 0.711 74 0.669 29 1.000 78 0.974 61 0.200
Uruguay 56 0.710 91 0.645 32 1.000 1 0.980 53 0.216
Austria 57 0.709 80 0.660 84 0.988 72 0.975 54 0.216
Romania 58 0.708 57 0.698 56 0.995 1 0.980 78 0.159
Luxembourg 59 0.706 76 0.667 1 1.000 86 0.973 66 0.184
Venezuela 60 0.706 67 0.678 49 0.997 1 0.980 75 0.167
Ukraine 61 0.705 34 0.736 28 1.000 51 0.978 103 0.107
El Salvador 62 0.705 97 0.634 67 0.992 1 0.980 56 0.214
Chile 63 0.704 117 0.573 39 0.999 47 0.978 36 0.266
Lao PDR 64 0.703 22 0.769 118 0.933 74 0.974 87 0.137
Singapore 65 0.702 27 0.752 94 0.977 101 0.971 101 0.110
Bosnia and Herzegovina 66 0.702 116 0.575 92 0.981 42 0.979 35 0.275
Macedonia, FYR 67 0.702 96 0.636 90 0.985 65 0.976 58 0.209
Tanzania 68 0.700 69 0.674 125 0.910 62 0.976 44 0.239
Vietnam 69 0.698 33 0.738 97 0.972 138 0.957 97 0.124
Dominican Republic 70 0.697 95 0.638 72 0.991 1 0.980 69 0.179
Russian Federation 71 0.696 41 0.724 50 0.997 1 0.980 121 0.085
Ghana 72 0.695 18 0.784 119 0.931 118 0.968 112 0.097
11 The Global Gender Gap Report 2017
Table 3: Global rankings, 2017 (cont’d.)
GLOBAL INDEX ECONOMIC PARTICIPATION
AND OPPORTUNITY EDUCATIONAL ATTAINMENT HEALTH AND SURVIVAL POLITICAL EMPOWERMENT
Country Rank Score Rank Score Rank Score Rank Score Rank Score
Lesotho 73 0.695 84 0.655 1 1.000 35 0.979 84 0.147
Slovak Republic 74 0.694 79 0.662 1 1.000 1 0.980 89 0.135
Thailand 75 0.694 24 0.767 106 0.958 51 0.978 127 0.072
Kenya 76 0.694 44 0.720 120 0.929 1 0.980 83 0.147
Montenegro 77 0.693 88 0.653 83 0.988 75 0.974 79 0.157
Greece 78 0.692 73 0.670 76 0.991 89 0.973 88 0.136
Belize 79 0.692 21 0.772 85 0.988 61 0.976 139 0.032
Madagascar 80 0.692 48 0.716 114 0.950 76 0.974 94 0.127
Mexico 81 0.692 124 0.518 53 0.996 58 0.977 34 0.276
Italy 82 0.692 118 0.571 60 0.995 123 0.967 46 0.234
Myanmar* 83 0.691 26 0.754 95 0.975 66 0.976 132 0.059
Indonesia 84 0.691 108 0.610 88 0.986 60 0.976 63 0.193
Kyrgyz Republic 85 0.691 78 0.664 79 0.990 1 0.980 92 0.130
Suriname 86 0.689 105 0.618 73 0.991 91 0.972 71 0.177
Cameroon 87 0.689 40 0.725 129 0.868 92 0.972 64 0.191
Czech Republic 88 0.688 92 0.643 1 1.000 1 0.980 91 0.130
Cape Verde 89 0.686 106 0.615 93 0.980 110 0.969 70 0.178
Brazil 90 0.684 83 0.655 1 1.000 1 0.980 110 0.101
Senegal 91 0.684 102 0.624 132 0.831 87 0.973 29 0.308
Cyprus 92 0.684 66 0.679 46 0.998 126 0.966 115 0.092
Malta 93 0.682 107 0.610 1 1.000 102 0.971 85 0.146
Georgia 94 0.679 75 0.669 81 0.989 124 0.967 114 0.093
Tajikistan 95 0.678 52 0.708 115 0.941 67 0.976 117 0.088
Paraguay 96 0.678 90 0.652 61 0.994 97 0.971 113 0.094
Armenia 97 0.677 71 0.671 42 0.999 143 0.939 111 0.099
Azerbaijan 98 0.676 45 0.717 91 0.984 142 0.941 131 0.063
Cambodia 99 0.676 56 0.698 121 0.921 1 0.980 106 0.104
China 100 0.674 86 0.654 102 0.963 144 0.918 77 0.160
Malawi 101 0.672 85 0.654 126 0.908 77 0.974 81 0.152
Brunei Darussalam 102 0.671 61 0.692 78 0.990 111 0.969 140 0.031
Hungary 103 0.670 68 0.675 68 0.992 36 0.979 138 0.035
Malaysia 104 0.670 87 0.654 77 0.991 53 0.977 133 0.058
Swaziland 105 0.670 112 0.595 59 0.995 1 0.980 102 0.109
Maldives 106 0.669 94 0.641 1 1.000 133 0.963 128 0.072
Liberia 107 0.669 58 0.695 138 0.772 85 0.973 45 0.236
India 108 0.669 139 0.376 112 0.952 141 0.942 15 0.407
Sri Lanka 109 0.669 123 0.521 86 0.986 1 0.980 65 0.188
Guatemala 110 0.667 101 0.626 103 0.962 1 0.980 109 0.102
Nepal 111 0.664 110 0.599 116 0.936 116 0.969 80 0.155
Mauritius 112 0.664 113 0.595 69 0.992 1 0.980 116 0.090
Guinea 113 0.659 10 0.813 143 0.699 132 0.964 76 0.162
Japan 114 0.657 114 0.580 74 0.991 1 0.980 123 0.078
Ethiopia 115 0.656 109 0.604 134 0.819 44 0.979 50 0.223
Benin 116 0.652 4 0.864 142 0.714 131 0.964 129 0.065
Tunisia 117 0.651 131 0.446 99 0.966 71 0.975 55 0.216
Korea, Rep. 118 0.650 121 0.533 105 0.960 84 0.973 90 0.134
Gambia, The 119 0.649 100 0.627 127 0.896 122 0.968 104 0.106
United Arab Emirates 120 0.649 130 0.459 62 0.994 129 0.965 67 0.180
Burkina Faso 121 0.646 47 0.716 133 0.829 134 0.963 125 0.075
Nigeria 122 0.641 37 0.728 135 0.813 94 0.972 135 0.052
Angola 123 0.640 119 0.560 139 0.763 64 0.976 39 0.262
Bhutan 124 0.638 103 0.622 123 0.916 137 0.959 134 0.056
Fiji* 125 0.638 127 0.479 71 0.991 36 0.979 105 0.104
Bahrain 126 0.632 120 0.537 75 0.991 136 0.961 137 0.037
Algeria 127 0.629 132 0.442 107 0.957 106 0.970 86 0.145
Timor-Leste 128 0.628 136 0.393 117 0.934 43 0.979 60 0.205
Kuwait 129 0.628 125 0.518 52 0.996 117 0.969 141 0.027
Qatar 130 0.626 122 0.523 33 1.000 127 0.965 143 0.016
Turkey 131 0.625 128 0.471 101 0.965 59 0.977 118 0.088
Mauritania 132 0.614 134 0.417 131 0.853 107 0.970 57 0.214
Côte d'Ivoire 133 0.611 115 0.575 137 0.800 121 0.968 108 0.102
Egypt 134 0.608 135 0.413 104 0.960 99 0.971 119 0.087
Jordan 135 0.604 138 0.377 51 0.996 113 0.969 126 0.075
Morocco 136 0.598 137 0.391 122 0.920 128 0.965 100 0.117
Lebanon 137 0.596 133 0.440 109 0.956 109 0.970 142 0.019
Saudi Arabia 138 0.584 142 0.320 96 0.975 130 0.965 124 0.077
Mali 139 0.583 126 0.518 140 0.741 139 0.956 99 0.118
Iran, Islamic Rep. 140 0.583 140 0.357 100 0.965 135 0.963 136 0.046
Chad 141 0.575 77 0.667 144 0.572 73 0.974 120 0.087
Syria 142 0.568 144 0.274 110 0.956 1 0.980 130 0.063
Pakistan 143 0.546 143 0.309 136 0.802 140 0.948 95 0.127
Yemen 144 0.516 141 0.345 141 0.737 119 0.968 144 0.014
* New countries in 2017
12 The Global Gender Gap Report 2017
Table 4: Rankings by subindex, 2017
Country Rank Score
Burundi 1 0.911
Barbados 2 0.877
Bahamas 3 0.871
Benin 4 0.864
Belarus 5 0.827
Botswana 6 0.822
Rwanda 7 0.820
Norway 8 0.816
Namibia 9 0.813
Guinea 10 0.813
Moldova 11 0.811
Sweden 12 0.809
Slovenia 13 0.801
Iceland 14 0.798
Latvia 15 0.798
Finland 16 0.793
Mozambique 17 0.789
Ghana 18 0.784
United States 19 0.776
Mongolia 20 0.776
Belize 21 0.772
Lao PDR 22 0.769
New Zealand 23 0.768
Thailand 24 0.767
Philippines 25 0.764
Myanmar* 26 0.754
Singapore 27 0.752
Lithuania 28 0.749
Canada 29 0.744
Kazakhstan 30 0.744
Switzerland 31 0.743
Colombia 32 0.740
Vietnam 33 0.738
Ukraine 34 0.736
Portugal 35 0.730
Denmark 36 0.728
Nigeria 37 0.728
Estonia 38 0.726
Jamaica 39 0.725
Cameroon 40 0.725
Russian Federation 41 0.724
Australia 42 0.724
Germany 43 0.720
Kenya 44 0.720
Azerbaijan 45 0.717
Belgium 46 0.716
Burkina Faso 47 0.716
Madagascar 48 0.716
Zimbabwe 49 0.710
Ireland 50 0.710
Bulgaria 51 0.710
Tajikistan 52 0.708
United Kingdom 53 0.705
Nicaragua 54 0.702
Poland 55 0.702
Cambodia 56 0.698
Romania 57 0.698
Liberia 58 0.695
Uganda 59 0.693
Bolivia 60 0.692
Brunei Darussalam 61 0.692
Panama 62 0.691
Croatia 63 0.689
France 64 0.683
Israel 65 0.681
Cyprus 66 0.679
Venezuela 67 0.678
Hungary 68 0.675
Tanzania 69 0.674
Albania 70 0.673
Armenia 71 0.671
Serbia 72 0.670
Country Rank Score
Greece 73 0.670
Honduras 74 0.669
Georgia 75 0.669
Luxembourg 76 0.667
Chad 77 0.667
Kyrgyz Republic 78 0.664
Slovak Republic 79 0.662
Austria 80 0.660
Spain 81 0.657
Netherlands 82 0.657
Brazil 83 0.655
Lesotho 84 0.655
Malawi 85 0.654
China 86 0.654
Malaysia 87 0.654
Montenegro 88 0.653
South Africa 89 0.652
Paraguay 90 0.652
Uruguay 91 0.645
Czech Republic 92 0.643
Ecuador 93 0.642
Maldives 94 0.641
Dominican Republic 95 0.638
Macedonia, FYR 96 0.636
El Salvador 97 0.634
Peru 98 0.632
Cuba 99 0.629
Gambia, The 100 0.627
Guatemala 101 0.626
Senegal 102 0.624
Bhutan 103 0.622
Costa Rica 104 0.620
Suriname 105 0.618
Cape Verde 106 0.615
Malta 107 0.610
Indonesia 108 0.610
Ethiopia 109 0.604
Nepal 110 0.599
Argentina 111 0.596
Swaziland 112 0.595
Mauritius 113 0.595
Japan 114 0.580
Côte d'Ivoire 115 0.575
Bosnia and Herzegovina 116 0.575
Chile 117 0.573
Italy 118 0.571
Angola 119 0.560
Bahrain 120 0.537
Korea, Rep. 121 0.533
Qatar 122 0.523
Sri Lanka 123 0.521
Mexico 124 0.518
Kuwait 125 0.518
Mali 126 0.518
Fiji* 127 0.479
Turkey 128 0.471
Bangladesh 129 0.465
United Arab Emirates 130 0.459
Tunisia 131 0.446
Algeria 132 0.442
Lebanon 133 0.440
Mauritania 134 0.417
Egypt 135 0.413
Timor-Leste 136 0.393
Morocco 137 0.391
Jordan 138 0.377
India 139 0.376
Iran, Islamic Rep. 140 0.357
Yemen 141 0.345
Saudi Arabia 142 0.320
Pakistan 143 0.309
Syria 144 0.274
Country Rank Score
Australia 1 1.000
Bahamas 1 1.000
Barbados 1 1.000
Belgium 1 1.000
Botswana 1 1.000
Brazil 1 1.000
Canada 1 1.000
Cuba 1 1.000
Czech Republic 1 1.000
Denmark 1 1.000
Estonia 1 1.000
Finland 1 1.000
France 1 1.000
Ireland 1 1.000
Israel 1 1.000
Jamaica 1 1.000
Latvia 1 1.000
Lesotho 1 1.000
Lithuania 1 1.000
Luxembourg 1 1.000
Maldives 1 1.000
Malta 1 1.000
Netherlands 1 1.000
Philippines 1 1.000
Slovak Republic 1 1.000
Slovenia 1 1.000
United States 1 1.000
Ukraine 28 1.000
Honduras 29 1.000
Colombia 30 1.000
Poland 31 1.000
Uruguay 32 1.000
Qatar 33 1.000
Nicaragua 34 1.000
Belarus 35 0.999
United Kingdom 36 0.999
Sweden 37 0.999
Norway 38 0.999
Chile 39 0.999
Costa Rica 40 0.999
Namibia 41 0.999
Armenia 42 0.999
New Zealand 43 0.998
Argentina 44 0.998
Spain 45 0.998
Cyprus 46 0.998
Serbia 47 0.997
Kazakhstan 48 0.997
Venezuela 49 0.997
Russian Federation 50 0.997
Jordan 51 0.996
Kuwait 52 0.996
Mexico 53 0.996
Ecuador 54 0.996
Panama 55 0.995
Romania 56 0.995
Iceland 57 0.995
Croatia 58 0.995
Swaziland 59 0.995
Italy 60 0.995
Paraguay 61 0.994
United Arab Emirates 62 0.994
Switzerland 63 0.993
South Africa 64 0.993
Mongolia 65 0.993
Moldova 66 0.992
El Salvador 67 0.992
Hungary 68 0.992
Mauritius 69 0.992
Portugal 70 0.992
Fiji* 71 0.991
Dominican Republic 72 0.991
Country Rank Score
Suriname 73 0.991
Japan 74 0.991
Bahrain 75 0.991
Greece 76 0.991
Malaysia 77 0.991
Brunei Darussalam 78 0.990
Kyrgyz Republic 79 0.990
Bulgaria 80 0.990
Georgia 81 0.989
Peru 82 0.988
Montenegro 83 0.988
Austria 84 0.988
Belize 85 0.988
Sri Lanka 86 0.986
Albania 87 0.986
Indonesia 88 0.986
Zimbabwe 89 0.986
Macedonia, FYR 90 0.985
Azerbaijan 91 0.984
Bosnia and Herzegovina 92 0.981
Cape Verde 93 0.980
Singapore 94 0.977
Myanmar* 95 0.975
Saudi Arabia 96 0.975
Vietnam 97 0.972
Germany 98 0.970
Tunisia 99 0.966
Iran, Islamic Rep. 100 0.965
Turkey 101 0.965
China 102 0.963
Guatemala 103 0.962
Egypt 104 0.960
Korea, Rep. 105 0.960
Thailand 106 0.958
Algeria 107 0.957
Bolivia 108 0.956
Lebanon 109 0.956
Syria 110 0.956
Bangladesh 111 0.954
India 112 0.952
Rwanda 113 0.951
Madagascar 114 0.950
Tajikistan 115 0.941
Nepal 116 0.936
Timor-Leste 117 0.934
Lao PDR 118 0.933
Ghana 119 0.931
Kenya 120 0.929
Cambodia 121 0.921
Morocco 122 0.920
Bhutan 123 0.916
Uganda 124 0.913
Tanzania 125 0.910
Malawi 126 0.908
Gambia, The 127 0.896
Burundi 128 0.876
Cameroon 129 0.868
Mozambique 130 0.857
Mauritania 131 0.853
Senegal 132 0.831
Burkina Faso 133 0.829
Ethiopia 134 0.819
Nigeria 135 0.813
Pakistan 136 0.802
Côte d'Ivoire 137 0.800
Liberia 138 0.772
Angola 139 0.763
Mali 140 0.741
Yemen 141 0.737
Benin 142 0.714
Guinea 143 0.699
Chad 144 0.572
ECONOMIC PARTICIPATION AND OPPORTUNITY EDUCATIONAL ATTAINMENT
Note: Countries highlighted in blue have reached parity on that subindex.
* New countries in 2017