A survey on the cadmium contamination in brown rice sold in Tokyo
4
0
0
全文
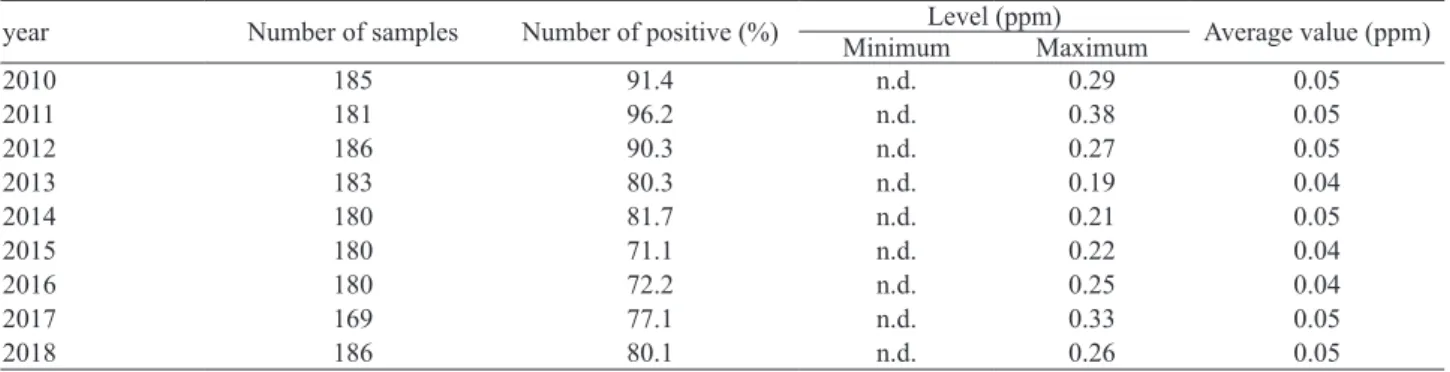
(2) 34 Y. Segawa et al.. Table 1. Cadmium concentration in brown rice by year (2010-2018). Level (ppm) Minimum Maximum 2010 185 91.4 n.d. 0.29 2011 181 96.2 n.d. 0.38 2012 186 90.3 n.d. 0.27 2013 183 80.3 n.d. 0.19 2014 180 81.7 n.d. 0.21 2015 180 71.1 n.d. 0.22 2016 180 72.2 n.d. 0.25 2017 169 77.1 n.d. 0.33 2018 186 80.1 n.d. 0.26 * n.d.: < 0.01 ppm *Cd concentrations less than the lowest LOD in samples was evaluated as a half of LOD. year. Number of samples. Number of positive (%). intake of Cd-contaminated rice in the city. In this study, we report the survey results of Cd content in brown rice during the nine years from 2010 to 2018 in Tokyo. MATERIALS AND METHODS Samples From 2010 to 2018, brown rice samples produced in various Japanese regions were collected from warehouses in Tokyo. Apparatus A microwave digestion system, Microwave (MultiWave3000, PerkinElmer, Inc., Waltham, MA, USA), was used for acid digestion. Determination of elemental concentration was carried out with graphite furnace atomic absorption spectrometry (GF-AAS, AA7000, Shimadzu Corporation, Kyoto, Japan). Reagents The reagents of analytical grade quality were used for all analyses. Water was purified using a Milli-Q system (Merck Millipore, Tokyo, Japan). The standard solution of 100 mg/L for Cd (chemical analysis grade) was obtained from Kanto Chemical (Tokyo, Japan). In the digestion and extraction procedures, the concentrated nitric acid (61%) and hydrogen peroxide (35%) were used that were obtained from Kanto Chemical. For GFAAS analysis, ammonium phosphate dibasic and ascorbic acid were used as the matrix modifier. Method The samples were homogenized using a food processor. About 0.5 g of each sample was accurately weighed, added with 8 mL of HNO3, and then left overnight. Next, 2 mL of hydrogen peroxide was added just before the Vol. 8 No. 2. Average value (ppm) 0.05 0.05 0.05 0.04 0.05 0.04 0.04 0.05 0.05. samples were microwave-digested. After being digested, the sample solution was made to cool down to room temperature, and it was made up to 50 mL with ultrapure water. Then, the Cd concentrations were determined by GF-AAS. The wavelength for Cd was set to 228.8 nm and the spectral bandpass to 0.5 nm. Then, for the matrix modifier, ammonium phosphate dibasic and ascorbic acid were used. In this method, the limit of quantitation (LOQ) for cadmium was 0.01 ppm. RESULTS AND DISCUSSION According to the result of 1630 samples from 2010 to 2018, no sample exceeded the maximum limit (0.4 ppm) that was mandated by the Food Sanitation Law in Japan. Over the 9 years, the average Cd concentration ranged from 0.04 to 0.05 ppm (Table 1). It should be noted that Cd concentrations that were less than the lowest LOQ in samples were evaluated as a half of the LOQ. According to previous reports (Hagiwara et al., 2010), between 1973 and 2009, the average of Cd content has been 0.04 to 0.09 ppm, and in some cases, brown rice that contained more than 0.4 ppm Cd were found every year from 1973 to 1981. However, since 1982, the number of brown rices containing more than 0.4 ppm of Cd has decreased significantly, and in the survey from 2002 to the present, no brown rice containing more than 0.4 ppm of Cd was found. The distribution of cadmium concentration in rice from 2010 to 2018 is shown in Fig. 1. Over the nine years, from 2010 to 2018, the ratio of Cd content below the limit of quantification (0.01 ppm) was 17.6%; between 0.01 ppm and 0.05 ppm, 42.4%; between 0.05 ppm and 0.1 ppm, 26.6%; between 0.1 ppm and 0.2 ppm, 11.9%; and between 0.2 and 0.4 ppm, 1.4%. Similar results were found in national surveys..
(3) 35 A survey on the cadmium contamination in brown rice in Tokyo. Fig. 1. Distribution of Cd concentration in brown rice from 2010 to 2018.. Table 2. Cadmium concentration in brown rice by production area. Number of samples Average value (ppm) Max value (ppm) < 0.01 0.01 ≤ x < 0.05 0.05 ≤ x < 0.1 0.1 ≤ x < 0.2 0.2 ≤ x < 0.4 > 0.4. Hokkaido 68 0.01 0.07 number (%) 38 55.9 28 41.2 2 2.9 0 0 0 0 0 0. Tohoku 745 0.05 0.33 number (%) 101 13.6 311 41.7 214 28.7 102 13.7 17 2.3 0 0. Kanto 312 0.04 0.22 number (%) 81 26.0 141 45.2 62 19.9 25 8.0 3 1.0 0 0. In the same span of years, the average value of Cd content was extremely lower than before 2009 (Hagiwara et al., 2010). This is thought to be an effect of the measures taken by the government and Ministry of Agriculture, Forestry and Fisheries to reduce Cd, for example, phytoextraction, soil dressing, and water management (Murakami et al., 2007; Arao et al., 2009). The Cd concentrations in brown rice are summarized in Table 2. They are classified into seven areas except for Okinawa and Shikoku. No significant difference was observed in the cadmium concentration between the areas. The average of cadmium concentration was ≤ 0.05 ppm in all regions, which is extremely low compared to the maximum limit. Samples with cadmium concentrations of 0.2-0.4 ppm were detected in four regions, namely Tohoku, Kanto, Chubu, and Kansai. The highest ratio of brown rice with low cadmium concentration was in Hokkaido. In conclusion, the cadmium concentration in brown rice was low in all regions and would unlikely to pose a risk to human health.. Chubu 444 0.05 0.38 number (%) 51 11.5 178 40.1 149 33.6 64 14.4 2 0.5 0 0. Kansai 20 0.05 0.23 number (%) 4 20.0 11 55.0 2 10.0 2 10.0 1 5.0 0 0. Chugoku 3 0.03 0.06 number (%) 0 0 2 66.7 1 33.3 0 0 0 0 0 0. Kyusyu 38 0.02 0.10 number (%) 13 34.2 24 63.2 0 0 1 2.6 0 0 0 0. Conflict of interest---- The authors declare that there is no conflict of interest. REFERENCES Aoshima, K. (2012): Itai-itai disease: cadmium-induced renal tubular osteomalacia − Current status and future perspective. Nippon Eiseigaku Zasshi, 67, 455-463. (in Japanese) Aoshima, K. (2016): Itai-itai disease: renal tubular osteomalacia induced by environmental exposure to cadmium — historical review and perspectives. Soil Sci. Plant Nutr., 62, 319-326. Agency for Toxic Substance and Disease Registry (ATSDR). (2012): Toxicological Profile for Cadmium 3.2.2.2 Health Effect- Renal effects. pp. 147-167, Atlanta. Arao, T., Kawasaki, A., Baba, K., Mori, S. and Matsumoto, S. (2009): Effects of water management on cadmium and arsenic accumulation and dimethylarsinic acid concentrations in Japanese rice. Environ. Sci. Technol., 43, 9361-9367. Bradl, H. (ed.) (2005): Heavy metals in the environment: origin, interaction and remediation, vol 6, pp.1-25, Elsevier, Amsterdam. Codex Alimentarius. (2008): Codex general standard for contaminants and toxins in foods and feed. Codex Stan, 193-1995. Hagiwara, T., Amemiya, T. and Yamanobe, H. (2010): Cadmium and Heavy Metal Contents of Brown Rice Carried in Tokyo. Ann. Rep. Tokyo Metr. Inst. Pub. Health, 61, 185-190. Vol. 8 No. 2.
(4) 36 Y. Segawa et al. (in Japanese) Murakami, M., Ae, N. and Ishikawa, S. (2007): Phytoextraction of cadmium by rice (Oryza sativa L.), soybean (Glycine max (L.) Merr.), and maize (Zea mays L.). Environ. Pollut., 145, 96-103. Tsuchiya, K. (1976): Epidemiological studies on cadmium in the environment in Japan: etiology of itai-itai disease. Fed. Proc., 35, 2412-2418. Uraguchi, S., Mori, S., Kuramata, M., Kawasaki, A., Arao, T. and Ishikawa, S. (2009): Root-to-shoot Cd translocation via the. Vol. 8 No. 2. xylem is the major process determining shoot and grain cadmium accumulation in rice. J. Exp. Bot., 60, 2677-2688. Waalkes, M. (2003): Cadmium carcinogenesis. Mutat. Res., 533, 107-120. World Health Organization. (1992a): Environ. Health Criteria 134. Cadmium. Geneva. World Health Organization. (1992b): Environ. Health Criteria 135. Cadmium − environmental aspects. Geneva..
(5)
図

関連したドキュメント
We present sufficient conditions for the existence of solutions to Neu- mann and periodic boundary-value problems for some class of quasilinear ordinary differential equations.. We
Analogs of this theorem were proved by Roitberg for nonregular elliptic boundary- value problems and for general elliptic systems of differential equations, the mod- ified scale of
Then it follows immediately from a suitable version of “Hensel’s Lemma” [cf., e.g., the argument of [4], Lemma 2.1] that S may be obtained, as the notation suggests, as the m A
Correspondingly, the limiting sequence of metric spaces has a surpris- ingly simple description as a collection of random real trees (given below) in which certain pairs of
[Mag3] , Painlev´ e-type differential equations for the recurrence coefficients of semi- classical orthogonal polynomials, J. Zaslavsky , Asymptotic expansions of ratios of
The oriented Sato–Levine invariant [33] is defined for any oriented 2–component diagonal link (meaning pairwise linking numbers vanish) as the self-linking of the curves of
To conclude, we present, under suitable condi- tions, a result on the existence of impulsive cocycle attractor for an impulsive nonautonomous dynamical system and an example,
For the lighting and air conditioning equipment, which account for more than half of the building’s energy consumption, energy efficient systems have been adopted, such as a
