Oceanic Conditions near the Ryukyu islands III
: Oceanic Conditions along 125°E in Spring
and Summer of Successive Four Years, 1965-68
著者
TAKAHASHI Tadao, CHAEN Masaaki
journal or
publication title
鹿児島大学水産学部紀要=Memoirs of Faculty of
Fisheries Kagoshima University
volume
20
number
1
page range
31-54
別言語のタイトル
琉球列島近海の海況III : 1965年から1968年までの
4年間の春季, 夏季における東経125°線上の海況
URL
http://hdl.handle.net/10232/13759
Vol. 20, No. 1 pp. 31—54 (1971)
Oceanic Conditions near the Ryukyu Islands-III.
—Oceanic Conditions along 125°E in Spring and
Summer of Successive Four Years, 1965-1968*—
Tadao Takahashi and Masaaki Chaen**
Abstract
Oceanic conditions along 125°E in a region between 20°N and 32°N in spring and summer of successive four years, 1965-1968, based on the CSK data obtained by the Keiten Maru and
the Kagoshima Maru, Kagoshima University. Generally speaking, variations of temperature
and salinity in this section according to years are rather less remarkable, especially in
summer quite few differences are found, with a few exceptions. However, eastward vol
ume transport of the Kuroshio across this section in summer, referred to 1200 d. b. surface, shows large differences according to years with a maximum value of ca 39X106 m3/sec in
1967 and a minimum value of ca 26X106 m3/sec in 1968, while it is nearly same value of ca
30X106 m3/sec in spring every year.
The core of the Kuroshio seems to be situated almost always at the middle point between
the border of the East China Shelf and the Ryukyu Submarine Ridge, though the width and
the thickness of the current are both variable considerably from time to time.
Another eastward current exists to the far south from the Kuroshio around 20°N-24°N
latitude, which may be the Subtropical Countercurrent or may be not. Volume transport of this eastward current varies very much according to seasons or years, with a maximum value of ca 30X106 m3/sec and a minimum value of ca 8Xl06m3/sec, which may suggest
remarkable fluctuations of the current direction, because these values do not contain total
transport but only eastward component.
1. Introduction
In successive four years since summer of 1965, the Keiten Maru and the Kago
shima Maru, Kagoshima University, made the meridional oceanographic section
in spring and summer along 125°E from 20°N to 32°N for the CSK project. The
general feature of oceanic conditions along this section in summer of 1965, and
in spring and summer of 1966 are already presented in previous papers (Takahashi
and Chaen, 1967, 1969). In the present paper, the oceanic conditions in spring and
summer of successive four years, 1965-1968, are discussed on the bases of their
results of CSK cruises (The Faculty of Fisheries, Kagoshima University, 1970)
and some additional data obtained by some other vessels. During four years, the oceanographic observations are carried out in April and August by the Keiten Maru and the Kagoshima Maru respectively, and the individual observation periodin these surveys takes about a week.
The stations of serial oceanographic ob
servations and BT observations are fixed at the same latitudes in every time, which are shown in Fig. 1. Some direct current measurements are also added.* This is presented to the 2nd CSK Symposium, held under the auspices of National Commis sion for UNESCO on Sept., 1970 in Tokyo.
iStfE
Fig. 1. Map showing the observation stations. Symbols of stations: circles, serial oceanographic observation and BT ; black circles,
BT observation ; crosses, direct current observation.
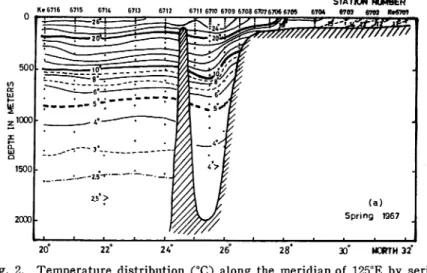
2. Temperature
Among the distribution of temperature obtained by serial observations and BTs
in spring and summer of the four years, those in 1967 and 1968 are shown in Fig.
2.
STATION NUMBER
Ke6716 6715 67U 6713 6712 6711 6710 6709 670867076706 670S 6704 WW 67« KtVfOi
=F=26t
%^jmrM
500 .1000 1500 (a) Spring 1967 NORTH 32Fig. 2. Temperature distribution (°C) along the meridian of 125°E by serial observation and by BT ; (a), (a'), (b), (bO spring and summer of
DEPTH IN METERS DEPTH IN METERS 3 DEPTH IN METERS •-3 > > > CO o > w 2 o
DEPTH IN METERS DEPTH IN METERS 3 DEPTH IN METERS
On the East China Shelf, temperature in spring is nearly uniform vertically
from the surface to the bottom. Approaching the border of the shelf, surface
temperature increases abruptly, forming a front. In the region between the bor
der of the continental shelf and the Ryukyu submarine ridge, a warm core is re markable in the surface layer, on the north of which the maximum slope of
isotherms is found. On the south of the submarine ridge, the upwelling towards
the surface seems to take place, especially in spring of 1966, 1967, 1968 and in
summer of 1965. In summer, warm water of higher temperature than 29°C is
found on the very surface along the section excepting near the border of the
shelf, where a front exists in spring. The warm core found in spring in the region between the border of the shelf and the submarine ridge is less marked
in summer. The upwelling found in spring on the south of the submarine ridge
disappears at the surface.
In other two seasons of the year, namely winter and autumn, temperature distribution along the quite same section is obtained by the Nagasaki Maru, Naga
saki University. However, it is difficult unfortunately to discuss the characteris
tics of the temperature distribution mentioned above, because the intervals of
neighboring stations are too wide. Nevertheless, it may be seen that in winter
the warm core in the region between the border of the shelf and the submarine ridge and the upwelling on the south of the submarine ridge are less remarkable than in spring, which may be attributed to low temperature at the surface in
winter.
The variations of the characteristics of the temperature distribution according
to years are rather less remarkable in spring and also in summer. The variation
range of the numerical values of temperature according to years is ca 2°C at the bottom on the continental shelf in summer (lower in 1967 and 1968, higher in 1965
and 1966), while at the surface to the south of the border of the shelf is ca 3°C in spring (highest in 1966) and only ca 1°C in summer. However, the slope of isotherms in the region between the border of the shelf and the submarine ridge,
on the continental slope, shows rather remarkable differences according to years,
with a strong inclination in summer of 1967. 3. Salinity
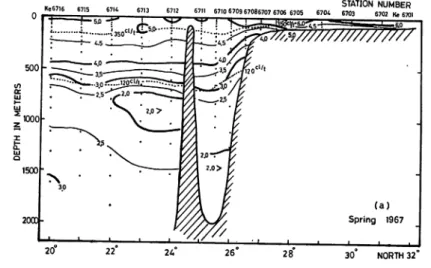
Salinity distributions along the same meridian in spring and summer of 1967 and 1968 are shown in Fig. 3.
On the East China Shelf, the low salinity from the Yellow Sea origin prevails to the north of 31°N, and another one, near the border of the shelf a thin surface
layer characterised by low salinity is also found. These situations and the
numerical values of salinity are variable according to seasons and years. For example, the numerical value of salinity at 10m depth at 32°N in 1967 is 32.5% in winter, 32.6% in spring, 30.2% in summer, and 31.5% in autumn respectively. To the south of the border of the East China Shelf, surface salinity is a little higher in spring (ca 34.8 ^-35.0 %) than in summer (ca 34.5^-34.6 %).
The subsurface saline water creeps from the oceanic area to the north on the
continental shelf, which corresponds to the isanosteric surface of 350 cl/t. The
less saline intermediate water which corresponds to the isanosteric surface of 120 cl/t is found in a layer around 600 m depth to the south of the submarine
ridge. The aspect of the slope of isohalines in the region between the border of
the East China Shelf and the submarine ridge is found to show some differences according to years as well as that of isotherms.
STATION NUMBER K»6716 6715 671* 6713 6712 67116710 6709 6708 67076706 6705 6704 6703 6702 K«6701 n i « ^ _^» • •. i . . . • •• u... . . . 500 1500 2000 (a) Spring 1967 NORTH 32
Fig. 3. Salinity distribution (%) along the meridian of 125°E by serial ob
servation ; (a), (b) spring and summer of 1967, (c), (d) spring and summer of 1968. Doted lines indicate the isanoster of 350 cl/t and 120 cl/t. STATION NUMBER Kg6717 6718 6719 6720 6721 6722 6723 672« 6725 6726 6727 6728 6729 6730 6731 Kg6732 346 34434.2W//// 33.0 // 1500 2000 /350C»/t 3*6 34/134.2 (b) Summer 1967 J I L 30* NORTH 32
STATION NUMBER Ke6810 6809 6808 6807 680S 6805 6801 6803 6802 Ke 6 Kg6S21 -1000 U
2000-^^^^77Z77^%^
(c) Spring 1968 STATION NUMBER 6822 6823 682G 6825 6826 6827 6828 6829 6830 KgS831 \rr'/3^0 330 /32.0 / (d) Summer 1968 30 NORTH 32 4. Dissolved oxygenDistribution of dissolved oxygen along the same meridian is shown in Fig. 4
(in spring of 1967, 1968 and in summer of 1966, 1967).
On the East China Shelf, the dissolved oxygen is ample in spring, having ca 5.0-6.0 ml/L, while in summer ca 4.8 ml/L and ca 3.5 ml/L at the surface and
near the bottom respectively. According to the results of the Nagasaki Maru,
in winter of 1967 it is the almost same in spring, while in autumn nearly average value between those in spring and summer. The dissolved oxygen at the surface to the south of the border of the East China Shelf is a little higher in winter and spring than in summer and autumn. Throughout the all seasons, the numeri
the isanosteric surface of 350 cl/t are ca 4.8-4.6 ml/L, while those of the in
termediate water corresponding to 120 cl/t are ca 2.8-2.5 ml/L. The layer of
the minimum dissolved oxygen is found at 800-1,000 m depth with the numerical value of ca 2.0 ml/L, which corresponds to a depth below the intermediate water. 5. Temperature-salinity relations
The temperature-salinity relations at these stations are divided into three groups; i. e., the Kuroshio water, the low salinity water from the Yellow Sea origin, and the mixing water between them, as shown in the previous papers
(Taka-Ke67l6 STATION NUMBER
6712 6711 6710 6709 67086707 6706 6705 6704 6703 6702 Ke 6701
^}))//7///777fflr
(a) Spring 1967
30 NORTH 32
Fig. 4. Dissolved oxygen distribution (ml/L) along the meridian of 125°E by serial observation ; (a) spring of 1967, (b) spring of 1968, (c)
summer of 1966 and (d) summer of 1967. Doted lines indicate the
isanoster of 350 cl/t and 120 cl/t. K«6810 6809 6808 6807 6806 6805 6804 6803 6802Ke680! STATION NUMBER
^^^^^^^mm^W/y
28" (b) Spring 1968 - j i I 30° NORTH 3STATION NUMBER Kg662l 6622 6623 6624 6625 66266627 66286629663066316632 6633 6635 6636 Kg6637
g!
U*H
^-.fc
500 61000 1500 1500-! ! W U J 3^&}/)//» W//7fi?7fi
(c) Summer 1966 30 NORTH 32 STATION NUMBER Kg 6717 6718 6719 6720 6721 6722 6723 6724 6725 6726 6727 6728 6729 6730 6731 Kg 6732 J JJ J . — ^ ~ NORTH 32hashi and Chaen, loc. cit.).
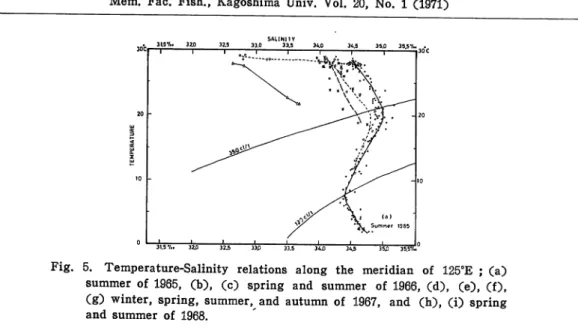
In order to see the variations in these relations, including mixing stages, ac
cording to spring and summer and to years, temperature-salinity relations at
all stations are plotted in every spring and summer, as shown in Fig. 5.
T-S relations between 20°N and 26°N represent the Kuroshio water (indicated
by dots in Figs) characterized by a clear salinity maximum (the subsurface saline
water) and by a clear salinity minimum (the intermediate water). The numeri
cal values of temperature and salinity of those are determined from the curves
and shown in Table 1. Those of both temperature and salinity for the subsurface
saline water and the intermediate water show only a few differences accordingto seasons and to years.
The numerical values for the subsurface saline water
31.5 •/.. 320
Fig. 5. Temperature-Salinity relations along the meridian of 125°E ; (a)
summer of 1965, (b), (c) spring and summer of 1966, (d), (e), (f), (g) winter, spring, summer, and autumn of 1967, and (h), (i) spring
and summer of 1968.
SALINITY
aCft. y** 22P "*i 33/°T~ *** 34J8 34J5 35.0 35.57..Un* **
3W« 32/5 325 3W 33l atr; atj 515 j^: Fig. 5. (b)
J?
° '87.29 30 fr
3W 325 33.0 33.5 34fl 34.5 35.0 35.5%° , . SAUN1TV . 31.5V. 32.0 32.5 33.0 33.5 34J 345 35J0 35.5' Fig. 5. (d) Fig. 5. (c) !V1ot 3oti 3f7" "° 32.5 33;° 335 3*J0 3<|-5 3*° 35V/ 315 V.. 3T5 32T5 333 33l 340 34^ 35^ 357v.i Fig. 5. (e)SALINITY
29V 30 31 32° 325 33.0 335 34.0 34.5 35JO 3S5'
3o'C| ">u . j\]A »i-.. _ i r-= '"y30 C ,ftv. 315*/.., 32JQr 32.5. . 3101 33.51 34.01 34.51 35.01 35.5V..nV
1JUI-9V-30 31 " 32.0 325 33X)335 3 4 X ) 3 4 5 3 5 J 0 355V. 35.0 355 V.
Fig. 5. (f) Fig. 5. (g)
31.5 V.. 32j0 345 35.: 3 55"
315 V.. 320 34.5 35£) 35.5V.. 2S7.. 30 31 '*J2.0 325 33J0 3\S 34/)345 350 3557..
Fig. 5. (h) Fig. 5. (i)
are ca 21°C, ca 35.0 %, while the intermediate water ca 7°C, ca 34.3 %.
T-S relations in the region near the border of the East China Shelf (indicated
by circles in Figs) still keep the salinity maximum (stations at 26°30'N and 27°N,
and occasionally 27°30'N in spring and summer of 1967). To the north of this
stations, as far as 30°N in summer of 1967 and 1968 on the East China Shelf (in dicated by crosses in Figs) T-S relations show quite differences according to season; i. e., curves in winter and spring are nearly along isanosteric surfaces,
while in summer and autumn those cross at nearly right angle to isanosteric
surfaces. The Yellow Sea origin water (indicated by triangles in Figs), has the
lowest salinity at 31°N or 32°N, as shown in Table 1 with the corresponding te
mperature. The salinity in summer shows large differences of ca 4.0 %> accord
ing to year.
6. Current structure
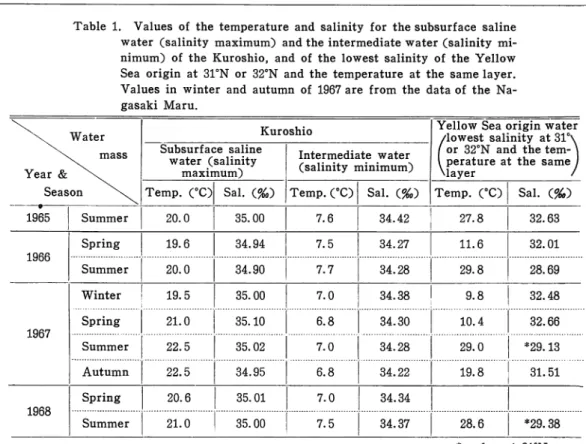
Table 1. Values of the temperature and salinity for the subsurface saline water (salinity maximum) and the intermediate water (salinity mi nimum) of the Kuroshio, and of the lowest salinity of the Yellow Sea origin at 31°N or 32°N and the temperature at the same layer.
Values in winter and autumn of 1967 are from the data of the Na
gasaki Maru.
Water Kuroshio
Yellow Sea origin water
/lowest salinity at 31°\ \ . mass
Year &\ .
Subsurface saline water (salinity maximum) Intermediate water (salinity minimum)1 or 32°N and the tern- \
I perature at the same J
Mayer /
Season \ . Temp. (°C) Sal. (%) Temp. (°C) Sal. (%) Temp. (°C) Sal. (%)
1965 Summer 20.0 35.00 7.6 34.42 27.8 32.63 1966 Spring 19.6 34.94
7.5
1
34.27
11.6 32.01 Summer 20.0 34.907.7
1
34.28
29.8 28.69 Winter 19.5 35.00 7.0 34.38 9.8 32.48 1967Spring
1
21.0
35.10
6.8
34.30
1 10.4
| 32.66
Summer 22.535.02
1
7.0
1
34.28
1
29.0
1 *29.13
Autumn 22.534.95
1
6.8
34.22
1
19.8
31.51
1968 Spring 20.6 35.01 7.0 34.34 Summer 21.035.00
7.5
34.37
1
28.6
1 *29.38
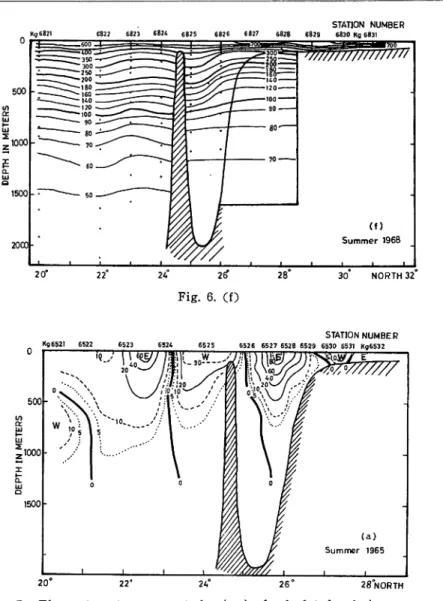
Ke6616 6615 6614 6613 500 ,1000 1500 2000 * value at 31°N STATION NUMBER 66116610 6609 6608 6607 6606 6605 6604 6603 6602 K« 6601Fig. 6. Thermosteric-anomaly (cl/t) distribution along the meridian of
125°E ; (a), (b) spring and summer of 1966, (c), (d) spring and summer of 1967, and (e), (f) spring and summer of 1968. The block of solid earth surrounded by the continental slope and the straight line indicate the imaginary water mass.
STATION NUMBER Kg6621 6622 66 23 6624 6625 6626 6627 66286629663066316632 6633 6635 6636 Kg6637 :1000 -1500 2000- * Ke6716 6715 500 '1000 1500- 2000-6713 6712 6711 6710 6709 6708 67076706 6705 Fig. 6. (c) (b) Summer 1966 NORTH 32 STATION NUMBER 6704 6703 6702 Ke6701
except for that of 1965 shown in the previous paper, in order to see the major
feature of the current structure by means of the chart of thermosteric anomaly. The sharp slope of isanosters on the continental slope corresponds to the strong
current of the Kuroshio, while the convex curve of isanosters on the south of the
submarine ridge corresponds to the westward flow on the north side of submarine
ridge and the eastward flow on the south. In the figure, the isanosters are ex
tended to the block of the continental slope in order to attempt to carry out the
dynamic calculation in the shallow water by B. Groen's method (1948). Adopting
a level of 1,200 m as the no motion layer, the east-west component of relative
current velocity is calculated, the distribution of which in spring and summer
STATION NUMBER Kg 6717 6718 6719 6720 6721 6722 6723 6724 6725 6726 67276728 6729 6730 6731 Kg 6732 NORTH 32 Fig. 6. (d) STATION NUMBER 6804 6803 6802 Kc6801
^77777777777177^
(e) Spring 1968 30 NORTH 32winter and autumn of 1967 occupied by the Nagasaki Maru cannot be utilized with similar accuracy due to the insufficiency of the number of observing points.
7. The Kuroshio itself
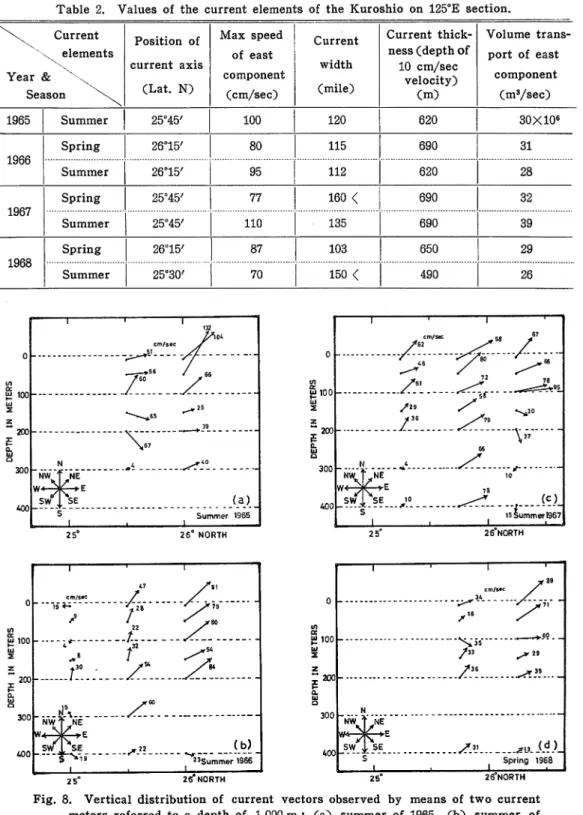
Numerical values concerning the Kuroshio itself, such as the position of the current axis, the maximum speed of the east component, the current width, the current thikness of higher velocity than 10 cm/sec, and the volume transport of the east component can be easily determined from Fig. 7 showing the current structure, and the results are given in Table 2. The core of the Kuroshio is situated almost always at the middle point between the border of the East China
Shelf and the submarine ridge. The maximum speed of the east component varies
Takahashi • Chaen : Oceanic Conditions near the Ryukyu Islands—III. Kg 6871 STATION NUMBER 6823 6824 6825 6826 6827 6828 6829 6830 Kg 6831 NORTH 32 STATION NUMBER Kg 6521 6522 6523 6524 6525 6526 6527 6528 6529 6530 6531 Kg6532 . . --ioW/ E 500-:iooo 1500 (a) Summer 1965 28 NORTH Fig. 7. The east-west component (cm/sec) of calculated relative current velocity across 125°E referred to 1,200 m; (a) summer of 1965, (b), (c) spring and summer of 1966, (d), (e) spring and summer of 1967, and (f), (g) spring and summer of 1968. 45 according to season and year, showing the highest value of ca 110 cm/sec summer of 1967 and the lowest of ca 70 cm/sec in summer of 1968. The current is ca 100 to 160 miles. The current thickness defined here by a depth of velocity of 10 cm/sec is ca 620 to 690 m, with a excepton of the depth of 490 in summer of 1968. The volume transport of the east component in spring is nearly the same value all of three years, having ca 30xl06 m3/sec, while in summer large differen are recognized according to years; i. e., the highest ca 39x10s m3/sec in 1967 the lowest ca 26xl06 m3/sec in 1968.
STATION NUMBER Ke6616 6615 6614 6613 6612 6611 6610 6609 6608 6607 6606 K«6605 Fig. 7. (b) Fig. 7. (C) 28 NORTH STATION NUMBER TA 66082 Kg6621 6622 6623 6624 6625 6626 6627 6628 6629 6630 6631Kg6632 NORTH 28
In 1965 and 1968 the volume transport is ca 3xl06 m3/sec higher in spring than in summer, but in 1967 it is vice versa. However, it is impossible to decide whether the Kuroshio near the Ryukyu Islands is strong in spring or in summer
from only these results.
In summer of 1965, 1966, 1967 and in spring of 1968, the relative current referred
to a depth of 1,000 m are measured directly by means of two current meters of
Ekman-Mertz type at a few stations between the border of the East China Shelf and the submarine ridge. These results are shown in Fig. 8. It can be recog nized clearly that the Kuroshio in summer is stronger in 1967 than in 1966. According to the results of Fig. 8, the current flows towards between NNE andENE and thus the direction of the Kuroshio seems to be stationary. Assuming
STATION NUMBER Ke€716 6715 6714 6713 6712 6711 6710 6709 6708 6707 6706K»6705 28NORTH STATION NUMBER Kg 6717 6718 6719 6723 6721 6722 6723 6724 6725 6726 6727 Kg 6728 500-11000 1500 20 22 Fig. 7. (e) (e) Summer 1967 2 8 NORTH
the maximum resultant current speed will be excess value by ca thirty per cent of the east component, and the current width will be dificient by ca thirty per
cent. The total volume transport, therfore, of the Kuroshio in this region
approximately corresponds to that of the calculated east component stated above. 8. Westward and eastward flows to the south of the submarine ridge.
On the south of the Kuroshio, the current flows to the west near the submarine
ridge and flows to the east again to the further south of the submarine ridge,
as shown in Fg. 7. The westward and the eastward flows may form a vortex found usually at the right hand side of the Kuroshio in the region under con sideration (Takahashi and Chaen, loc. cit.). The westward flow seems to be the
STATION NUMBER Ke68t0 6809 6808 6807 6806 6805 6804 6803 6802Kc6801 Kg6821 500 rXX)0 1500 20° 28NORTH STATION NUMBER 6827 Kg 6828 2 8 NORTH
counter current of the Kuroshio, but the eastward flow may be the starting por
tion of the Eastward Subtropical Countercurrent or may be not. With regard
to these flows, some current characteristics are also determined and shown in
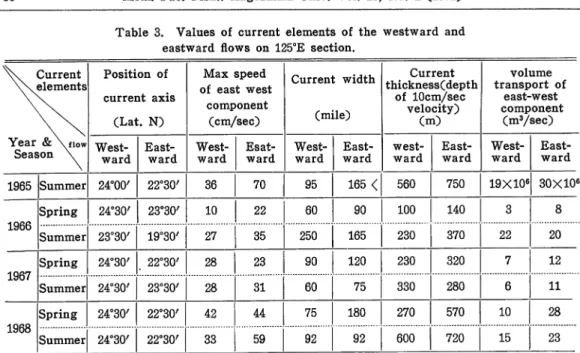
Table 3. The current axis is situated around at 24oN-24°30;N in the westward
flow and at 22°30/N-23°30,N in the eastward flow, with a exception in summer of 1966, showing the southward movement. As shown in Table 3, these currents have much variable characters according to season and year, compared with those of the Kuroshio itself. The maximum speed of the eastward current is higher
than the westward flow, with a exception in spring of 1967. That of the east
ward flow is higher in summer than in spring in general, while in 1966 vice versa. The numerical value of the maximum speed of the eastward flow is ca
Table 2. Values of the current elements of the Kuroshio on 125°E section. \ ^ Current \ elements Year & X\
Season
\ ^
Position of current axis (Lat. N) Max speed of east component (cm/sec) Current width (mile) Current thick ness (depth of 10 cm/sec velocity) (m) Volume trans port of east component (m3/sec) 1965 Summer 25°45' 100 120 620 30X106 1966 Spring 26°15' 80 115 690 31 Summer 26°15' 95 112 620 28 1967 Spring 25°45/ 77 160 < 690 32 Summer 25°45' 110 135 690 39 1968 Spring 26°15' 87 103 650 29 Summer 25°30/ 70 150 < 490 26 £ 100-200 I r ~ ™ cm/set ____^^,y , »56 /60 1 132j,.
y
/ 66 "-^^S ^25 t-39 N \67 ^4 ^.40 NVVtfc
(a) sw ,Si
s • Summer —I 1965 26° NORTH 300 •-19*=" NWt ^NE -*E^k
•A-r
r
y_i.
^
(b)
23Summer 1966 26° NORTH Shoo N Nw't NE W< X >E I sw**£
SE 0 -tn§100
ui z z ~ 200 fvk./:'.
300nwJ"ne"""
N SW J, SE s" 25° is Si (C) iummer!967X"
**> .S.v. Spring 1968Fig. 8. Vertical distribution of current vectors observed by means of two current meters referred to a depth of 1,000 m ; (a) summer of 1965, (b) summer of 1966, (c) summer of 1967, and (d) spring of 1968.
Table 3. Values of current elements of the westward and
eastward flows on 125°E section.
\ \ Current \\elements Position of current axis (Lat. N) Max speed of east west component (cm/sec) Current width (mile) Current thickness(depth of lOcm/sec velocity) (m) volume transport of east-west component (m3/sec) Year &\fiow Season \ West ward East ward West ward Esat-ward West ward East ward west ward East ward West ward East ward 1965 Summer 24°00' 22°30/ 36 70 95 165 < 560 750 19X106 30X106 Spring 24°30' 23°30' 10 22 60 90 100 140 3 8 1966 Summer 23°30' 19°30' 27 35 250 165 230 370 22 20 1967 Spring 24°30/ 22°30' 28 23 90 120 230 320 7 12 Summer 24°30' 23°30/ 28 31 60 75 330 280 6 11 Spring 24°30/ 22°30/ 42 44 75 180 270 570 10 28 1968 Summer 24°30' 22°30/ 33 59 92 92 600 720 15 23
as the lowest, the latter approximately coincide with that of the Eastward Su
btropical Countercurrent reported by Uda and Hasunuma (1969). Similar to the
maximum speed, the volume transport of the eastward flow is higher than the
westward flow, but with another exception in summer of 1966. The numerical
value of the eastward volume transport in summer of 1965 and in spring of 1968is nearly as high value as those of the Kuroshio in the same season of the year
respectively. However, in spring of 1966, in spring and summer of 1967 those are
as low values of one-third to one-fourth of those of the Kuroshio itself in thesame season of the year. Even these low values are rather higher than that of
the Eastward Subtropical Countercurrent suggested by Uda and Hasunuma (loc.cit.), which is ten or twenty per cent of that of the Kuroshio itself.
Such large amount of the volume transport of the eastward flow across 125°E
section should be considered to involve a considerable part of a contra solem
vortical transport besides the due eastward flow. Therefore, the intensity of the
total eastward flow may suggest the existence of the upwelling related to a
vortex. It is the most intensive in summer of 1965 during the four years, as
shown in the temperature distribution also.
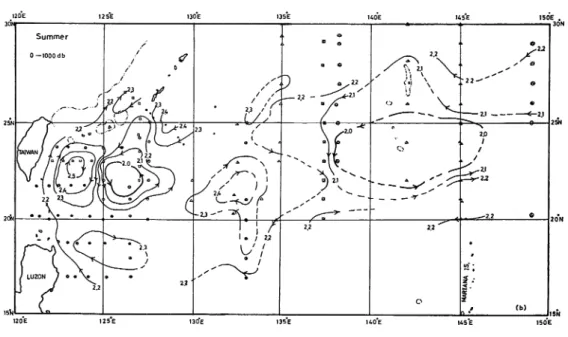
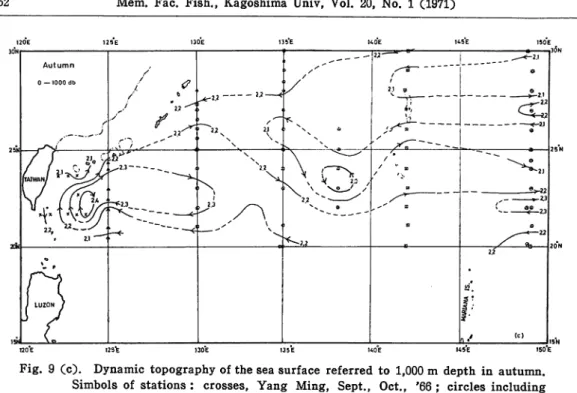
In order to examine these consideraiton mentioned above the charts of the
dynamic topography at the sea surface referred to 1,000 m depth in the region
between Taiwan and the meridian of 150°E for four seasons are drawn in Fig. 9, on the bases of CSK data for spring (Mar. Apr. and May in 1966 and 1967),summer (June, July, and Aug. in 1965, 1966, and 1967), autumn (Sept., Oct. and
Nov. in 1966 and 1967) and winter (Dec, Jan. and Feb. in 1965, 1966 and 1967). In
the region under consideration, lower subtropical latitudes, the difference in
dynamic depth anomaly between adjacent stations is small, as indicated by
Ma-Fig. 9 (a). Dynamic topography of the sea surface referred to 1,000 m depth in spring. Symbols of stations : circles including dots, Keiten Maru, Apr., '66,
'67; crosses, Yang, Ming, Mar., Apr., '66, Apr., '67; circles including
crosses, G. Nevelskoy, Mar., Apr., May, '66; circles including triangles,
Orlick, Mar., Apr., '66, Mar., '67; solid triangles, U.M, Schokalsky, May, '67.
Fig. 9 (b) Dynamic topography of the sea surface referred to 1,000m depth in summer.
Symbols of stations : circles, Kagoshima Maru, Aug., '65, '66; circles includ
ing dots, Keiten Maru, Aug., '65 ; double circles, Takuyo, July, Aug., '66 ; double squares, Shinyo Maru, Aug., '66 ; squares, Chofu Maru, July, ,66 ; solid triangles, U.M. Schokalsky, Aug., '65, June, '67 ; circles including triangles, Orlick, Aug., '67 ; triangles, Uliana Gromova, Aug., '65 ; solid circles, Atlantis
3<5n 2) ?
cC
V « - 2/° _e*-22 20Vl 5r 125tFig. 9 (c). Dynamic topography of the sea surface referred to 1,000 m depth in autumn. Simbols of stations : crosses, Yang Ming, Sept., Oct., '66 ; circles including crosses, G. Nevelskoy, Sept., Oct.,'66 ; circles including triangles, Orlick, Sept., '66, Nov., '67 ; squares including cross, Umitaka Maru, Nov., '67 ; solid triangles, Koyo Maru, Oct, '67; triangles, Nagasaki Maru, Nov., '67.
Fig. 9 (d). Dynamic topography of the sea surface referred to 1,000m depth in winter.
Simbols of stations: squares including crosses, Vitjaz, Jan., '66 ; squares, Chofu Maru, Jan., '66, '67 ; triangles including solid circles, Qshoro Maru, Jan., '66 ;
solid triangles, U.M. Schokalsky, Feb., '66 ; double circles, Ryofu Maru, Jan.,
Feb., ,67, Feb., '68; triangles, Nagasaki Maru, Jan., '67 ; circles including
suzawa (1967). Moreover, each chart in Fig. 9 is completed by combination of
a few year data.
In spite of these defects, however, the major characteristic
feature of the dynamic topography in the region under consideration can be
noticed as follows. Cyclonic and anticyclonic vortices of different sizes arefound alternately from west to east.
This fact is also found on the CSK Atlas
published by JODC (1967, 1968, 1969, 1970).
The westward and eastward flows
across the 125°E section form part of a large vortex at the western side.Yama-naka, Anraku, and Morita (1965) pointed out that the westward and the eastward
flows exist in the lower subtropical latitudes on 130°E, 135°E, and 140°E sectionsalso by means of their charts of the geostrophic current or temperature distribu
tion. Thus the eastward flow extends to the further east in all four seasons
along the outer side of the successive vortices with meandering. The Eastward
Subtropical Countercurrent is theoretically inidcated, on the bases of the wind
stress data, by Yoshida and Kidokoro (1967) as a relatively narrow band with
irregular fluctuation in the region between the west wind and trade wind zone.
According to the results mentioned so far, the Eastward Subtropical Countercur
rent seems to actually exist with irregularity and large meandering. The volumetransport of this eastward current varies very much, which may suggest remar
kable fluctuation of current direction, because obtained numerical values do notcontain total transport but only eastward component.
9. Summary and Conclusion
The oceanographic description along the meridian of 125°E in spring and summer of successive four years, 1965-1968 is presented, based on oceanographic data of the Keiten Maru and the Kagoshima Maru cruises for CSK and some additional
data of other vessels participating to CSK.
The variation of the temperature distribution according to years is less remar
kable, the range of which is 1-2°C in summer and ca 3°C in spring. However, the
slope of isotherms in the region between the border of the shelf and the sub
marine ridge shows rather remarkable differences according to years.Two low salinity water are found on the continental shelf in every spring and summer, though these situations and the numerical values are changeable accord ing to seasons and years.
Dissolved oxygen in the surface layer along the sectoin is a little higher in winter and spring than in summer and autumn. Throughout the all seasons,
the numerical values of dissolved oxygen for the subsurface saline water and the intermediate water is ca 4.8-4.6 ml/L and 2.8-2.5 ml/L respectively.
Temperature and salinity for the subsurface saline water are ca 21°C and 35.0
%, while the intermadiate water ca 7°C, ca 34.3 %Q. T-S relations on the East
China Shelf show quite differences according to season; i. e., curves in winter and spirng are nearly along isanosteric surfaces, while in summer and autumn
The core of the Kuroshio is situated almost always at the middle point be
tween the border of the East China Shelf and the submarine ridge, though the
width and thickness are both variable.
The volume transport of the east com
ponent in spring is nearly the same value in all of three years, having ca 30xl06
m3/sec, while in summer some differences are recognized according to years,
the highest ca 39xl06m3/sec in 1967 and the lowest ca 26xl06 m3/sec in 1968.
In 1966 and 1968 the volume transport is ca 3xl06 m3/sec higher in spring than
in summer, but in 1967 it is vice versa.
The westward flow and the eastward flow (20°N-24°N) to the south of the
Kuroshio are always found in spring and summer, though the currents have
rather variable characters according to season and year compared with those of
the Kuroshio itself. The westward flow corresponds to the counter current of the Kuroshio, but the eastward flow may be the starting portion of the Subtro pical Countercurrent or may be not. The maximum speed and the volume transport of the eastward flow is higher than the westward flow, in general.
The
numerical value of the eastward volume transport is nearly same as the Kuroshioitself in high case (30x10s m3/sec), while one-fourth of the Kuroshio in low case
(8xl06 m3/sec). This fact suggests remarkable fluctuation of the current direction,
because these values do not contain total transport but only eastward component.
Moreover the large amount of the volume transport of the eastward flow across125°E section should be considered to involve a considerable part of a vortical
transport besides the due eastward flow. Thus the eastward flow extends to the
further east along the outer side of the successive vortices with meandering.
The authors wish to express their hearty thanks to Capt. S. Ueda, Kagoshi
ma Maru, and his crew, and to Capt. T. Henmi, Keiten Maru, and his crew, fortheir works in observations on the sea.
References
Groen, B. (1948): Methods for estimating dynamic slopes and current in shallow water. /.
Marine Res., 7 (3), 312-316.
Japanese Oceanographic Data Center (1967, 1968, 1969, 1970): CSK Atlas No. 1, 2, 3, 4. Masuzawa, J. (1976): An oceanographic section from Japan to New Guinea at 137°E in January
1967. Oceanogr. Mag., 19 (2), 95-118.
Takahashi, T and M. Chaen (1967): Oceanic conditions near the Ryukyu Islands in summer of
1965. Mem. Fac. Fish. Kagoshima Univ., 16, 63-75.
Takahashi, T and M. Chaen (1969); Oceanic conditions near the Ryukyu Islands-II. Oceanic
conditions on 125°E in spring and summer of 1966. Mem. Fac. Fish. Kagoshima Univ., 18,
99-114.
The Faculty of Fisheries, Kagoshima University (1970): Oceanographic Data of CSK.
Uda, M and K. Hasunuma (1969) : The Eastward Subtropical Countercurrent in the western
North Pacific Ocean. Jour. Oceanogr. Soc. Japan, 25 (4), 201-210.
Yamanaka, H., N. Anraku and J. Morita (1965): Seasonal and long-term variations in oceano graphic conditions in the western North Pacific Ocean (in Japanese). Rep. Nan. Reg. Fish.
Lab. 22, 35-70.
Yoshida, K and T. Kidokoro (1967) : A Subtropical Countercurrent (II) A prediction of eastward flows at lower subtropical latitudes. Jour. Oceanogr. Soc. Japan 23 (5), 231-246.