Measuring Companies’ Compliance with
IFRS-Based PSAK Disclosures
journal or
publication title
International review of business
number
15
page range
91-110
year
2015-03
1. Introduction
Studies about companies’ compliance with international accounting standards have been growing alongside the mandatory adoption of International Financial Reporting Standards (IFRS) in the European Union (EU) since 2005 and in Asian countries since 2011/2012. The studies use various theoretical perspectives and methodologies in attempts to explain the extent of companies’ compliance with required standards and the factors affecting such compliance. Following this prior research, the present study examines the degree of compliance with the disclosure requirements of the IFRS-based Pernyataan Standar Akuntansi Keuangan (PSAK) financial accounting standards among listed companies of the Indonesian Stock Exchange for the year ending 2012, and seeks to determine the underlying factors that affect the level of disclosure.
A number of studies have investigated the level of companies’ compliance with IFRS disclosures and the factors affecting such compliance, both in developed countries (Cooke
Elok HENIWATI*,**
Abstract
The extent to which companies comply with required standards and the factors affecting such compliance are accounting issues that have been gaining greater attention alongside the mandatory adoption of International Financial Reporting Standards (IFRS) in the European Union (EU) and Asian countries. This study examines the levels of Indonesian companies’ compliance with the IFRS-based disclosure requirements of the Pernyataan Standar Akuntansi Keuangan (PSAK) financial accounting standards and assesses the effect of company characteristics on disclosure compliance. By employing two disclosure-scoring systems, the dichotomous and partial compliance methods, the findings reveal a low level of compliance that constitutes approximately 60% of the index items. Moreover, linear regression provides evidence that companies comply with disclosure requirements to a greater extent when they have the following characteristics: they are large, employ the Big Four auditors, and are in the manufacturing sector. The results suggest that unique sets of organizational factors could explain variations in companies’ compliance with IFRS-based PSAK disclosures.
* Ph.D Student, Institute of Business and Administration, Kwansei Gakuin University, Japan ** Accounting Department of Tanjungpura University, Pontianak, Indonesia
1989, Yeoh 2005, Iatridis 2008) and developing countries (Owusu-Ansah 1998, Akhtaruddin 2005, Abdelsalam and Weetman 2007, Aljifri 2008, Al-Shammari et al. 2008, Hossain and Hammami 2009, Al-Mutawaa and Hewaidy 2010, Tsalavoutas 2011, Abdullah and Minhat 2013). The findings were mixed. While most studies conducted in developed markets showed a high degree of compliance, studies conducted in emerging countries showed otherwise. It is supposed that weak enforcement in developing countries has encouraged non -compliance. Nevertheless, most studies agreed that the release of information is useful to investors when making decisions (Cooke 1989), mitigates conflict between principals and agents, enhances the value of companies (Lobo and Zhou 2001), and reduces financial and auditing costs for listed companies (Levich 2001, Mayhew et al. 2001, Spathis 2002).
A few studies have examined the level of companies’ compliance with accounting standards in Indonesia. Craig and Diga (1998) analyzed corporate annual report disclosure practices in five ASEAN countries, Singapore, Malaysia, Indonesia, Thailand, and the Philippines, using sample data of 145 public companies listed on ASEAN stock exchanges. Among these countries, the level of companies’ compliance in Indonesia was the lowest. Setyadi et al. (2009) reviewed the same issue by using a single data set of Indonesian companies and found that the extent to which listed companies complied with accounting standards was low. Both sets of research used sample data from financial reports before referring to accounting standards that were IFRS convergent and noted that weak enforcement was the reason for non-compliance.
The present study aims to rectify the gaps in prior studies by employing sample data for which national accounting standards were fully IFRS/International Accounting Standards (IAS) 2009 convergent. It also expands the empirical literature about accounting compliance in Indonesia and thereby benefits Indonesia’s financial markets. Moreover, the study aims to analyze the impact of IFRS-based PSAK implementation to establish whether it benefits the program of the Indonesian Institute of Accountants. Accounting compliance is a critical issue for Indonesian capital markets because it encourages confidence, protects stakeholders, and contributes to the national economy by encouraging conformity with rules set by the Bapepam-LK1 (the Capital Market Supervisory Agency) for the running of Indonesia’s
businesses (Setyadi et al. 2009). This empirical study provides useful information to fulfill these goals.
To the best of the author’s knowledge, this is the first large-scale, single-country academic study that examines the degree of companies’ compliance with Indonesian Generally Accepted Accounting Principles (GAAP) (PSAK) disclosures that are now IFRS/
1 As of 2012, the Bapepam-LK, in its role as the supervisory body for the capital market, has been
IAS convergent. Converging to IFRS/IAS is expected to improve the quality of national accounting standards in terms of comparability and transparency. The findings are expected to be of particular interest to regulators and standard setters, as well as to academics who may wish to conduct similar studies.
The paper is structured as follows. Section 2 discusses the legal framework for financial reporting. The literature review, hypothesis development, and research methodology are described in Sections 3 and 4. Section 5 discusses the empirical findings, and Section 6 presents conclusions, limitations, and suggestions for future research.
2. The Legal Framework for Financial Reporting
Indonesian Company Law No. 40 (2007) requires each company to prepare annual reports in accordance with the accounting standards issued by the Indonesian Institute of Accountants. However, this law has little effect on companies because no single government agency monitors and enforces it. The Ministry of Trade (MOT), through ministerial decree No. 121/MPP/KEP/2/2002, requires companies of certain types such as listed companies, those that issue bonds or loan certificates, and those with total assets greater than IDR 25 billion to submit audited annual reports to the MOT, particularly to the Directorate of Business and Regulations of the MOT. However, because there is no monitoring by a governmental agency, law enforcement is nonexistent.
Further, the Bapepam-LK regulates companies listed in the Bursa Efek Indonesia (BEI, the Indonesian Stock Exchange), ensuring that they comply with Capital Market Law No. 8 (1995). This regulation requires listed companies to publish and submit periodic reports to the Bapepam-LK. The reports must be audited and filed within 90 days of the calendar year -end. Semi-annual financial statements must also be filed with the Bapepam-LK within 30 days, 60 days, or 90 days if unaudited, reviewed, or audited respectively. The Indonesian Stock Exchange (IDX) requires interim reports to be submitted and presented on the IDX website.
3. Literature Review and Hypothesis Development
Several studies have addressed the relationship between the level of IFRS compliance and various corporate characteristics such as liquidity, profitability, size, industry sector, auditor, leverage, and age (Owusu-Ansah 1998, Akhtaruddin 2005, Abdelsalam and Weetman 2007, Aljifri 2008, Al-Shammari et al. 2008, Tsalavoutas 2011), and have provided mixed findings. In line with prior research, this study seeks to explain the relationship between company characteristics and the degree of companies’ compliance with annual report disclosures in Indonesia by classifying the company-specific determinants into internal-related and external-related variables. Internal-related variables are attributes that
derive from and represent the internal state of companies. Size and leverage are chosen to represent company structure, and liquidity and return on equity (ROE) to represent company profitability. External-related variables are external company attributes that could be important in explaining the relationship between a company’s compliance and its regulations. The proxies are audit company and manufacturing sector.
A positive association between larger companies and disclosure practices has been established by several studies. Companies benefit by reducing capital costs (Choi 1973, Elliott and Jacobson 1994), supplying non-proprietary data to the public (Dye 1985, 1986, 1990), and complying with disclosure requirements (Salamon and Dhaliwal 1980: cited in Owusu-Ansah 1998). Accordingly, Owusu-Ansah (1998) concluded that production costs are expected to decrease as company size increases. Further, increased compliance with regulations reduces political costs for large companies. The larger a company, the larger its political costs will be and the greater will be the threat of adverse regulatory action (Watts and Zimmerman 1978: cited in Craig and Diga 1998). Therefore, large companies seem likely to respond to regulatory threats by increasing their levels of disclosure voluntarily.
It was hypothesized that companies with higher leverage were likely to disclose more information in order to reduce agency costs and information asymmetry with shareholders as well as to reassure their debt holders that their interests are protected (Abdulla 1998, Joshi and Al-Bastaki 2000, Al-Shimmiri 2003: cited in Al-Shammari et al., 2008). Additionally, the studies identified that such companies were likely to have less equity and riskier equity than those with lower leverage. Consequently, shareholders demand more information in order to assess the probability that a company is meeting its debt obligations and thereby determine the degree of risk to future cash flows arising from the company’s investments (Al-Mutawaa and Hewaidy 2010).
Prior studies identified that liquidity influences mandatory disclosure practices. A number of parties such as regulatory bodies, investors, and lenders are particularly concerned with companies’ liquidity (Wallace and Naser 1995); thus, companies with higher liquidity tend to disclose this good news in their annual reports (Belkaoui and Kahl 1978: cited in Owusu-Ansah 1998). However, findings about this association varied. Cooke (1989) pointed out that companies with higher liquidity were more likely to disclose more information than companies suffering from low liquidity. However, Wallace et al. (1994) claimed that lower liquidity could prompt companies to increase their disclosure in order to mitigate fears and notify shareholders that management was aware of the problem (Al-Mutawaa and Hewaidy 2010).
Companies with high profitability have greater motivation to send good news to market than those with low profitability. However, Lang and Lundholm (1993) noted that the influence of companies’ profitability on disclosure levels could be positive, neutral, or
negative depending on performance. In this regard, the finding of Owusu-Ansah’s (1998) study indicated a significant positive association while Wallace et al., (1994), Street and Gray (2002), Glaum and Street (2003), and Ali et al. (2004) provided no evidence of an association between profitability and disclosure levels. On the other hand, Wallace and Naser (1995) reported a negative correlation between the two variables.
Certain types of industry could have different sensitivities to political costs than others (Watts and Zimmerman 1978). Consequently, similar industries tend to release information more freely than others in order to deal with the operating environment. However, the empirical research regarding such issues has suggested different outcomes. In addition, Al-Mutawaa and Hewaidy (2010) reported conflicting results regarding the association between industry sector and disclosures. Elsewhere, Ball and Foster (1982), cited in Al-Shammari et al. (2008), found that industry type could be a more appropriate proxy for political cost-sensitivity than size.
The independence of auditing companies could also influence the level of compliance. DeAngelo (1981) and Watts and Zimmerman (1986) suggested that big audit companies could provide audits of higher quality than those of small audit companies because the former are more independent. However, empirical research that tested the levels of disclosure associated with the type of auditor contradicted this. While a number of studies (see Street and Gray 2002, Glaum and Street 2003, Owusu-Ansah and Yeoh 2005) reported a significant positive association between the type of auditor and IAS disclosure requirements, Wallace et al. (1994) found a negative association between the type of auditor and the extent of compliance with mandatory disclosure.
Considering the above discussion, the following hypothesis is formed.
H1: There is a significant association between the levels of companies’ compliance with IFRS-based PSAK mandatory disclosure and size, leverage, liquidity, ROE, manufacturing sector, and auditor.
4. Research Methodology
4.1 Data Collection and Index Construction
This study aims to measure the extent to which nonfinancial listed companies comply with IFRS-based PSAK disclosure requirements the first time they are required to implement the standard. Consequently, annual reports from the year ending December 31, 2012 were chosen. The data were obtained from the IDX web site. As of 2012, there were 459 issuers in the market (IDX 2012). This study eliminated some of these issuers using the following criteria. First, financial institutions were eliminated. These institutions are stringent about various regulations and it is assumed that they have a specific method of financial reporting. For uniformity reasons in financial reporting, such reports were therefore
Table 1. Summary of Sample Selection Process
Initial sample of annual reports 459 Annual reports of financial institutions (76) Annual reports of new issuers (23)
Incomplete annual reports (7)
Final sample 353
excluded. Second, this study eliminated issuers that had been listed on the IDX for less than a year. This is because the impact of the change on financial reporting can only be assessed realistically after companies have been listed on the market for more than a year. Third, issuers with incomplete reports were eliminated. Table 1 summarizes the sample selection process.
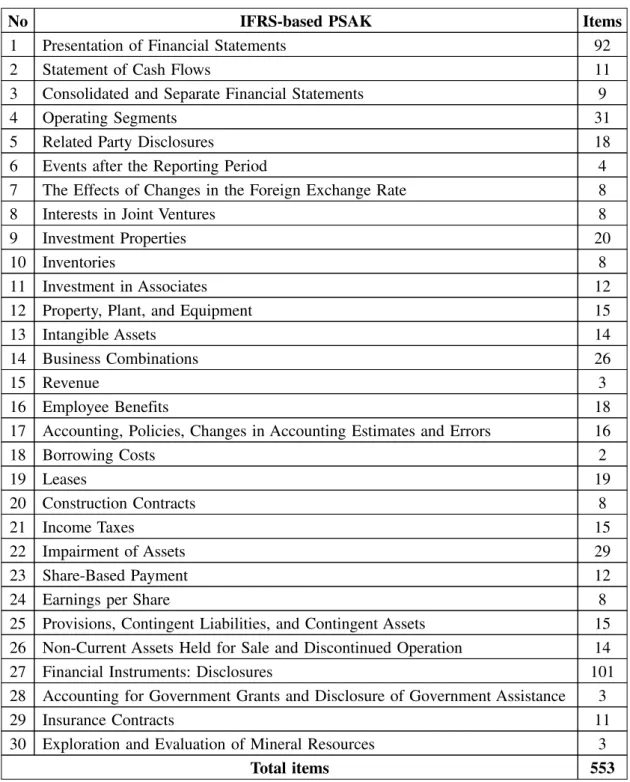
A self-constructed disclosure checklist was developed to measure the degree of a company’s compliance with IFRS-based PSAK disclosure. This scoring-system instrument was constructed according to the disclosure requirements of 30 standards that were IFRS/ IAS convergent and relevant to this study (nine standards were not relevant and two standards were not IFRS/IAS convergent). Each standard was scrutinized for mandatory disclosure requirements. The result was 553 items on a disclosure checklist (see Table 2). The disclosure content in each company’s annual report was then coded one (1) if it was in the item list of the scoring system and zero (0) if it was not. If a disclosure in the list was not applicable to the company, the item was scored as not applicable (NA). A relative score was then computed for each company by dividing the actual score by what the company was expected to disclose under the standards. This relative index approach has been used in most studies regarding disclosure measurement (e.g., Owusu-Ansah 1998, Yeoh 2005, Abdelsalam and Weetman 2007, Aljifri 2008, Al-Shammari et. al. 2008, Tsalavoutas 2011).
The disclosure index used has an unweighted scoring approach that treats all items of information equally. A number of studies have documented this approach (e.g., Wallace 1987, Cooke 1991, 1992, Owusu-Ansah 1998, Abdelsalam and Weetman 2007, Tsalavoutas 2011). While this provides minimum subjectivity and emphasizes the extent of overall disclosures instead of particular items (Belkaoui 1994), it faces a general problem with the nature of scoring disclosure in annual reports; that is, whether or not an undisclosed item is applicable to a sample company. Following Owusu-Ansah’s (1998) study, several measures were used to deal with the problem. First, because listed companies are required by law to disclose comparative figures for each information item, the current figures for each item were compared with those of the prior year. Second, as suggested by Cooke (1989), the
Table 2. IFRS-based PSAK Disclosure Checklist
No IFRS-based PSAK Items
1 Presentation of Financial Statements 92
2 Statement of Cash Flows 11
3 Consolidated and Separate Financial Statements 9
4 Operating Segments 31
5 Related Party Disclosures 18
6 Events after the Reporting Period 4
7 The Effects of Changes in the Foreign Exchange Rate 8
8 Interests in Joint Ventures 8
9 Investment Properties 20
10 Inventories 8
11 Investment in Associates 12
12 Property, Plant, and Equipment 15
13 Intangible Assets 14
14 Business Combinations 26
15 Revenue 3
16 Employee Benefits 18
17 Accounting, Policies, Changes in Accounting Estimates and Errors 16
18 Borrowing Costs 2 19 Leases 19 20 Construction Contracts 8 21 Income Taxes 15 22 Impairment of Assets 29 23 Share-Based Payment 12
24 Earnings per Share 8
25 Provisions, Contingent Liabilities, and Contingent Assets 15 26 Non-Current Assets Held for Sale and Discontinued Operation 14 27 Financial Instruments: Disclosures 101 28 Accounting for Government Grants and Disclosure of Government Assistance 3
29 Insurance Contracts 11
30 Exploration and Evaluation of Mineral Resources 3
entire annual report of each sample company was read twice to ensure familiarity before scoring. In this way, the consistency of the scoring was ensured and any mistakes were rectified before the scores were totaled.
To improve the robustness of the findings, two simultaneous unweighted methods of compliance score, Cooke’s method (also known as the dichotomous method) and the partial compliance (PC) method, were used (see Tsalavoutas 2011). The relative score for Cooke’s method was computed as follows:
where DSj is the total compliance score for each company and 0<_DSj<_1. TDS is the total
number of items disclosed (di) by company j and M is the maximum number of applicable
disclosure items for company j that could have been disclosed. The PC method was computed as follows:
where PSj (partial score) is the total compliance score for each company and 0<_PSj<_1. Xi is
the level of compliance for each mandatory disclosure that was initially calculated using the dichotomous approach. The sum of these compliance scores (X) is divided by the total number of relevant/applicable standards for each company j, i.e., Rj
4.2 Empirical Specification
The dependent variable of this study is the dichotomous compliance score and the explanatory variables are continuous or categorical measurements. It is assumed that the nature of the score could not be normally distributed. Hence, the major assumption of the classical ordinary least squares (OLS) regression, that is, that the dependent variable is normally distributed, could be violated (Tsalavoutas 2011). Consequently, the dependent variable is transformed to the log of the odds ratio. With regard to this concern, Cooke (1989), cited in Tsalavoutas (2011), explained that in these types of study, “The dependent variable is a metric ratio and therefore can be legitimately transformed, where necessary, and used in regression analysis.” Further, he suggested that the logarithm of the odds ratio of the dependent variable could provide the best fit. This transformation has been previously conducted by most compliance score studies such as Al-Shiab (2003), Al-Shammari et al. (2008), and Tsalavoutas (2011).
Following this proposition, the log of the odds ratio was then computed as follows (by assuming that the compliance score of a company is given by p):
where:
Y! the transformed level of compliance, and
p ! the ratio of companies’ compliance computed with either Cooke’s method or the PC method.
Moreover, OLS regression based on the log of the odds ratio was developed as follows:
where:
ComSco! the transformed score of a company’s compliance with IFRS-based PSAK disclosure requirements, where the score is calculated based on two methods of disclosure index, Cooke’s and PC.
LIQU! the ratio of current assets to current liabilities. LEVE! the ratio of total debt to total shareholders’ equity. SIZE! the natural logarithm of total assets.
ROE! the ratio of net income to average common shareholders’ equity.
AUDI! audit company dummy, which equals 1 if a company is audited by a Big Four auditor, and 0 otherwise.
MANU! manufacturing sector dummy, which equals 1 if a company is in the manufacturing sector and 0 otherwise.
For multivariate analysis, the best fitting regression model was chosen based on the lowest mean squared error (MSE). According to Doane and Seward (2011), when Fcalc is
close to 1, the values of the mean square due to regression (MSR) and MSE are close in magnitude, suggesting that none of the predictors provide a good predictive model for Y (i. e., all βj are equal to 0). Moreover, when the value of MSR is much greater than MSE, this suggests that at least one of the predictors in the regression model is significant (i.e., at least one βj is not equal to 0). In other words, the lowest standard error is good for prediction and otherwise the high score of standard deviation is not good for prediction. In this study, the level of significance was set as P<0.01, and SPSS software for windows version 16.0 (SPSS Inc., IL, USA) was employed to analyze the data.
This regression, based on the log of the odds ratio, was then conducted to test the hypothesis. An analysis of variance (ANOVA) was also conducted to analyze whether there were any significant differences between the means of specific-firm characteristics in disclosure. In addition, a paired sample t-test set as P<0.05 was conducted to compare the means between the two compliance scores that were calculated based on Cooke’s method
and the PC method. Before testing the hypothesis, the assumptions of the classical linear regression model were checked with a threshold (Gujarati 2003) as follows: VIF>10 for multicollinearity, p>0.05 for heteroskedasticity.
5. Results and Discussion
5.1 Degree of Compliance
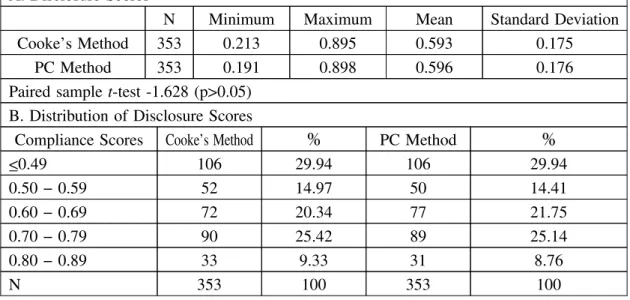
The extent to which Indonesian listed companies complied with IFRS-based PSAK disclosure requirements is presented in Table 3.
Panel A exhibits the values of mean and standard deviation of the two measurement methods employed in this study. Both methods produced almost the same figures, approximately 60 and 17% for mean and standard deviation respectively. This result was also indicated by the paired sample t-test (p>0.05), suggesting a statistically insignificant difference between the Cooke and PC values.
Similarly, the frequencies of the compliance scores as presented in Panel B of Table 3 supported the prior tests for both measurement methods. The first column of the table displays the range of the scores presented as less than or equal to 49%, 50-59%, 60-69%, 70-79%, and 80-89%. Both methods showed that about 30% of the listed companies examined comply with IFRS-based PSAK disclosure requirements at a level less than 50%. In addition, only 9.33% (Cooke) and 8.76% (PC) of companies complied with the requirements at a level greater than 80%. These two company percentages were the lowest of the analysis.
The levels of the compliance scores varied across standards. The highest levels for the year under investigation were for PSAK 1 Presentation of Financial Statements (not tabulated). Almost all listed companies complied with this standard at a level greater than 90%. The reason is likely to be the same as in prior studies; that is, the standard is a basic requirement to which companies can conform relatively easily. Moreover, complying with this standard is not associated with high proprietary costs (Al-Shammari et al. 2008, Tsalavoutas 2011). PSAK 16 Employee Benefits and PSAK 28 Accounting for Government Grants and Disclosure of Government Assistance (not tabulated) exhibit very low average levels of compliance. It is assumed that these two standards involve high proprietary costs; thus, most companies tended to violate their requirements (Tsalavoutas 2011).
Several inferences can be drawn from the findings presented in Table 3. The mean values implied that the compliance scores of Indonesian listed companies with regard to compliance with IFRS-based PSAK disclosure requirements are relative low. The explanation given for the low scores confirms that law enforcement mechanisms in Indonesia are not fully effective. Additionally, the country’s corporate governance is weak even though it has been significantly reformed (Setyadi et al. 2009). Further, the findings
are consistent with the argument of the World Bank (2010) that recognized Indonesia as a civil law country with poor law enforcement and no clear bankruptcy law. They also reflect the regulator’s lenient approach concerning compliance with IFRS-based PSAK standards during the initial period of their implementation (Tsalavoutas 2011). In general, the findings are in line with other studies that have investigated compliance with mandatory disclosures in ASEAN countries (Craig and Diga 1998) and emerging capital markets such as Zimbabwe (Owusu-Ansah 1998) and Bangladesh (Akhtaruddin 2005).
5.2 The Model
This section discusses the fitted regression model. As Section 4 stated, the minimization of the MSE was chosen as the best criterion for selecting a model in this study.
Before testing the hypothesis, data were checked with regard to the assumptions of classical linear regression. Testing for normality was conducted by using skewness and kurtosis ratios. Multicollinearity was checked with a variance inflation factor (VIF>10) as a threshold (Gujarati 2003: 262) and the VIF values were reported for each regression. Moreover, heteroskedasticity was checked by a Glejser test. Outliers were defined and excluded by using Cook’s distance as a measure (Fielding and Gilbert 2004, Pallant 2005). As presented in Table 4, the findings show that the data are free from these problems.
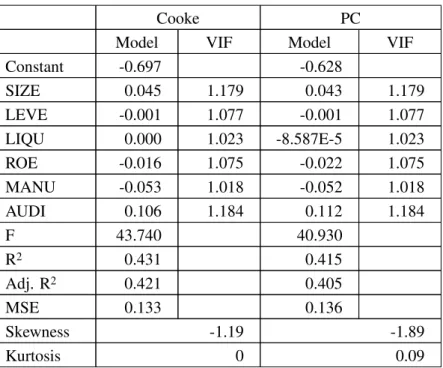
Table 4 also presents summary outputs of the compliance scores calculated by Cooke’s method and the PC method. Several inferences can be drawn from Table 4. First, the
Table 3. Descriptive Statistics of Disclosure Scores A. Disclosure Scores
N Minimum Maximum Mean Standard Deviation Cooke’s Method 353 0.213 0.895 0.593 0.175
PC Method 353 0.191 0.898 0.596 0.176 Paired sample t-test -1.628 (p>0.05)
B. Distribution of Disclosure Scores
Compliance Scores Cooke’s Method ! PC Method !
<_0.49 106 29.94 106 29.94 0.50 − 0.59 52 14.97 50 14.41 0.60 − 0.69 72 20.34 77 21.75 0.70 − 0.79 90 25.42 89 25.14 0.80 − 0.89 33 9.33 31 8.76 N 353 100 353 100
multiple R column shows an average simultaneous linear regression between dependent and independent variables constituting 66% for Cooke’s method and 64% for the PC method. Second, the coefficient determination (R2) is about 40% for both methods indicating that
40% of the variation in the compliance scores is explained by the six predictors employed in this study. Further, the remaining prediction could be explained by external factors that are not included in the regression model. The slight gap between R2 and adjusted R2
suggests that there are one or more weak predictors in the model (Doane and Seward 2011). A comparison between standard error and standard deviation values shows that the former is less than the latter, meaning that the regression model is better at predicting the compliance scores.
Additional information that can be drawn from Table 4 concerns analysis of variance (ANOVA). Cooke’s method and the PC method show large F-value results accompanying small p-values (<0.05). This indicates that the predictors are simultaneously significant for the prediction of the levels of companies’ compliance with IFRS-based PSAK disclosure requirements.
The sign of the correlation coefficient, according to Cooke’s method, shows that the predictors, company size, liquidity, and audit company, had a positive association with compliance scores, while leverage, ROE, and manufacturing sector show contrasting results.
Table 4 The Findings of Multivariate Analyses
Cooke PC
Model VIF Model VIF Constant -0.697 -0.628 SIZE 0.045 1.179 0.043 1.179 LEVE -0.001 1.077 -0.001 1.077 LIQU 0.000 1.023 -8.587E-5 1.023 ROE -0.016 1.075 -0.022 1.075 MANU -0.053 1.018 -0.052 1.018 AUDI 0.106 1.184 0.112 1.184 F 43.740 40.930 R2 0.431 0.415 Adj. R2 0.421 0.405 MSE 0.133 0.136 Skewness -1.19 -1.89 Kurtosis 0 0.09
This means that an increase in score is consistent with an increase in company size and liquidity as well as the use of Big Four auditors. Further, the decrease in leverage and ROE has encouraged companies to increase their disclosure requirements. In addition, it seems that the type of industry did not have a direct association with the levels of companies’ compliance with IFRS-based PSAK disclosure requirements in the first year of implementation, 2012. In contrast, liquidity shows a negative association with the PC method, which suggests that this predictor had no direct association with the levels of companies’ compliance.
5.3 Evidence from Indonesian Listed Companies
This section discusses the main empirical results obtained from testing whether the degree of company compliance with IFRS-based PSAK disclosure requirements had been influenced by firm characteristics.
The figures presented in Table 4 (the column model) explain factors that influence the levels of companies’ compliance with the disclosure required by IFRS-based PSAK. Both methods show that predictor size, audit company, and manufacturing sector (p-values are lower than 5%) had a significant influence. In contrast, predictor liquidity and ROE insignificantly affected the degree of companies’ compliance with disclosure requirements (p -values are higher than 5%).
As predicted, the effect of company size on disclosure level confirms the hypothesized positive association between size and levels of mandatory disclosure. This indicates that company size is statistically significant, at a 0.05 level, to the extent of mandatory disclosure by the sample of listed companies in their annual reports. Further, the positive sign on the coefficient suggests that size had a direct influence on the level of companies’ disclosure in Indonesia. This finding confirms the results reported by the majority of prior research; for example, Wallace and Naser (1995), Craig and Diga (1998), Owusu-Ansah (1998), Aljifri (2008), Al-Shammari et al. (2008), Hossain and Hammami (2009), Setyadi et al. (2009) and Al-Mutawaa and Hewaidy (2010).
Similarly, the regression model on companies with Big Four auditors exhibits positive signs and is statistically significant at the 0.05 level. The finding confirms the hypothesized positive association between audit companies and the level of mandatory disclosure. This strong evidence is consistent with Tsalavoutas’s (2011) study, which stated that companies with Big Four auditors generally comply with IFRS mandatory disclosure. In the context of Greece, Tsalavoutas (2011) correlated the finding with prior evidence that higher earnings management and lower audit effort is common among companies with small auditors.
The explanation of the findings for Indonesia should be correlated with capital needs theory. Such theory posits that a primary motivation for companies to increase disclosure is
the need to raise capital (Abd-Elsalam and Weetman 2003). Managers could perceive that higher levels of financial disclosure lead to lower costs for new capital because such disclosure reduces information asymmetries (Choi 1973, Firth 1980, Cooke, 1993).
After experiencing the severe Asian financial crisis of 1997-1998, Indonesia saw a significant increase in the role of the capital market as an alternative source of long-term financing for business entities (Rosul 2002). Listed companies now compete with each other in order to attract financing from domestic or overseas investors by disclosing more information regarding risk and future prospects. According to Hope (2003), the level of mandatory disclosure detail can provide insights for assessing a company’s sustainability of earnings and can help financial analysts. In this regard, disclosing information that is required by IFRS mandated disclosure could provide investors with the information they seek.
The finding about the effect of the size variable on corporate disclosure levels is also similar to most findings uncovered by prior studies, which are mainly concerned with cost-based theories related to information and political costs. For instance, larger companies that provide more information reduce production costs (Owusu-Ansah 1998), lower the cost of disclosure (Ho and Wong 2001), and cut the competitive cost of disclosure by meeting the increased demand for reducing uncertainty about quality and expected returns (Ferguson et al. 2002). In addition, Craig and Diga (1998) argued that size could be a proxy for the breadth and complexity of company operations in one country and for political cost in another.
Further, large corporate clients, because of their size and complexity, tend to employ large auditors that have established themselves over time with the necessary technical base and expertise in order to fulfill client needs. Large companies face expensive punitive measures if they violate stock exchange listing requirements and the demands of trustee monitoring through inadvertent non-compliance with statutory disclosures. In addition, many international conglomerates face mandatory disclosure requirements, which change over time, country by country. In order to minimize the risk of non-compliance with such changes, it is incumbent on these large companies to employ the resources of international auditors, which are by their nature the larger audit companies. Therefore, it is not surprising that an association exists between large auditors and higher statutory disclosure levels (Ahmed and Courtis 1999).
Additionally, considering the particular context of Indonesia, agency propositions and signaling theories provide the basis for interpreting the finding about the association between audit companies and higher mandatory disclosure levels. Implementing IFRS-based PSAK for the first time is challenging. This practice is complex, and the lack of qualified professionals among accountants in Indonesia could hinder transparency and the need for
better quality financial reporting (Worldbank 2010). International auditors are likely to have greater competence and expertise about the IFRS in addition to well-established reputations (Dumontier and Raffournier 1998), whereas small audit companies could lack the combination of qualified personnel and internal controls needed to ensure compliance (Ettredge et al. 2011). Therefore, hiring the Big Four auditors could reduce errors or misrepresentations in corporate reports (DeAngelo 1981), act as a monitoring mechanism, and satisfy the aforementioned needs. Consequently, agency costs fall and levels of compliance rise, and clients can attract more outside investors (Tsalavoutas 2011).
This study found that variable profitability measured as ROE is not significant; therefore, the hypothesis is not supported. This implies that more companies that are profitable do not disclose significantly more mandatory information than less profitable ones. Such evidence is in line with some prior studies (Wallace and Naser 1995, Aljifri 2008, Hossain and Hammami 2009). Other studies (Owusu-Ansah 1998, Leuz 2003, Al-Shammari, Brown, and Tarca 2008, Li and Harrison 2008) show a positive influence. The negative effect of profitability on disclosure levels provides some weak support for the signaling hypothesis, which posits that superior and profitable firms are more likely to disclose more information for investors. Annual reports, however, are not the only means of communicating information. Other sources are employed by companies to convey good news (Ahmed and Courtis 1999).
Table 4 shows that liquidity has no correlation with the degree of companies’ compliance with IFRS-based PSAK disclosure requirements. The irrelevance of liquidity as an explanatory variable in Indonesia agrees with the findings of Wallace and Naser’s (1995) and Owusu-Ansah’s (1998) studies in Hong Kong and Zimbabwe respectively. They argued that a company with a lower liquidity ratio has a greater need to allay the information asymmetry concerns of investors and lenders by providing enhanced disclosure. However, this does not seem to apply to Indonesian-listed companies for which liquidity is not correlated with disclosure requirements. Although a significant finding was expected, this is consistent with the findings of some prior studies (Wallace and Nasser 1995, Owusu-Ansah and Yeoh 2005, Al-Shammari et al. 2008) and could indicate that companies with lower liquidity find other means to communicate their financial soundness.
6. Conclusions, Limitations, and Suggestions for Future Research
The purpose of the present study is to examine the extent to which Indonesian listed companies comply with IFRS-based PSAK disclosure requirements and to investigate the factors that influence disclosure practices. The findings show that Indonesian listed companies had a low average level of compliance with IFRS-based PSAK requirements in 2012. This compliance was approximately 60% of the items in the index, measured by
using Cooke’s method and the PC method. This result is consistent with prior studies that investigated compliance with mandatory disclosures in ASEAN countries (Craig and Diga 1998) and emerging capital markets such as Zimbabwe (Owusu-Ansah 1998) and Bangladesh (Akhtaruddin 2005).
It seems that the low compliance score for the Indonesian context is consistent with the evidence that law enforcement mechanisms in the country are not fully effective and are accompanied by weak corporate governance (Setyadi et al. 2009). In addition, the finding is consistent with the argument of the World Bank (2005), which recognized Indonesia as a civil law country with poor law enforcement and no clear bankruptcy law. It also reflects the regulator’s lenient approach concerning compliance with IFRS-based PSAK during the initial period of the standards’ implementation.
Further, regression analysis to investigate the factors that influence compliance levels illustrates that companies were more compliant with IFRS-based PSAK disclosure requirements in 2012 when they had the following characteristics: they were large, employed Big Four auditors, and were in the manufacturing industry. For Indonesia, the findings should be correlated with capital needs theory, which posits that a primary motivation for companies to increase disclosure is the need to raise capital. In order to attract more financing from investors, large companies enhance mandatory disclosure. Moreover, because the implementation of IFRS-based PSAK is complex, and there is a shortage of qualified professionals who are familiar with the new standards, most companies hire Big Four auditors. Such auditors are more likely to have IFRS competency and experience.
A single year investigation is the main shortcoming of this study. Understanding the nature of overall disclosure is needed in order to undertake a study using more than two years’ data for comparative purposes. Further, this research is limited to nonfinancial listed companies; therefore, future research could investigate other industries because they are likely to have more stringent financial reporting regulations.
References
Abd-Elsalam, O., and P. Weetman. “Introducing International Accounting Standards to An Emerging Capital Market: Relative Familiarity and Language Effect in Egypt.” Journal of International Accounting, Auditing and Taxation 29 (2), 2003: 63-84.
Abdelsalam, O. H., and P. Weetman. “Measuring Accounting in A Period of Complex Changes: The Case of Egypt.” Advances in International Accounting 20, 2007: 75-104.
Abdulla, J. “Corporate Financing Policy in Oman: Perceptions of Executives.” Asian Review of Accounting 6 (2), 1998: 117-142.
Abdullah, M., and M. Minhat. “Measuring Compliance with IFRS Mandatory Disclosure Requirements: Some Evidence from Malaysia.” Australian Journal of Basic and Applied Sciences 7 (8), 2013: 163-169.
Ahmed, K., and J.K. Courtis. “Associations between Corporate Characteristics and Disclosure Levels in Annual Reports: A Meta-Analysis.” The British Accounting Review 31 (1), 1999: 35-61.
Akhtaruddin, M. “Corporate Mandatory Disclosure Practices in Bangladesh.” The International Journal of Accounting 40, 2005: 399-422.
Ali, J. M., K. Ahmed, and D. Henry. “Disclosure Compliance with National Accounting Standards by Listed Companiees in South Asia.” Accounting and Business Research 34 (3), 2004: 183-199.
Aljifri, K. “Annual Report Disclosure in A Developing Country: The Case of the UAE.” Advances in International Accounting 24, 2008: 98-100.
Al-Mutawaa, A., and A. M. Hewaidy. “Disclosure Level and Compliance with IFRSs: An Empirical Investigation of Kuwaiti Companies.” International Business & Research Journal 9 (5), 2010: 33-50. Al-Shammari, B., P. Brown, and A. Tarca. “An Investigation of Compliance with International Accounting
Standards by Listed Companies in the Gulf Co-Operation Council Member States.” The International Journal of Accounting 43, 2008: 425-447.
Al-Shimmiri, T.B. “Capital Structure and Performance of Non Taxpaying Entities.” Arab Journal of Administrative Sciences 10 (3), 2003: 363-385.
Ball, R., and G. Foster. “Corporate Financial Reporting: A Methodological Review of Empirical Research.” Journal of Accounting Research 20 (Supplement), 1982: 161-234.
Belkaoui, A., and A. Kahl. Corporate Financial Disclosure in Canada. Research Monograph No. 1, Vancouver: Canadian Certified General Accountants Association, 1978.
Belkaoui, A. “Levels of Financial Disclosure by European Firms and Relation to Country Return and Risk.” Advances in International Accounting 7, 1994: 171-181
Choi, F.D.S. “Financial Disclosure in Relation to a Firm’s Capital Costs.” Accounting and Business Research 3 (12), 1973: 282-292.
Cooke, T.E. “Disclosure in the Corporate Annual Reports of Swedish Companies.” Accounting and Business Research 19 (74), 1989: 113-124.
Cooke, T.E. “An Assessment of Voluntary Disclosure in the Annual Reports of Japanese Corporations.” International Journal of Accounting 26, 1991:174-189.
Cooke, T.E. “The Impact of Size, Stock Market Listing and Industry Type on Disclosure in the Annual Reports of Japanese Listed Corporations.” Accounting and Business Research 22 (87), 1992: 229-237 Cooke, T.E. “Disclosure in Japanese Corporate Annual Reports.” Journal of Business, Finance and
Accounting 10 (4), 1993: 521-535.
Craig, R., and J. Diga. “Corporate Accounting Diclosure in ASEAN.” Journal of International Financial Management and Accounting 9 (3), 1998: 246-274.
DeAngelo, L. “Auditor Size and Audit Quality.” Journal of Accounting and Economics 3 (3), 1981: 183-199.
Doane, D.P., and L.E. Seward. Applied Statistics and Business and Economics. New York: McGraw-Hill, 2011.
Dumontier, P., and B. Raffournier. “Why Firms Comply Voluntarily with IAS: An Empirical Analysis with Swiss Data.” Journal of International Financial Management and Accounting 9 (3), 1998: 216-245. Dye, R.A. “Strategic Accounting Choice and the Effects of Alternative Financial Reporting Requirements.” Journal of Accounting Research 23 (2), 1985: 544-574.
Dye, R.A. “Proprietary and Nonproprietary Disclosures.” Journal of Business 59 (2/1), 1986: 331-366. Dye, R.A. “Mandatory versus Voluntary Disclosures: The Case of Financial and Real Externalitties.” The
Accounting Review 65 (1), 1990: 1-24.
Elliott, R.K., and P.D. Jacobson. “Costs and Benefits of Business Information Disclosure: Commentary.” Accounting Horizons 8 (4), 1994: 80-96.
Ettredge, M.L., K.J. Stone, M. Stone, and Q. Wang. “The Effects of Firm Size, Corporate Governance Quality and Bad News on Disclosure Compliance.” Review of Accounting Studies. 2011. http://ssrn.com /abstract=955922 (accessed April 18, 2014).
Ferguson, M.J., C.K.K. Lam, and G.M. Lee. “Voluntary Disclosure by Stated-owned Enterprises Listed on the Stock Exchange of Hong Kong.” Journal of International Management and Accounting 13 (2), 2002: 125-152.
Fielding, J., and Gilbert N. “Understanding Social Statistics.” London: Sage Publications, 2004.
Firth, M. “Impact of Size, Stock Market Listing and Auditors on Voluntary Disclosure in Corporate Annual Reports.” Accounting and Business Research 9 (36), 1980: 273-280.
Glaum, M., and D. Street. “Compliance with the Disclosure Requirements of Germany’s New Market: IAS versus US GAAP.” Journal of International Financial Management and Accounting 14 (1), 2003: 64-100.
Gujarati, Damodar N. “Basic Econometrics Fourth Edition.” New York: McGraw-Hill, 2003.
Ho, S.S.M, and K.S Wong. “A Study of Corporate Disclosure Practicess and Effectiveness in Hong Kong.” Journal of International Financial Management and Accounting 12 (1), 2001: 75-101.
Hope, O. “Disclosure Practices, Enforcement of Accounting Standards and Analysts’ Forecast Accuracy: An International Study.” Journal of Accounting Research 2 (4), 2003: 235-272.
Hossain, M., and H. Hammami. “Voluntary Disclosure in the Annual Reports of An Emerging Country: The Case of Qatar.” Advances in International Accounting 25, 2009: 255-265.
Iatridis, G. “Accounting Disclosure and Firms’ Financial Attributes: Evidence from the UK Stock Market.” International Review of Financial Analysis 17, 2008: 219-241.
IDX. Indonesia Stock Exchange. 2012. http://www.idx.co.id/Portals/0/StaticData/AboutUs/AnnualReport/ FileDownload/Annual-Report-2013.pdf (accessed February 9, 2014).
Joshi, L., and H. Al-Bastaki. “Judgement-based Accounting: A Survey of Accountants’ Practices in Bahrain.” Paper presented at the 23rd Annual European Accounting Association Congress. Munich, 2000.
Lang, M.H, and R.J. Lundholm. “Cross-sectional Determinants of Analyst Rating of Corporate Disclosures.” Journal of Accounting Research 31 (2), 1993: 246-271.
Leuz, C. “IAS versus US GAAP: Information-Asymmetry Based Evidence from Germany’s New Market.” Journal of Accounting Research 41 (3), 2003: 445-472.
Levich, R.M. “The Importance of Emerging Capital Markets.” 4th Annual Conference on “Integrating the Emerging Market Countries into the Global Financial System. Washington, D.C, 2001.
Li, J., and J.R. Harrison. “National Culture and the Composition and Leadership Structure of Boards of Directors.” Journal Compilation (Blackwell Publishing, Ltd), 2008: 375-385.
Lobo, G.J., and J. Zhou. “Disclosure Quality and Earnings Management.” Asia-Pacific Journal of Accounting and Economics 8 (1), 2001: 1-20.
Mayhew, B.W., J.W. Schatzberg, and G.R. Sevcik. “The Effect of Accounting Uncertainty and Auditor Reputation on Auditor Objectivity.” Auditing: A Journal of Practice & Theory 27 (2), 2001: 49-70. Owusu-Ansah, S. “The Impact of Corporate Attributes on the Extent of Mandatory Disclosure and
Reporting by Listed Companies in Zimbabwe.” The International Journal of Accounting 33 (5), 1998: 605-631.
Pallant, J. “SPSS Survival Manual: A Step by Step Guide to Data Analysis using SPSS Version 12. Berkshire: Open University Press, USA, 2005.
Rosul, M. “The Capital Market in Indonesia’s Economy: Development and Prospects.” AT10 Research Conference. 2002.
Salamon, G.L., and D.S. Dhaliwal. “Company Size and Financial Disclosure Requirements with Evidence from the Segmental Reporting Issue.” Journal of Business Finance and Accounting 7 (4), 1980: 555-568.
Setyadi, A., G. Tower Rusmin, and A.M. Brown. “Indonesia’s Aggregated Accounting Regulatory Compliance.” JAAI 12 (2), 2009: 99-129.
Spathis, C.T. “Detecting False Financial Statements using Published Data: Some Evidence from Greece.” Managerial Auditing Journal 17 (4), 2002: 179-191.
Street, D., and S. Gray. “Factors Influencing the Extent of Corporate Compliance with International Accounting Standards: Summary of A Research Monograph.” Journal of International Accounting, Auditing and Taxation 11 (1), 2002: 51-76.
Tsalavoutas, I. “Transition to IFRS and Compliance with Mandatory Disclosure Requirements: What is the Signal?” Advances in International Accounting 27, 2011: 390-405.
Wallace, R.S.O., and K. Naser. “Firm-specific Determinants of the Comprehensiveness of Mandatory Disclosures in the Corporate Annual Reports of Firms Listed on the Stock Exchange of Hong Kong.” Journal of Accounting and Public Policy 14 (4), 1995: 311-368.
Wallace, R.S.O., K. Naser, and A. Mora. “The Relationship between the Comprehensiveness of Corporate Annual Reports and Firm Characteristics in Spain.” Accounting and Business Research 25 (97), 1994: 41-53.
Watts, R.L., and J.L. Zimmerman. “Towards A Positive Theory of the Determination of Accounting Standards.” The Accounting Review 53 (1), 1978: 112-143.
Worldbank. “Report on the Observance Standards and Codes (ROSC) Indonesia Accounting and Auditing.” World bank Web site. 2010. http://www.worldbank.org/ifa/rosc_aa.html (accessed February 12, 2013). Yeoh, J. “Compliance with Mandatory Disclosure Requirements by New Zealand Listed Companies.”