6. Social Cleavages and Volatility
権利
Copyrights 日本貿易振興機構(ジェトロ)アジア
経済研究所 / Institute of Developing
Economies, Japan External Trade Organization
(IDE-JETRO) http://www.ide.go.jp
シリーズタイトル(英
)
Occasional Papers Series
シリーズ番号
41
journal or
publication title
Electoral Volatility in Turkey - Cleavages vs.
the Economy
page range
59-82
year
2007
6
Social Cleavages and Volatility
This chapter investigates the relationship between social cleavages and cleavage-type volatilities in Turkey during the 1961–2002 period at the provincial level. First, rather than postulating certain cleavages, it starts with pooled-factor analyses of provincial voting patterns in order to extract those factors that potentially represent major social cleavages. These factors point to three major social cleavages, formed by Sunni religiosity, Kurdish ethnicity, and Alevi sectarianism,1 respectively. Second, demo-graphic data on these social groups in Turkey are used to operationalize social cleav-ages. Third, both the long-term and short-term relationships between social cleavages and cleavage-type volatilities are analyzed.
This chapter also examines the dynamics of party-system institutionalization in democratization processes. While Turkey made a transition to a multiparty system in 1946, it experienced two military interventions, in 1960 and 1980. In other words, electoral democracy is not new in Turkey but has not been very stable. At the same time, discontinuities of the Turkish party system associated with the two military interventions have resulted in two cycles of party-system institutionalization.2 The period under study, 1961–2002, can thus be divided into the pre-1980 period (1961– 1977) and the post-1980 period (1987–2002). The two years in each pair of parenthe-ses indicate the first and the last free elections in each period.
The results of multiple regressions show that in the long-term, social cleavages on the whole have increased rather than reduced type volatilities. The cleavage-volatility relationship, however, has changed over time. Repeated elections since each civilian transition (in 1961 and 1983) have mitigated the volatile effect of social cleavages on voting behavior, as political parties have become more representative of the existing social cleavages.
6.1. Choice of Cleavages
Which social cleavages should be included in the analysis of electoral volatility? Before making a choice of cleavages, we must first define them. The definition of cleavages, however, has been vague. Lipset and Rokkan (1967) cited four social cleavages, i.e., center-periphery, secular-religious, urban-rural, and capital-labor, for their explanation of the emergence of the Western European party system, but did not give a descriptive definition of what constitutes a cleavage.3 Some scholars did make descriptive but very broad definitions. One group of such definitions can be character-ized as “minimalist” in that any difference in ethnicity, religiosity, culture, language, or class can constitute a cleavage. Similarly, “political definitions” assume that politi-cal polarization or differences in politipoliti-cal values can form a cleavage (Table 6-1).
Beginning in the 1990s, however, more refined definitions began to be adopted. These “maximalist” definitions require three constitutive elements. One is social demographic attributes, a second is values or ideology, and a third is an organization that forms a “system of closure.” A review of past definitions also reveals that it did not make any conceptual difference whether the adjectives “social” or “political” were used in front of “cleavage,” as can be seen in Table 6-1.
This study conceptually adopts the maximalist definition of social cleavages, which requires socio-demographic attributes, values/ideology, and organizational expres-sion. Operationally, first of all, shared values/ideology and organizations are delin-eated by a factor analysis of provincial voting patterns. Then, socio-demographic attributes that match the previous two elements are chosen. The first step therefore is to choose social cleavages that most effectively influence provincial voting patterns. It is hypothesized that strong social cleavages reduce electoral volatility, while weak social cleavages reinforce it.
It is much more difficult to measure the strength of social cleavages across prov-inces in a single country than to do cross-country studies, for both practical and theoretical reasons. In practice, little information is available about how the level of group identification varies across provinces. Theoretically, if attitudinal variables such as group identification are to be approximated by socio-demographic variables, it is not very clear which socio-demographic features help to nurture strong social cleavages. Moreover, both practically and theoretically, the conventional index of cleavage, i.e., segmentation4 is more difficult to apply to a province than to the country as a whole. Even if the level of segmentation is the same between two provinces, the provincial majority may not always coincide with the national major-ity. If the party system underrepresents the provincial majority, a low level of segmen-tation may lead to voting instability rather than stability. This is because a large bloc of votes implies a lack of strong party loyalties.
To analyze cleavage strength at the provincial level, therefore, it makes more sense to measure the strength of each major social cleavage from the relative population size of major national minorities in the province. Let us assume here that: (1) each social
cleavage in the province is formed by one of the major national minorities, on the one hand, and the residual groups (consisting of the national majority group and the less relevant minority groups), on the other, and that (2) the prominence of each social cleavage in the province depends on whether a particular minority accounts for a large proportion of the population in the province. If this is so, the strength of each social cleavage can be measured by the percentage of that minority population within the total population of the province. It is preferable to choose these major national minority groups as objectively as possible.
Pooled-factor analysis of party votes by province enables us to elicit potential social cleavages that include the most relevant minority groups. Ergüder and Hofferbert (1988) were the first to apply this approach for Turkey. This study adopted basically
TABLE 6-1 DEfiNITIONS OF SOCIAL CLEAVAGES
Sources Name Scope Definition
Dahl (1966a, pp. 8–59; 1966b, C (1)′ Polarizing axes that divide political forcesa pp. 61–371; 1971, pp. 105–23;
1973, pp. 4–10)
Lipset and Rokkan (1967) C (3)′ Conflict dimensions for social forces formed during nation-state building and industrial revolutiona
Rae and Taylor (1970, p. 1) P/C (1) Criteria that distinguish community members in terms of traits, attitudes, and behavior Zuckerman (1982, p. 131) P (2) Broad and enduring political divisions Dalton, Flanagan, and Beck (1984) S (1) Same as Lipset and Rokkan (1967) and
Inglehart (1984)a
Inglehart (1984) P (2) Patterns of stable polarization in the relation-ship between groups and policy/parties Lane and Erssen (1987, p. 39)b C (1)′ Individual, group, or organizational divisions
that may lead to conflict
Bartolini and Mair (1990) C (3) Formed by groups that share socio-demo-graphic attributes, collective identity, and organizational expression
Gallagher, Laver, and Mair (1992) C (3) Same as Bartolini and Mair (1990) Knutsen and Scarbrough (1995) C (3) Formed by groups that share social structural
differences values, and organization Kitschelt et al. (1999) P/C (3) Political differences based on structural and
persisting social divisions
Moreno (1999) P (3) Same as Knutsen and Scarbrough (1995)
Source: Compiled by the author from the above sources.
Notes: 1. C= cleavages, P = political cleavages, S = social cleavages.
2. (1)= miminalist definition, (2) = political definition, (3) = maximalist definition. (′) assumes that cleavages bring about manifest or potential conflict.
aContextually judged due to a lack of descriptive definition. bThe same definition is applied in Lane and Erssen (1999, p. 41).
. . . . . . . . . . . . . . . . . . . . . . . . . . . . . . . . . . . . . . . . . . . .
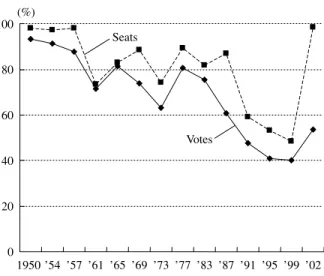
the same approach, albeit with a different objective. While they let the factors repre-sent potential major social cleavages, this study uses them only as clues to discover demographic variables that may constitute social cleavages. Unlike Çarko%glu and Avcı (2002),5 the current research applies factor analysis separately to the pre- and post-1980 periods6 since the party system and political parties that constituted them were not very similar between the two periods. The Turkish party system became increasingly fragmented during the four decades, from a two-party system during the 1950–60 period, a dominant two-party system during the 1961–77 period, to a five-party system during the 1987–2002 period (Figure 6-1).7 The combined vote percent-age of the largest two parties declined from 74.2 on averpercent-age for the 1965–77 elections to 47.5 on average for the 1987–99 elections.8
This study adopted the following procedures for factor extraction. First, the prin-ciple factor method9 was used for initial factor extraction and the factors with eigen-values greater than a value of one (a conventional cut-off point) were initially re-tained. The number was five and six for the pre- and post-1980 periods, respectively. Second, contrary to orthodoxy, the initially retained factors were not rotated. Since the variables (party vote rates) used in this analysis have a highly coherent structure in that the summation of the party vote rates for the same election must add up (nearly) to a value of one, the initial factor loadings display a generally realistic and interpret-able picture. Both orthogonal and oblique rotations resulted in distortions by inflating the few highest factor loadings on a particular factor in order to produce a “simple structure.” In reality, it makes more sense to make up a factor (representing a social cleavage) with a gradation, instead of a dichotomy, of factor loadings.10 Third, the number of factors to be finally retained was decided so that each factor would include
Fig. 6-1. Votes and Seats of the Largest Two Parties, 1950–2002
Source: Compiled by the author from Appendix III.
0 20 40 60 80 100 1950 ’54 ’57 ’61 ’65 ’69 ’73 ’77 ’83 ’87 ’91 ’95 ’99 ’02 (%) Votes Seats
at least one party (regardless of the election year)11 whose factor loading on that particular factor was above 0.71 or below −0.71 (50 percent overlapping variance).
For the pre-1980 period, the results were very similar to those of Ergüder and Hofferbert (1988), who demonstrated for the pre-1980 (1965–77) period that voting variations across provinces in Turkey depended on the periphery-center, left-right,
TABLE 6-2
FACTOR ANALYSIS OF PROVINCIAL VOTING BEHAVIOR, 1965–77 (N= 67)
Factor 1: Factor 2: Factor 3:
Periphery-Center Left-Right Anti-systemic
Party LoadingFactor Party LoadingFactor Party LoadingFactor
Pers69 0.91019 CHP73 0.78688 MHP77 0.89142 Pers65 0.79996 CHP77 0.77927 MHP73 0.71527 MSP77 0.78956 Left69 0.70437 MSP73 0.63089 Pers77 0.78859 Left65 0.59185 Left69 0.26452
Pers73 0.75455 CHP65 0.55297 Left77 0.20355 MSP73 0.40922 Left77 0.5486 AP65 0.11253 MHP77 0.1087 CHP69 0.38079 AP69 0.10974 Left65 0.06794 MHP77 0.22182 Pers65 0.05952 CHP65 0.01306 MHP73 0.0922 AP77 0.03347 MHP73 0.01113 MSP73 -0.03252 MSP77 0.02008
Left69 −0.00469 Pers69 −0.05274 Pers69 −0.16471
Left77 −0.05505 Pers65 −0.07311 CHP77 −0.1651
CHP73 −0.39187 MSP77 −0.13347 CHP69 −0.17437
CHP69 −0.49899 Pers77 −0.17612 AP73 −0.1763
CHP77 −0.50888 Pers73 −0.26437 Left65 −0.17907
AP73 −0.70545 AP65 −0.27574 CHP73 −0.22858
AP77 −0.73886 AP69 −0.47842 Pers73 −0.23786
AP69 −0.79613 AP73 −0.52414 CHP65 −0.30552
AP65 −0.84479 AP77 −0.58984 Pers77 −0.31235
Percentage of variance explained
35.67 21.47 12.51
Source: Calculated by the author from SIS (1998a).
Notes: 1. Entries are varimax factor loadings calculated from the percentages of votes that each political party received in the provinces during the 1965, 1969, 1973, and 1977 general elections. Factor loadings equal to or above 0.50 (or below −0.50) are indicated in bold. 2. Eigenvalues of the reduced correlation matrix that are greater than one are as follows.
Factor 1 2 3 4 5
Eigenvalue 6.52 3.94 2.29 1.33 1.13
3. Although this table is in essence a replication of Table 2 by Ergüder and Hofferbert (1988), each factor loading does not strictly match theirs due to possible methodological differences in factor analysis. Ergüder and Hofferbert did not show their methods for factor analysis.
4. Abbreviations of the political parties are as follows: AP= Justice Party: center-right; CHP= Republican People’s Party: center-left; MSP = National Salvation Party: pro-Is-lamic; MHP= Nationalist Action Party: far-right; Left = Turkish Labor Party, Turkish Union Party; Pers (Minor and personalistic parities)= Republican Reliance Party, Re-publican Peasants’ Nation Party, Democratic Party, New Turkey Party, Independents.
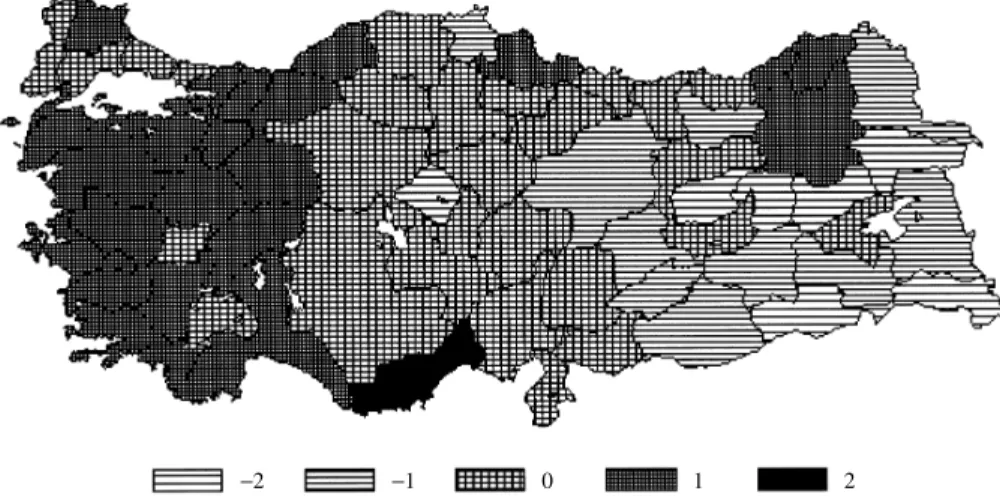
and anti-systemic factors (Table 6-2).12 The “periphery” end of the first factor repre-sented the less developed Kurdish region, where personality-based parties and inde-pendents were strong. Hereafter, the more conventional “center-periphery” phrase (rather than “periphery-center”) will be used. The necessary adjustments for the factor loadings and factor scores were made by converting their pluses into minuses and vice versa. The “left” end of the second factor reflected support for the secular CHP from the Alevi sect. The one-tailed anti-systemic factor more strongly embodied far-right, i.e., religious and nationalistic, votes than far-left votes (Ergüder and Hofferbert 1988, pp. 91–93). The author calculated factor scores for the pre-1980 factors, which were not reported by Ergüder and Hofferbert. The provincial distribu-tion of factor scores for the pre-1980 factors is shown in Figure 6-2a, Figure 6-2b, and Figure 6-2c.
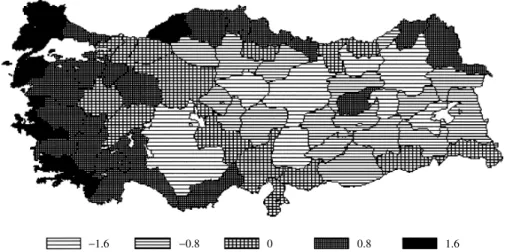
For the post-1980 period, three factors, i.e., secular-religious, Turk-Kurd, and Alevi factors, were extracted and retained (Table 6-3). The secular-religious factor finds the secular DSP to be on the secular pole13 and the pro-Islamic Welfare Party (Refah Partisi, RP) on the religious pole. The Turk-Kurd factor is represented by one party of strong Turkish-nationalism, Nationalist Action Party (Milliyetçi Hareket Partisi, MHP), on one hand, and one party of Kurdish nationalism, People’s Democracy Party (Halkın Demokrasi Partisi, HADEP) along with the Social Democratic Populist Party (Sosyal Demokratik Halkçı Parti, SHP) of 1991, which had then formed an electoral alliance with HADEP’s predecessor, People’s Labor Party (Halkın Emek Partisi, HEP), on the other. The Alevi factor is strongly determined by the vote for the secular CHP, which has a solid Alevi constituency across the country, as was the case for the pre-1980 period. The geographical distribution (by province) of each factor, in terms of factor score, is shown in Figure 6-3a, Figure 6-3b, and Figure 6-3c.
−2 −1 0 1 2
Source: Compiled by the author from SIS (1998a).
Note: The map shows mid-points of factor scores by province. Fig. 6-2a. Center-Periphery, Pre-1980
−2.4 −1.2 0 1.2 2.4
Source: Same as for Figure 6-2a.
Fig. 6-2b. Left-Right, Pre-1980
1 0 1 2 3
Fig. 6-2c. Anti-systemic, Pre-1980
Source: Same as for Figure 6-2a.
The results of the two factor analyses thus indicate the presence of common fea-tures underlying the two sets of factors. Both the pre- and post-1980 factors suggest that devout Sunnis, ethnic Kurds, and members of the Alevi sect form minority poles in the major social cleavages in Turkey. First, while the overwhelming majority of Turks are Sunni Muslims, the majority support the present secular regime and lifestyle. Those arguing for the introduction of Islamic law form a tiny minority.14 Second, Kurds are the largest ethnic group in Turkey. The majority are Muslims, and they are divided into Sunnis and Alevis, just as are non-Kurdish Turks. Although no official
TABLE 6-3
FACTOR ANALYSIS OF PROVINCIAL VOTING BEHAVIOR, 1987–99 (N= 67)
Factor 1: Factor 2: Factor 3:
Secular-Religious Turks-Kurds Alevi
Party LoadingFactor Party LoadingFactor Party LoadingFactor
DSP99 0.87624 MHP99 0.84338 CHP99 0.86126 DSP95 0.81600 MHP95 0.60143 CHP95 0.80954 DSP91 0.71497 MÇP87 0.54605 SHP87 0.71218 DYP95 0.65199 ANAP87 0.44614 SHP91 0.57165 DSP87 0.53914 DYP91 0.36909 MHP95 0.34751 SHP87 0.49967 DYP87 0.31533 MÇP87 0.33344 DYP91 0.41076 RP91 0.28198 MHP99 0.24270
ANAP99 0.33919 DYP95 0.26906 ANAP87 0.10970
CHP95 0.27486 DSP91 0.26772 RP91 0.01570 CHP99 0.19559 DSP99 0.23034 DSP99 −0.00067 DYP87 0.16233 DSP95 0.22432 RP95 −0.03689 DYP99 0.08434 CHP95 0.19928 DSP95 −0.04389 SHP91 0.05025 ANAP95 0.18374 DSP91 −0.05117 ANAP91 0.00554 FP99 0.17846 DSP87 −0.05909 ANAP95 −0.00188 RP95 0.16180 HADEP95 −0.07834 HADEP95 −0.20220 CHP99 0.07719 FP99 −0.11210
ANAP87 −0.21755 ANAP91 0.05306 HADEP99 −0.13218
HADEP99 −0.23597 DYP99 −0.01286 DYP95 −0.28033
MHP99 −0.25131 ANAP99 −0.03598 ANAP91 −0.29897 MHP95 −0.28891 DSP87 −0.27118 RP87 −0.31379 MÇP87 −0.55610 SHP87 −0.33160 DYP99 −0.36701 RP87 −0.73020 RP87 −0.39845 ANAP95 −0.43178 FP99 −0.83050 SHP91 −0.68310 ANAP99 −0.49432 RP95 −0.89650 HADEP95 −0.86470 DYP91 −0.50850 RP91 −0.90760 HADEP99 −0.86860 DYP87 −0.59760
Percentage of variance explained
28.27 19.08 16.76
Sources: Calculated by the author from SIS (1998a, 1998b, 2000).
Notes: 1. Entries are factor loadings calculated, by the principle factor method, from the percent-ages of votes received by each political party in the provinces during the 1987, 1991, 1995, and 1999 general elections. Factor loadings equal to or above 0.50 (or below −0.50) are indicated in bold.
2. The eigenvalues of the reduced correlation matrix that are greater than one are as fol-lows.
Factor 1 2 3 4 5 6
Eigenvalue 6.79 4.59 4.03 3.12 1.67 1.22
3. Abbreviations of the political parties are as follows: RP= Welfare Party, pro-Islamic; FP= Virtue Party, pro-Islamic, succeeding the RP; ANAP = Motherland Party, center-right; DYP= True Path Party, center-right; DSP = Democratic Left Party, center-left; SHP= Social Democratic Populist Party, center-left and supported by Alevi sect Mus-lims, succeeded by the CHP, allied with pro-Kurdish HEP for the 991 election; CHP= Republican People’s Party, center-left, succeeding the SHP; MÇP = Nationalist Work Party, far right, succeeded by the MHP; MHP= Nationalist Action Party, far right, succeeding the MÇP; HADEP= People’s Democracy Party, pro-Kurdish.
−1.6 −0.8 0 0.8 1.6
Fig. 6-3a. Factor 1: Secular-Religious, Post-1980
Sources: Compiled by the author from SIS (1998b, 2000).
−3 −2 −1 0 1
Fig. 6-3b. Factor 2: Turks-Kurds, Post-1980
Source: Same as for Figure 6-3a.
statistics have been recorded of ethnicity in Turkey since 1965, those whose mother tongue was the Kurdish language were estimated to account for 12.6 percent of the population as of 1990 (Mutlu 1996). Third, the Alevis are a mosaic of different non-orthodox or secular Muslims. The majority of Alevis denies strict adherence to the Koran and also shows tolerance to different religions.15 Individual surveys give sup-portive evidence to the above relationships between voter characteristics and party preference.16
6.2. Operationalizing the Social Cleavages
In order to test the claim that these social cleavages affected voting behavior, the factor score for each of the six factors (by province for the pre- and post-1980 periods) was regressed against the three social cleavages operationalized in the following manner.
First, Sunni religiosity was measured by the percentage of imam-hatip lisesi (clergy high school) junior students to total junior high school students in the province calculated from National Education Statistics: Formal Education, 1992–1993 (SIS 1995). This indicator was chosen because imam-hatip lisesis are recognized by soci-ety as an institutionalization of Sunni religiosity and thus reflect societal support for religious values. Institutionalized Sunni religiosity is relatively strong in Central and North Anatolia, as shown by Figure 6-4.
The prototypical imam-hatip lisesi was established in 1924, originally to produce prayer leaders and preachers. In the 1960s, however, the number of imam-hatip lisesis and their students began to increase (Figure 6-5). The schools came to admit even girls, although they could not become prayer leaders or preachers. The schools thus essentially became general, rather than professional, high schools that taught both general and religious subjects. In 1975, the Ministry of Education began to allow
imam-hatip lisesi graduates to apply to the theology faculties of universities. Further,
in 1983 the military government amended the National Education Basic Law to enable the graduates to apply to any university faculty.
For these reasons, pious Sunni parents began to send their children to imam-hatip
lisesi to allow them to learn both modern science and religious knowledge. By the
1990s, the number of their students reached one-tenth of all high school students (Figure 6-6). Only one-tenth of the graduates become clergy members (Duman 1997,
−2 −1 0 1 2
Fig. 6-3c. Factor 3: Alevi, Post-1980
1.1–4.0 4.4–7.4 7.5–10.3 10.3–12.0 12.5–19.0
Fig. 6-4. Ratio of I.mam-Hatip Lisesi Junior Students to Total Junior High School Students by Province, 1992–93
Source: Compiled by the author from Appendix V.
pp. 150–80; Balo%glu 1990, pp. 132–39; Mert and Bahçacı 1995).17
It is true that statistics on imam-hatip lisesi, Koran course18 students, or religious associations capture only the formal aspect of religiosity in Turkey (Yücekök 1971; Mardin 1989). The informal aspects of religiosity such as tarikat (Sufi) membership, however, substantially overlap with Kurdish ethnicity (S¸eker n.d.). When a
hierarchi-Fig. 6-5. Number of I.mam-Hatip Lisesis and Students
Source: Hazama (2006, Fig. 9-3). Originally compiled by the author from SIS, Statistical Yearbook, various years.
0 200 400 600 800 1,000 1,200 1923 Schools 0 100,000 200,000 300,000 400,000 500,000 600,000 Students Schools Students ’27 ’52 ’56 ’60 ’64 ’68 ’72 ’76 ’80 ’84 ’88 ’92 ’96
cal linear model was run with S¸eker’s data (N= 10,662)19 on tarikat membership (by region) and Kurdish ethnicity (by province) as independent variables, the tarikat membership variable became an insignificant predictor of any inter-bloc volatility. It is thus more reasonable to explicitly treat formal religiosity as one of the three independent variables and then let the next variable, Kurdish ethnicity, implicitly reflect informal religiosity.
Second, Kurdish ethnicity was measured by the logged percentage of the Kurdish population to the total population of provinces as of 1965 and 1990. Mutlu (1996) extrapolated the latter data from the former and from inter-provincial migration flows published by the State Institute of Statistics. (Since 1965, there have been no official statistics on the mother tongues of the Turkish citizens.) A logarithmic transformation was performed on Mutlu’s data to reduce the positive skew of the sample (Newton and Rudestam 1999, pp. 173–77). This step helps to bring possible heteroscedasticity under control. The 1965 statistic was used for the analysis of the pre-1980 period, and the 1990 statistic for that of the post-1980 period. For the analysis of the entire period, the mean of the two statistics was used. Figure 6-7 shows the provincial distribution of the estimated Kurdish population percentage as of 1990.
Third, Alevi sectarianism was measured by the log-transformed number of Alevi villages from the mid-1960s to the 1970s.20 The author calculated the number of Alevi villages from various tables compiled by Andrews (1989). The major source of these tables is the Village Inventory Survey published in 1965 by the Ministry of Village Affairs. Since then, data related to the dominant ethnicity of villages have not been published. (Other sources are various village surveys by individual researchers). The
0 2 4 6 8 10 12 1957 ’61 ’65 ’69 ’73 ’77 ’81 ’85 ’89 ’93
Fig. 6-6. Percentage of I.mam-Hatip Lisesi Graduates to Total High School Graduates, 1957–96
Source: Hazama (2006, Fig. 9-5). Originally compiled by the author from SIS, National Education Statistics (Ankara: SIS, various years).
Note: Percentage of I.mam-hatip lisesi junior students to total junior high school students in Turkey.
provincial distribution of the number of Alevi villages is shown by Figure 6-8. In 21 provinces, no Alevi villages were recorded. In most of these cases, such as Bolu, Bursa, Giresun, Gümüs¸hane, Hakkari, Kastamonu, Kocaeli, Rize, Sakarya, and Sinop, it appeared that there were really no or very few Alevi villages. In the other few cases, the Village Inventory Survey did not use the same sectarian category as for other provinces. In these cases, the Survey identified all the villages as Muslim villages. The lack of mention of Alevi villages in Çankırı and Mus¸, where a tangible
−3.9–−1.4 −1.3–0.5 0.6–1.4 1.4–3.0 3.0–4.5
Fig. 6-7. Logged Kurdish Population Percentage by Province, 1965/1990 Mean
Source: Compiled by the author from Mutlu (1996).
0.9–0.9 1.3–1.8 1.9–2.4 2.5–3.1 3.3–4.4
Fig. 6-8. Concentration of Alevi Villages by Province, the Mid-1960s to the 1970s
Source: Compiled by the author from Appendix V.
Note: Index of the concentration of Alevi villages was calculated as ln (n+ 1), where n is the number of Alevi villages in the province.
proportion of the population is considered to consist of Alevis, makes one wonder whether the authorities concerned avoided supplying this information due to the sensitivity of sectarian divisions in the province.21
In the current study, the lack of reporting was recorded as a zero value for the following reasons. For the Alevi village data, the intentional suppression of Alevi identity of any village seemed relatively rare, probably about five provinces, or less than 10 percent of the sample. A deletion of the provinces for which no Alevi villages were recorded thus would lead to a serious loss of information and, more specifically, to an overestimation of the number of Alevi villages.
The demographic data described above indicated that the three social groups were the major determinants of social cleavages in Turkey. Table 6-4 shows that religiosity, ethnicity, and sectarianism were varyingly correlated with factors for pre- and post-1980 voting patterns. The demographic data also show that the relative distribution of social cleavages across provinces did not fundamentally change over time. It appears that the relative distribution of the logged Kurdish population by province, for in-stance, remained highly stable from 1965 to 1990 (r= 0.8591; p < 0.0001). Social cleavage data for the 1960s, such as Alevi village data, thus would not appreciably bias the interprovincial analysis of electoral volatility in the 1990s. Similarly,
previ-TABLE 6-4
FACTOR STRUCTURES AND CLEAVAGES, 1961–99 (N= 67) Independent Variablesa: Cleavages Regression Results Religiosity Ethnicity Sectarianism Adj. R2 F Value Pre-1980 Center-periphery −0.065 −0.820*** 0.178** 0.626 37.777*** 0.363 Left-right −0.283** −0.252** 0.354*** 0.211 6.890*** 0.146 Anti-systemicc 0.365*** 0.110 0.345*** 0.150 4.878*** 0.208 Post-1980 Secular-religious −0.467*** −0.639*** −0.006 0.323 11.493*** 0.740 Turkish-Kurdish 0.262** −0.475*** 0.286*** 0.381 14.537*** 0.359 Alevia −0.216** 0.052 0.571*** 0.428 17.440*** 0.356
Source: Calculated by the author from Appendix V and the same data sources as in Table 6-2 and Table 6-3. The author calculated factor scores for the pre-1980 factors, which were not reported by Ergüder and Hofferbert (1988).
Notes: Entries are standardized multiple regression coefficients. The regressions were run with each of the six factors as the dependent variable and the three social cleavages as independent variables. The regression model is as follows:
Fn= a + b1REL+ b2ETH+ b3SEC+ e,
where Fn is the nth of the six factors extracted for the pre- and post-1980 periods, REL is Sunni
religiosity, ETH is Kurdish ethnicity, SEC is Alevi sectarianism, a is the estimated intercept, b1, b2, b3 are estimated partial slopes, and e is the error term.
aMulticollinearity was not detected for any of the independent variables. The largest value of the variance inflation factor (VIF) was 1.306. Multicollinearity is suspected if VIF exceeds 10. bThe White test (of first and second moment specifications) rejected the null hypothesis (the
pres-ence of heteroscedasticity) for both regressions. cOne-tailed. ** p< 0.05; *** p< 0.01. Dependent Variable: Factor White Testb: p<χ2
ous studies treated social cleavages as a relatively long-term variable (with changes usually measured at intervals of one decade [Franklin et al. 1992] or more [Bartolini and Mair 1990]).
6.3. Cleavages and Long-Term Volatility
Do social cleavages play an anchoring role in electoral behavior in Turkey? Multiple regressions were run between the three social cleavages (IVs) and each cleavage-type volatility (DV) that had been standardized22 and averaged out for the 1965–2002 period. The results, shown in Table 6-5, reveal that: (1) Sunni religiosity significantly raised systemic volatility while understandably having a stabilizing effect on the left-right dimension, (2) Kurdish ethnicity raised both left-left-right and systemic volatility but particularly the latter, and (3) Alevi sectarianism significantly reduced left-right volatility.
These results seem to correspond to the general picture of Turkish politics for the last four decades. The effect of each cleavage on cleavage type can be explained by the following evidence. First, the moderately negative effect of Sunni religiosity on left-right volatility indicates that devout Sunnis tend to support parties on the right. More importantly, the strong positive effect of Sunni religiosity on systemic volatility suggests that devout Sunni voters tend to shift their support from center-right parties to far-right (pro-Islamic or nationalistic) parties and vice versa. In Turkey, most of the vote swings on the systemic dimension have been triggered by the emergence or
TABLE 6-5
SOCIAL CLEAVAGES AND CLEAVAGE-TYPE VOLATILITIES, 1965–2002 (N= 67) DV: Cleavage-Type Volatilitya
VIFb
Left-Right Systemic
IVs: Social cleavagesc
Sunni religiosity −0.242* 0.363*** 1.275 Kurdish ethnicity 0.227* 0.444*** 1.239 Alevi sectarianism −0.429*** −0.030 1.064 Adjusted R2 0.226 0.152 F value 7.42*** 4.94*** White testd: p<χ2 0.476 0.886
Source: Calculated by the author from data shown in Table 6-4.
Notes: 1. Two multiple regressions were run. Entries are standardized multiple regression coefficients.
2. DV= dependent variable, IV = independent variable. aThe period mean of standardized volatility.
bMulticollinearity is suspected if the variance inflation factor (VIF) exceeds 10.
cOne pole of the social cleavage dimension. For instance, Sunni religiosity forms one end of the “devout Sunnis vs. others” cleavage dimension.
dThe White test (of first and second moment specification) rejected the null hypothesis (the pres-ence of heteroscedasticity) for both regressions.
decline of far-right parties such as the National Order Party (Milli Nizam Partisi, MNP)––succeeded by the National Salvation Party (Milli Selamet Partisi, MSP)––, and the Republican Peasant’s Nation Party (Cumhuriyetçi Köylü Millet Partisi, CKMP)––succeeded by the MHP––, during the pre-1980 period; and of the Welfare Party (Refah Partisi, RP)––succeeded first by the Virtue Party (Fazilet Partisi, FP) then by the AKP and the Felicity Party (Saadet Partisi, SP)––, and the Nationalist Work Party (Milliyetçi Çalıs¸ma Partisi, MÇP)––succeeded by the MHP––, during the post-1980 period.
In order to test the above interpretation that systemic volatility was triggered mainly by the rise and decline of far-right parties, let us define: (1) far-right volatility as the inter-bloc volatility between the far-right parties and the other parties and (2) far-left volatility as the inter-bloc volatility between the far-left parties and the other parties. Mean far-right/far-left volatility for the 1965–2002 period is used here as a variable to be correlated with the Sunni-religiosity variable. The partial correlation analysis, applied to the above data after controlling for Kurdish ethnicity and Alevi sectarianism, shows that Sunni religiosity is positively correlated with (period-mean) far-right volatility (r= 0.284, p < 0.05) but not with (period-mean) far-left volatility. In other words, the stronger the Sunni religiosity in the province, the more likely it is for religious or nationalistic parties to trigger systemic volatility.
Second, with regard to Kurdish ethnicity, until 1990 there was no pro-Kurdish party that appealed to Kurdish ethnic identity. In the 1960s, the short-lived New Turkey Party (Yeni Türkiye Partisi, YTP) mobilized votes in the Kurd-populated region because its members were largely local landlords. The TI.P explicitly addressed the Kurdish problem at its 1970 party convention but, following the 1971 military inter-vention by memorandum, it was disbanded and pro-Kurdish activities were severely punished (Güney 2002, p. 122).
Until 1990, this lack of structural bondage to any political party, together with the significant bloc votes that Kurdish clans were able to mobilize, gave rise to large vote swings along both left-right and systemic dimensions. It has been claimed that Kurdish clans change support from one party to another depending on their own political and economic interests. Bruinessen (1992), using examples from Hakkari Province and S¸ırnak Municipality, showed how clan rivalries affected voting practice in the Kurdish region. One alliance of clans would vote for one of two rival parties, while the other alliance would vote for the other party.23 Clan leaders were sometimes elected as independents during the pre-1980 period (Özbudun 1976), when the electoral law gave independents a better chance than during the post-1980 period.
Indeed, a cursory review of the pre-1980 electoral results indicates that there were considerable vote swings from one election to the next. There were more changes in the first party in the Kurd-populated provinces24 than elsewhere (Table 6-6). The results of the Wilcoxon test show that the median number of defeats of the first party during the pre-1980 period is higher in the Kurd-populated provinces than in the other provinces (Z= 2.8192, p < 0.0048). This result does not necessarily contradict the assumption that the smaller number of seats in the Kurd-populated (and sparsely populated) provinces25 than in other provinces should give the incumbent representa-tives a greater advantage over their challengers.
TABLE 6-7
DEFEATS OF THE FIRST PARTY IN THE PROVINCE, 1991–2002 (N= 67) Number of Defeats
0 1 2 3 4 Median
> 40 13 1 3 4 4 1 2
≤ 40 54 0 5 6 30 13 3
Total 67 1 8 10 34 14 3
Source: Calculated and compiled by the author from SIS (1998b, 2000, 2003) and Mutlu (1996). Notes: Z= −2.7344; p < 0.0063 (Wilcoxon test for the difference between two medians). Population
Kurdish (%) N
. . . . TABLE 6-6
DEFEATS OF THE FIRST PARTY IN THE PROVINCE, 1965–77 (N= 67) Number of Defeats
0 1 2 3 4 Median
> 40 13 0 4 4 2 3 2
≤ 40 54 14 18 18 4 0 1
Total 67 14 22 22 6 3 1
Source: Calculated by the author from SIS (1998a) and Mutlu (1996).
Note: Z= 2.8192; p < 0.0048 (Wilcoxon test for the difference between two medians). Population
Kurdish (%) N
. . . .
Rather, more frequent changes in the first party despite the greater incumbent advantage in the Kurd-populated provinces than elsewhere suggest that the incum-bents, or the local powers behind the incumincum-bents, changed their support from one party to the next.26 With regard to ideological fluidity in the Kurd-populated region, changes in the first party in the Kurd-populated provinces reflected disarrays of parties, from left to right and from large to small. In particular, the first party of the province seldom coincided with the first party of the nation. In the other provinces, the patterns for the first party were more consistent. Their first parties either defied contenders or came and went in line with national electoral swings.
During the post-1980 period, however, vote swings in the Kurd-populated region declined significantly (Table 6-7). The results of the Wilcoxon test show that the number of defeats of the first party at the provincial level is even smaller in the Kurd-populated region than elsewhere (Z= −2.7344, p < 0.0063). The pre-1980 tendency was thus reversed, mainly due to the growing strength of pro-Kurdish HADEP/ Democratic People’s Party (Demokratik Halk Partisi, DEHAP), which garnered con-sistent popular support since 1995, as will be discussed in the next section.
Third, the negative effect of Alevi sectarianism on left-right volatility indicates the existence of consistent Alevi support for secularist parties that are characterized as left. The Alevis have historically supported secular political parties as a protection against oppression by the Sunni majority. These secular parties consisted of the CHP (center-left), TI.P (left), and Turkish Union Party (Türkiye Birlik Partisi, TBP;
far-left and pro-Alevi) during the pre-1980 period, and the SHP/CHP (center-far-left) during the post-1980 period (Rustow 1991, p. 16; Schüler 1999, 159–71; Bruinessen 1996; Ayata 1997, pp. 65–69). However, the Alevi vs. non-Alevi cleavage has not apprecia-bly affected systemic volatility, since these secular parties included both pro-systemic (center-left) and anti-systemic (far-left) parties, as mentioned above.
6.4. Cleavages and Short-Term Volatility
The preceding long-term analysis showed, first, that left-right volatility was increased by Kurdish ethnicity but decreased by Alevi sectarianism. Second, systemic volatility was increased by both Sunni religiosity and Kurdish ethnicity. Have these relation-ships been stable over the past four decades? Multiple regressions were run for each election between social cleavages and left-right volatility (Figure 6-9) as well as systemic volatility (Figure 6-10). These graphs seem to allow for both general and specific interpretations in terms of temporal changes in the relationship between social cleavages and cleavage-type volatilities.
Generally, the pre-1980 period and the post-1980 period showed similar patterns. The positive (reinforcing) effect of cleavages on volatility was stronger in the second and/or third free election following each military intervention. In the subsequent elections, the effect of cleavages became either more weakly positive or insignificant, or even negative. In other words, as elections were repeated, the party system seemed to become better able to accommodate and represent social cleavages. The most
−5.88 −3.92 −1.96 0 1.96 3.92 5.88
Religiosity Ethnicity Sectarianism ’65
’69 ’73 ’77 ’91
’95 ’99 ’02
Fig. 6-9. Left-Right Volatility and Social Cleavages 1965-2002 (N= 67)
Source: Calculated by the author from the data sources shown in Table 6-4. Note: Entries are t values for multiple regression coefficients;
distinct examples of this were the two most recent elections, in 1999 and 2002. Those last two elections indicated more strongly than before a process of institu-tionalization of the Turkish party system. In both elections, first, left-right volatility was reduced (rather than increased) by Sunni religiosity and Kurdish ethnicity. Sec-ond, systemic volatility was not increased (it was either unaffected or even reduced) by either Sunni religiosity or Kurdish ethnicity. Third, Alevi sectarianism not only retained its stabilizing effect on left-right volatility but also reduced systemic volatil-ity to some extent. The emerging change in the relationships between social cleavages and cleavage-type volatilities that became evident first in 1999 thus implies that the Turkish party system has become more anchored to major social cleavages.
Phenomenally speaking, the early 1990s saw the resurgence of the pro-Islamic party (RP/FP/AKP) and the emergence of the pro-Kurdish party (HEP/Democracy Party (Demokrasi Partisi, DEP)/HADEP/DEHAP).27 In the post-1980 general elec-tions, the pro-Islamic party increased its vote percentage from 7.2 in 1987 to 21.4, 15.4, and 34.3 in 1995, 1999, and 2002.28 The pro-Kurdish party participated in a general election for the first time in 1991 though under the banner of the SHP, but since 1995 it has run independently. From 1995 to 1999 and then 2002, the pro-Kurdish party gradually increased its vote percentage from 4.2 to 4.7 and 6.2.
Since the late 1990s, the pro-Islamic and pro-Kurdish parties have consolidated their electoral support in the provinces where Sunni religiosity and Kurdish ethnicity, respectively, were strong. This electoral alignment took the form of a relative retreat of the pro-Islamic party in the Kurd-populated provinces, with a concomitant concen-tration of its power in Central Anatolia where Sunni religiosity is strong. As shown by
Source: Calculated by the author from data shown in Table 6-4. Note: Entries are t values for multiple regression coefficients; p (t= ± 1.96) = 0.05. −3.92 −1.96 0 1.96 3.92 5.88 ’65 ’69 ’73 ’77 ’91 ’95 ’99 ’02
Religiosity Ethnicity Sectarianism
Table 6-8, since the late 1990s, Sunni religiosity and Kurdish ethnicity have thus each become more strongly associated with support for the Islamic party and the Kurdish party, respectively. The table also suggests that the voting pattern for the pro-Islamic party adequately reflects the pattern for the anti-systemic right parties as a whole. Between the two, there is little difference in the cleavage-party relationship. In the mean time, the center-left party with an Alevi constituency has continued to rely on Alevi votes during the post-1980 period.
6.5. Summary
This chapter has corroborated the national trend, shown in Section 3.2 of Chapter 3, that social cleavages are becoming less responsible for electoral volatility. Three major social cleavages in Turkey on the whole have increased rather than reduced
TABLE 6-8
CORRELATIONS BETWEEN CLEAVAGES AND PARTY VOTES, 1973–2002 (N= 67)
Cleavage Parties
Pre-1980 Post-1980
1973 1977 1987 1991 1995 1999 2002
Religiosity Anti-systemic righta 0.304*** 0.102 0.032 0.269** 0.234* 0.390*** 0.507*** Pro-Islamicb 0.236** −0.053 −0.059 0.269** 0.216* 0.248** 0.494*** Ethnicity Pro-Kurdishc — — — 0.468*** 0.577*** 0.615*** 0.701*** Sectarianism Most seculard 0.472*** 0.450*** 0.503*** 0.295**e 0.616*** 0.669*** 0.378***
Source: Calculated by the author from the data sources shown in Table 6-4.
Notes: Entries are Pearson’s correlation coefficients. Partial correlations that controlled for the effect of the other cleavages on the party vote produced similar results.
aFor 1973 and 1977, the MSP and the MHP; for 1987, the RP and the MÇP; for 1991, the RP; for 1995, the RP and the MHP; for 1999, the FP and the MHP; and for 2002, the AKP, the SP, and the MHP (see Appendix I and Appendix II). These parties appeal to religious voters though the MSP/ RP/FP/AKP and the SP more strongly than the MHP/MÇP/MHP.
bFor 1973 and 1977, the MSP; for 1987, 1991, and 1995, the RP; for 1999, the FP; and for 2002, the AKP and the SP.
cFor 1991, the SHP, which formed an electoral alliance with its splinter party, HEP. For 1995 and 1999, HADEP, which was formed after the successor to HEP was disbanded. For 2002, DEHAP, which was formed in anticipation of the abolition of its successor, HADEP.
dFor 1973 and 1977, the CHP. For 1987 and 1991, the SHP and for 1995, 1999, and 2002, the CHP. It is true that some of the Alevi enclaves in Turkey, mainly those in Central Anatolia, overlap with strongholds of the MÇP/MHP. But the correlation of the Alevi-sectarianism cleavage with the SHP/CHP votes was much stronger than its correlation with the MÇP/MHP votes. The latter relationship became statistically insignificant when the SHP/CHP votes were controlled for. For all the post-1980 elections, DSP vote percentages and Alevi sectarianism were not correlated at a statistically significant level. Votes for the pro-Alevi but minor TBP were also strongly correlated with Alevi sectarianism. However, as the party later reinforced its leftist inclination, the correla-tion weakened from 0.542 in 1969, 0.488 in 1973 to 0.347 in 1977 (Pearson’s correlacorrela-tion coefficients, all statistically significant at the 0.01 level).
eThis temporary weakening in the correlation reflects the electoral alliance between the SHP and pro-Kurdish HEP. The DSP, the other center-left party, probably did not appreciably affect this relationship. While the DSP’s vote percentage rose steadily from 1991 to 1999, the above relation-ship weakened only for 1991.
cleavage-type volatility during the last four decades: (1) Sunni religiosity raised systemic volatility and (2) Kurdish ethnicity raised both left-right and systemic vola-tilities while (3) Alevi sectarianism reduced left-right volatility. These relationships, however, have changed over time. It appears that both during the pre-1980 (1961–77) period and post-1980 (1987–2002) period, repeated elections following each civilian transition mitigated this general tendency by strengthening the ties between political parties and cleavage groups. Although the 1980 military intervention aborted the earlier development of a party-cleavage nexus during the pre-1980 period, the post-1980 period has witnessed a stabilization of the relationship between cleavages and political parties, especially since the late 1990s. In other words, social cleavages and the party system in Turkey seem to be heading for convergence.
In sum, it has been demonstrated here that (1) while the military rule during the 1980–83 period disrupted the process of party-system institutionalization, which had begun in 1961, (2) the consequent process of democratization since 1983 went further than the previous process to consolidate the relationship between social cleavages and political parties. These findings arouse the following questions: (1) why did the relatively short period (1980–83) of suspension of party politics in Turkey seriously damage the embryonic link between political parties and social cleavages that had been formed by the late 1970s? and (2) why did the recent party system in Turkey become better able to represent Sunni religiosity and Kurdish ethnicity than in the past. The next chapter will address these questions.
Notes
1 Sectarianism is used here to refer to affiliation or identification with the sect. It is not intended to convey any derogative meaning associated with the word sectarianism. 2 After the 1960 military intervention, the governing party was disbanded, while the other
parties remained intact. The parliamentary electoral system was changed from a plural-member majoritarian system to proportional representation, and the senate was established. These measures were intended to prevent the tyranny of the majority that had led to the coup. A competitive transition election was held in 1961. After the 1980 military interven-tion, all the political parties were disbanded and all their leaders were banned from politics until 1987. The transition election in 1983 was thus not fully competitive, considering in addition the fact that the military government allowed only three of the newly formed parties to participate.
3 Descriptive or nominalist definitions refer to necessary conditions or conventional dictio-nary definitions, whereas prescriptive or essentialist definitions take a concept as given and focus on functions. See Pennings, Keman, and Kleinnijenhuis (1999, pp. 60–61). 4 See Bartolini and Mair (1990, pp. 226). The other cleavage index used by Bartolini and
Mair (1990) was organizational strength measured by the unionization rate. This index is also both very difficult to obtain at the provincial level and is restricted to the left-right cleavage.
5 Çarko%glu and Avcı (2002) conducted a factor analysis for the 1950–99 period, without distinguishing the pre- and post-1980 periods, and extracted five factors, i.e., (1) center-left
vs. religious right, (2) center vs. periphery, (3) Turkish nationalist vs. Kurdish support, (4) marginalism, and (5) center-right vs. minor personalistic right-wing. Theoretically, this is a more logical approach. The characterization of the different factors, however, seems to have become blurred. This is because the analysis included many parties with different inclinations that emerged and disappeared over the years. The definition of common de-nominators, or factors, thus became broad rather than specific.
6 In order to delineate clear cleavage patterns, the transition elections of 1961 and 1983 were not included, since the voters did not have sufficient knowledge of the new political parties. In addition, in the 1983 election, only three parties were allowed to participate. The results of the 2002 general election were also not included in the analysis, because a great deal of punitive vote swings (see Figure 3-1) significantly blurred the consistent provincial voting pattern up to 1999. As shown by the following analysis, however, the high electoral volatil-ity for 2002 primarily stemmed from retrospective-type rather than cleavage-type volatili-ties. Provincial patterns of party support have not substantially changed along social cleav-age dimensions. In this sense, it is too early to call the 2002 general election a de-alignment/ realignment election rather than an aberration.
7 During the 1983–87 period, the party system was initially a three-party system, since no other parties were allowed to participate in the transition election of 1983. Two of the three parties, however, were taken over by the successor parties to disbanded parties. See Chapter 7. For the 2002 election, the voting results were still far from a dominant two-party system. The 10-percent threshold seriously distorted the allocation of seats.
8 Calculated by the author from Appendix III.
9 The principal factor method assumes that an observation consists of common factors and factors unique to the observation. This method helps to delineate the underlying structure of the variables. The most conventional alternative method, the principal component method, assumes instead that there is no unique factor and primarily aims to reduce many variables into a few subsets of variables. The objective of this analysis is obviously the former. See Spicer (2005, p. 190).
10 Since in this analysis there are generally four party votes (for the four general elections in each period) for a given party, this in practice means four party votes for a given party. 11 For instance, even if Factor 1 has party A’s votes for 1987, 1991, 1995, and 1999, with
factor loadings either greater than 0.5 or smaller than −0.5, the number of parties contained in Factor 1 is counted as one.
12 Ergüder and Hofferbert did not discuss the procedures for their factor analysis.
13 The effect of the other secular grouping, SHP/CHP, on the secular-religious factor are apparently dimmed probably due to the party’s strong loadings with the third, Alevi, factor. 14 Results of a survey conducted in 1999 of 3,054 respondents in 16 provinces showed that support for an Islamic state was 21.2%. Support rates became even lower when concrete questions were asked such as Islamic-law divorce (14.0%), a smaller inheritance share for daughters (13.9%), polygamy (10.7%), and Koranic punishment for adultery (1.4%). See Toprak and Çarko%glu (2000).
15 Bilici (1999, pp. 68–73) categorized them into four groups. Mystic Aleviism emphasizes compassion over piety and accommodates people of different religious origins. The mem-bers of a second group consider themselves as within Islam but bring about a contemporary interpretation to the Koran. They also seek representation in the state organ for religious affairs. A third new group is closer to Shiism and the Twelve Imams, partly under the influence of revolutionary Iran. The fourth group includes Marxist Alevis who also em-braced Kurdish nationalism. The last two groups, however, form a small minority. Bozarslan
(2003, p. 13) also emphasizes that Alevism is a community-based political formation that emerged due to competition with political Islam and Kurdish nationalism.
16 Erder’s survey in 1996 (N= 2,396) indicated that Alevi voters were the strongest supporters of the CHP (34.4%) compared with a total average support of 5.5% for the same party. Kurdish voters distinctly and strongly supported HADEP (17.4%) compared with a total average support of 2.0% for the same party. They also strongly supported the RP (28.8%) but the total average support for the same party was also as high as 22.2%. Devout Muslims predominantly supported the RP. Among the respondents who wanted Islamic law (22.2% of the total respondents), 52.3% supported the RP. See Erder (1996, pp. 117 and 162). 17 With the introduction of eight-year compulsory education in 1997, the junior section of the
imam-hatip lisesi was abolished and it became almost impossible for their graduates to
enter faculties other than theology faculties, due to a 0.3 coefficient applied to scores on examinations outside one’s own specialization. The above data, however, was taken before the education reform.
18 For Koran courses, see Duman (1997, pp. 181–97).
19 Professor Murat S¸eker kindly provided his cross-tabulated data to the author. The date of the research was not specified.
20 In the process of transformation, a numerical value of one was added to the actual number of Alevi villages since a zero cannot be logged. The number of villages was not standard-ized by the total number of villages or the population of the province. Such standardization would overkill the original statistic.
21 There is a solution to missing data problems in general. See King et al. (2001). Such a solution, however, is useful only when there are several variables in the data so that the missing value of any variable can be estimated from other variables that are more or less correlated with it. The problem for this study is that it is not certain whether the data were missing or whether they had a value of zero.
22 Standardization neutralized the variation of national electoral volatility from year to year. The volatility for each year thus had equal weight throughout the period under investiga-tion.
23 Bruinessen (1992). See pp. 75–76 for Hakkari Province and pp. 313–14 for S¸ırnak Munici-pality.
24 Kurd-populated provinces were conventionally defined here as provinces in which the Kurdish population accounted for more than 40 percent of the total provincial population. The Turkish provinces classified by percentage of Kurdish population can be categorized into two groups: those with a population below 30 percent and the other with a population above 40 percent.
25 Under proportional representation in Turkey, the number of seats for each province is basically determined by the population size.
26 In fact, the few cases of infrequent changes in the first party in the Kurd-populated prov-inces are largely due to the reelection of independent candidates, a phenomenon that can seldom be found elsewhere. This fact confirms the advantage of incumbency in the domi-nantly Kurdish provinces.
27 See Section 7.3 of Chapter 7 for these parties.
28 In 1991, three parties made an electoral alliance under the RP. The votes accrued to the original RP can be estimated as approximately 13 percent based on the number of seats distributed to the party after the alliance was dissolved.