Knowledge spillover in Indian automobile
industry : the process and the coverage
著者
Uchikawa Shuji
権利
Copyrights 日本貿易振興機構(ジェトロ)アジア
経済研究所 / Institute of Developing
Economies, Japan External Trade Organization
(IDE-JETRO) http://www.ide.go.jp
journal or
publication title
IDE Discussion Paper
volume
303
year
2011-08-01
INSTITUTE OF DEVELOPING ECONOMIES
IDE Discussion Papers are preliminary materials circulated
to stimulate discussions and critical comments
Keywords: automobile, technology, spillover, small and medium enterprises
JEL classification: L62, O33, O53,
* Director-General, Research Promotion Department, IDE ([email protected])
IDE DISCUSSION PAPER No. 303
Knowledge Spillover in Indian
Automobile Industry
The Process and the Coverage
Shuji UCHIKAWA*
August 2011
Abstract
In India, as the production of passenger cars increased, many local small and medium
enterprises (SMEs) entered the parts and components manufacturing sector. The
sources of knowledge for large enterprises and SMEs are different. Naturally,
spillover effects among large enterprises and between large enterprises and SMEs are
different. This paper focuses on knowledge spillover among large enterprises and
from large enterprises to SMEs. Subcontractor can absorb relation-specific skills
through repeated interaction with parent company. The results of field survey
emphasizes that relation-specific skills are a determinant factor of spillover effects
from assemblers and large auto component manufacturers to SMEs. Econometric
analysis shows that spillover effects among medium and large automobile units and
from medium and large automobile units to small units went beyond boundary of
cluster.
The Institute of Developing Economies (IDE) is a semigovernmental,
nonpartisan, nonprofit research institute, founded in 1958. The Institute
merged with the Japan External Trade Organization (JETRO) on July 1, 1998.
The Institute conducts basic and comprehensive studies on economic and
related affairs in all developing countries and regions, including Asia, the
Middle East, Africa, Latin America, Oceania, and Eastern Europe.
The views expressed in this publication are those of the author(s). Publication does not imply endorsement by the Institute of Developing Economies of any of the views expressed within.
INSTITUTE OF DEVELOPING ECONOMIES (IDE), JETRO 3-2-2, WAKABA,MIHAMA-KU,CHIBA-SHI
CHIBA 261-8545, JAPAN
©2011 by Institute of Developing Economies, JETRO
No part of this publication may be reproduced without the prior permission of the IDE-JETRO.
3
1. Introduction
In India, multi-national enterprises (MNEs) invested in the automobile industry in the 1980s. As the production of passenger cars increased, many local small and medium enterprises (SMEs) entered the parts and components manufacturing sector.1 The annual production of auto components rose from US$3 billion in 1996-97 to US$26 billion in 2010-11 (ACMA 2011).
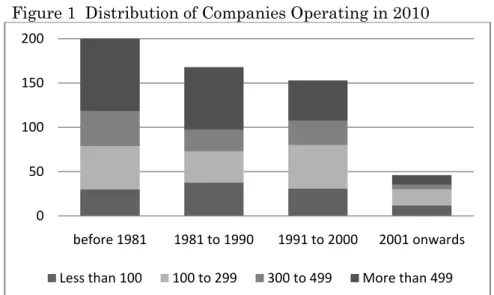
Buyers Guide, published by Automotive Component Manufacturers Association of India (ACMA), is useful for examining the entry of SMEs. Manufacturers of components for two wheelers, four wheelers and tractors are members of ACMA. As membership is not compulsory, the membership does not cover all manufacturers. Although the data are biased, as foreign assemblers look for candidate subcontractors among its members, we can assume that the data reflect trends in tier one and two subcontractors. The 2010 Buyers Guide has data for year of commencing production and number of employees. Both data are available for 567 companies. Figure 1 shows that enterprises commencing production in the 1980s and the 1990s accounted for 56.6 percent of the total number of companies. After most of them started from SMEs at the time of establishment, they have grown. In spite of the rapid growth of SMEs and the increase of auto components production, new entries into the auto component industry clearly declined in the 2000s. Only 46 among 567 (8.1 per cent) started after 2001. This suggests that new small enterprises may face difficulty in competing with existing companies. A company size of more than 99 employees and sufficient capital are required to enter the auto component industry.
Subcontracting has developed as tierisation has progressed. Uchikawa (2011) examined the industrial structure and the relationship between assemblers and auto component manufacturers have changed as the automobile industry has developed. The sources of knowledge for large enterprises and SMEs are different. Naturally, spillover effects among large enterprises and between large enterprises and SMEs are different.
1In accordance with the provision of the Micro, Small & Medium Enterprises Development
(MSMED) Act, 2006, the micro, small and medium manufacturing enterprises are defined in terms of investment in plant and machinery. Investment amounts in micro, small, and medium enterprises are less than Rs 2.5 million, from Rs 2.5 million to Rs 50 million, and from Rs 50 million to Rs 100 million. In this paper, however, since the definition in industrial statistics depends on the number of employees tiny, small, medium, and large enterprises are defined as those employing less than 10 employees, from 10 to 99, from 100 to 299, and more than 299 employees.
4
This paper analyses the process of knowledge spillover among large enterprises and between large enterprises and SMEs. Moreover, we examine spillover effects on large enterprises and SMEs by an econometric method, using unit level data. There many economic literature on spillover effects from MNEs to local enterprises in developing countries (Blalock and Gertler 2008, Kohpaiboon 2009, Kathuria 2002).
In some developing countries, spillover effects from the MNEs could not be observed.
Kohpaiboon (2009) failed to find statistically significant positive effects of spillover through backward linkage in the Thai manufacturing sector between 2001 and 2003. Backward linkage was significant only when the assumption that horizontal spillovers were identical for all industries was introduced. There are two factors to prevent spread of spillover effects in developing countries. First, spillovers effects are limited to a small number of local firms that have the ability to absorb them (Crespo 2007). Kinoshita (2000) emphasized that R&D was the determinant factor for developing the absorptive capacity for spillovers. She analyzed cases in the Czech manufacturing sector between 1995 and 1998 and estimated the effects of the presence of foreign firms in the sector on TFP growth rates. Only when a foreign presence in the sector was interacted with R&D, it have a positive and significant effect. Kathuria (2002) reached a similar conclusion through a study on the Indian manufacturing sector between 1989-90 and 1996-97. He estimated the stochastic production frontier and found statistically significant negative effects of the presence of foreign firms on productive growth, but the interaction term between the effects of a presence in the sector and R&D was positive. Second, a large productivity gap and large foreign market shares together appear to create significant obstacles. Kokko (1994) studied cases in the Mexican manufacturing sector in 1970 and treated the average payments of patent fees per employee as a proxy for the technology level. While the effects on growth rates of labor productivity of a foreign presence in employment were significant in the low patent payment group, they were not so in the high payment group. Indian automobile industry has already overcome the two factors. A few large domestic auto component manufacturers were operating even before 1983. They had their own R&D department and accumulated the minimum ability for technological development.
Section two explains construction of panel data and other variables. Section three describes industrial structure of automobile industry and knowledge source of large enterprises and SMEs. Section four summarizes results of regression and field studies. Section five discusses the reason that spillover effects from large enterprises reached SMEs and spillover effects went beyond boundary of clusters.
5
2. Data
2.1 Source of Panel Data
The automobile industry has developed in three clusters: Delhi (Delhi, Gurgaon District, Faridabad District, Gautam Budh Nagar District), Pune (Mumbai, Pune District), and Chennai (Chennai, Tiruvallur District and Kanchipuram District). All three clusters have assemblers and tier one and two suppliers. Delhi has developed rapidly since Murti was established. Pune and Chennai are traditional clusters. Tata Motors and Bajaj Auto are located in Pune. Ashok Leyland and the TVS group are located in Chennai. This paper focuses on the three clusters.
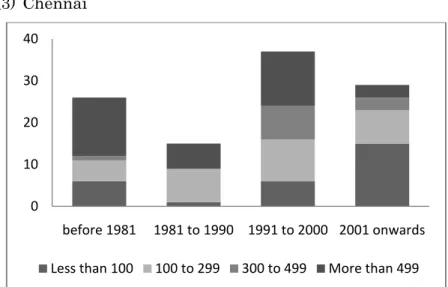
The size criteria are predetermined in the Annual Survey of Industries (ASI), which has two schemes: a census and sample sectors. Units employing 100 or more workers and all factories covered under joint returns2 belong to the census sector and are surveyed every year. Units employing less than 100 workers belong to the sample sector and are surveyed by sampling. Figure 2 shows that number of the census sector units increased in the automobile industry (National Industrial Classification, Division 34: motor vehicles, trailers and semi-trailers) in the three clusters during the 2000s. They include both assemblers and auto component manufacturers. Two common phenomena can be observed among three clusters. First, small and medium units accounted for more than 60 per cent of newly established units during the 2000s. Second, new units were established by existing companies. Unit level data contains information on how many units the company has. If the company does not have any other units, it is a new company. In Delhi, 69 units were established between 2001-02 and 2007-08. Of the 69, only 9 units were set up by new companies. In Pune, only 3 among 49 were established by new companies. In Chennai, only 8 among 29 were established by new companies. Many new units employing less than 300 employees were established by existing companies. In particular, small units were set up not by large enterprises but by SMEs.
This paper adopts the criteria of size in ASI and classifies size of units according to the average number of persons worked. Units whose number of persons worked exceeds 99 are regarded as medium and large units. As many small enterprises do not
2In ASI, the owner of two or more establishments located in the same state and pertaining to the
same industry group and belonging to the same scheme is permitted to furnish a single consolidated return.
6
want to register themselves for tax evasion, ASI data did not capture them. As a result, ASI data capture mainly SMEs engaged in supply chain of automobile assemblers.
Two kinds of panel data for medium and large automobile units were created. The procedure followed for constructing the balanced panel data is described below. Only units whose data is available continuously from 2004-05 to 2007-08 were selected from the census sector in the automobile industry (Division 34). Spillover through relation-specific skills takes time. A balanced panel of 159 samples over four years was created. Auto component manufacturers classified in other industries are, however, excluded from the panel data. Details of the method employed for the measurement of output, inputs and capital stock are given in Appendix. The production function is estimated by the Levinsohn and Petrin method, using the balanced panel (Petrin, Poi and Levinsohn 2004). Fuel is used as a proxy for the productivity shock.
Y=0.3968L+0.7426K (1)
An unbalanced panel data was also constructed. All units whose data is available in any year between 2004-05 and 2007-08 were selected from the census sector. The data has a merit to capture effects of entry and exit. 200, 227, 251, and 280 samples are available in 2004-05, 2005-06, 2006-07 and 2007-08 respectively. The production function is estimated by the same method with the balanced panel.
Y=0.4332L+0.4696K (2)
A pooling data for small automobile units were created. Both the census and sample sectors include data on small automobile units. In the census sector, if the average number of persons worked did not exceed 99 between 2004-05 and 2007-08, the units are included in the pooling data. In the sample sector, if the average number of persons worked did not exceed 99 each year, the units are included in the pooling data. Units located in all three clusters were selected. Finally, 222, 243, 209, and 171 samples are available in 2004-05, 2005-06, 2006-07 and 2007-08 respectively. The production function is estimated by pooled regression.
Y=1.0538L+0.1720K (3)
Total factor productivity growth rates (TFPG) of medium and large units and absolute TFP level of small units in the three clusters are calculated, using the production function.
7
2.2 Data Source of Variables
In addition to TFPG, cluster-wise variable are calculated. They are the labor productivity growth rates of medium and large automobile units outside of the cluster (LPLO), the labor productivity growth rates of small automobile units in the same cluster (LPS), the labor productivity growth rates of small automobile units outside of the cluster (LPSO), the labor productivity growth rates of medium and large units in industries with backward linkage in the same cluster (LPB), the labor productivity growth rates of medium and large units in industries with backward linkage outside of the cluster (LPBO), the labor productivity growth rates of small units in industries with backward linkage (LPBS). The labor productivity of units with backward linkage is calculated by taking a weighted average of labor productivity growth of the 130 sectors. The column of the relevant sector in the input flow matrix in the Input-Output Transactions Table for 2006-07 provides the weights used.
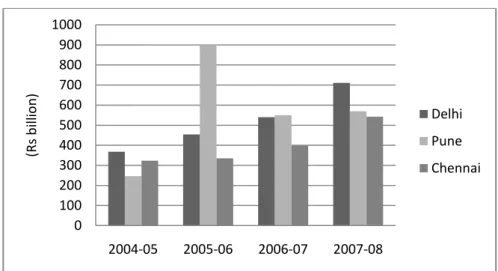
Table 2 expresses average growth rates of variables between 2004-05 and 2007-08. Two phenomena were observed from the table. First, while the labor productivity growth rates of small units and medium and large units in industries with backward linkage improved, the labor productivity growth rates of medium and large automobile units outside of the cluster were negative. Second, TFPG in Pune was better than that in other clusters. Net value added at 2004-05 prices grew constantly in Delhi and Chennai (Figure 3). As capital and average number of persons worked came up rapidly due to expansion of production in the three clusters, TFPG of medium and large automobile units became negative in Delhi and Chennai. Production increase by Tata caused sudden rise of gross value added in Pune.
Specific information on unit is available. They are utilization rates of unit (Utili), the change in directly imported input items of unit (IM), number of average number of persons worked (Size), total number of units the company has (Units) and the year of initial production (IY). The utilization rate is given by actual output as a proportion of the estimated capacity.
Thus, O U = ・100 C C C = (4) (C/O)min
where U is capacity utilization, O is net value added, and C is the estimated capacity. This estimation is crude, but there are no better estimates of capacity utilization (Goldar
8
and Kumari 2003).3Total number of units which the company has indicates number of knowledge source. Each unit has interaction with different customers. It is assumed that if a company has many units, it is easy to correct knowledge from different customers.
3. Framework
In this paper, subcontracting is defined as long-term commitments to supply parts and components or job services with and without documents of agreement. Subcontracting does not necessarily entail a rigid and exclusive contract. Subcontractors can also supply to several customers. Subcontractors must meet the demands of a parent company at three critical points: (1) price reduction by some targeted percentage within a certain time span, reflecting efforts to reduce costs; (2) high reliability in quality assurance; and (3) high reliability in keeping up with the delivery schedule. On the other hand, parent companies support improvements in production efficiency by subcontractors through technical assistance, such as training subcontractors’ employees and dispatching engineers to subcontractors’ factories. Moreover, learning through repeated interactions with a particular parent company results in new skills being developed in addition to the basic technological capability that subcontractors accumulate. Asanuma (1989) referred to this accumulated learning as a relation-specific skill and noted that the effect could be expected from competitive spot bidding if the transaction was repeated for a certain period.
A characteristic of subcontracting in India is that there is no difference in size between tier one suppliers and tier two suppliers. Among 363 tier two companies, 309 were supplying to tier one suppliers as well as to automobile assemblers in 2010 (ACMA 2010). Auto component manufacturers are diversifying their customers. Figure 3 shows the industrial structure of the auto component industry.
Large enterprises and SMEs have different sources of knowledge. Large enterprises have five main sources of knowledge for improving productivity and the quality of products: (1) co-development with assemblers, (2) foreign and technical collaboration, (3) in-house R&D, (4) learning through repeated interactions with a particular parent company and (5) acquisition of foreign companies.
Co-development with MNE assemblers affords suitable opportunities to absorb international standard technology, but these chances are limited to the small number of
3Goldar and Kumari find a strong positive relationship between the rate of change in capacity
9
suppliers who produce critical components. Many large enterprises entered into technical or foreign collaboration in the past or are still maintaining those links today. Technology in the world market is changing very rapidly. Large Indian enterprises do not have sufficient funds to compete with MNEs equally in innovation. Technical and foreign collaboration is an efficient way to introduce advanced technology in a short period. This keeps development costs of new products low by saving time and funds on R&D. In many cases, assemblers introduced counterpart of technical or foreign collaboration in developed countries to subcontractors in India. The technical or foreign collaboration was the condition to become subcontractor. But the relation between assembler and tier one supplier is not always stable. Once the assembler changes strategy, supplier loses the interaction with it.4
On the other hand, SMEs in the auto component industry have five sources of knowledge for improving productivity and the quality of products: (1) relation-specific skills through repeated interactions with a particular parent company, particularly suggestions from customers, (2) R&D, mainly through reverse engineering, (3) training of engineers provided by suppliers of machinery, (4) cluster development programs organized by ACMA, UNIDO and assemblers, and (5) advice from consultants. To investigate the knowledge source in SMEs, a factory survey was conducted in Delhi between April and June 2010. The five sources were pointed out by managers of the 17 sample companies participating in the survey.
Suggestions from assemblers and large auto component manufacturers in tier one are the most important source of knowledge for SMEs. Suggestions can contribute to an increase of value added by shortening the processing time and saving material and fuel costs without large amounts of investment. In the cluster development programs, managers of SMEs visit each others’ factories and give comments on production management and quality control. Some assemblers have similar programs to encourage exchange comments among their tier one and two suppliers.
From the above analysis, we can assume three points. First, vertical spillover effects from assemblers to large auto component manufacturers are effective. Some large enterprises are obtaining knowledge through co-development, foreign and technical collaboration, and repeated interaction. They have sufficient ability to absorb spillover
4An Indian company entered into technical collaboration with a foreign component manufacturer
because the assembler introduced its subcontractor in home country as a collaborator. But the collaborator himself wanted to set up its own factory in India to supply to expanding market. After the collaborator set up factory in India, the parent company gave order of new models to it. The Indian company got only order of old model. The assembler gave a preference to relation in home country. Finally, order to the Indian company shrunk rapidly.
10
effects. Second, spillover effects are more visible within clusters because assemblers and large auto component manufacturers are apt to be select subcontractors in the same cluster due to ease of communication and saving of inventory costs. Third, vertical spillover effects from assemblers and large auto component manufacturers to small auto component units are effective. Some SMEs are getting knowledge through repeated interaction with assemblers and large auto component manufacturers.
It is assumed that TFPG of a unit might have been affected by the productivity of other units through spillover effects. A multiple regression analysis is used to study these effects on TFPG. The regression equation is specified as:
TFPGUit = α+β1TFPGAit+β2LPLOit+β3LPSit+β4LPSOit+β5LPBit+β6LPBOit+β7LPBSit +β8Utiliit+β9IMit +β10Sizeit +β11Unitsit+ε (5) In this equation, TFPGUit denotes the TFPG of a medium and large automobile uniti in yeart, TFPGAit is the average TFPG of other medium and large automobile units in the cluster where uniti is located except uniti in yeart, LPLOit is the labor productivity growth rates of medium and large automobile units outside of the cluster where uniti is located in yeart,LPSit is the labor productivity growth rates of small automobile units in the cluster where uniti is located in yeart, LPSOit is the labor productivity growth rates of small automobile units outside of the cluster where uniti is located in yeart, LPBit is the labor productivity growth rates of medium and large units in industries with which the automobile industry has backward linkage in the cluster where uniti is located in
yeart, LPBO it is the labor productivity growth rates of medium and large units in
industries with which the automobile industry has backward linkage outside of the cluster where uniti is located in yeart,LPBS it is the labor productivity growth rates of small units in industries with which the automobile industry has backward linkage, Utiliit is the change in utilization rates of uniti,IMit is the change in directly imported input items of uniti in yeart,Size is number of average number of persons worked in each year, Units is total number of units the company has.
To investigate spillover effects from medium and large units to small units through repeated interaction, the regression equation is specified as:
TFPSit = α + β1TFPSAit + β2TFPLit + β3LPLOit+β4LPSOit +β5LPBit
+ β6 LPBOit +β7LPBSit + β8IYit +β9Unitsit +β10Sizeit +ε (6) In this equation, TFPSit denotes the absolute level of TFP of a small automobile uniti in yeart, TFPSAit is the average absolute level of TFP of other small automobile units in
11
the cluster where uniti is located except uniti in yeart, TFPLit is the average TFPG of medium and large automobile units in the cluster where small uniti is located in yeart.
In another regression equation, TFPL and LPLO take one year lag because spillover effects from medium and large automobile units take time to affect productivity of small units. The regression equation is specified as:
TFPSit = α + β1TFPSAit + β2TFPLit-1 + β3LPLOit-1+β4LPSOit +β5LPBit + β6 LPBOit +β7LPBSit + β8IYit +β9Unitsit +β10Sizeit +ε (7) Table 3 shows descriptive statistics of dependent and independent variable in the three regression equations.
4. Results
4.1 Results of Regression
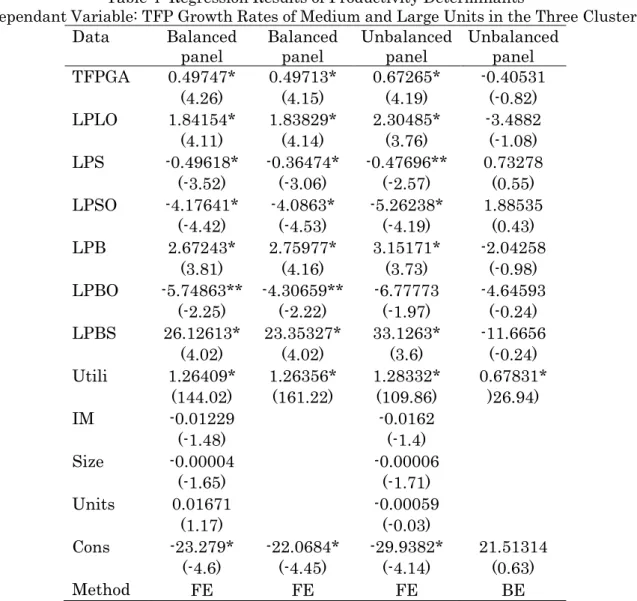
The regression results presented in Table 4 show a significant and positive correlation (1) among medium and large automobile units in the same cluster, (2) between medium and large automobile units in the cluster and medium and large automobile units outside the cluster, and (3) between medium and large automobile units and medium and large units of industries with backward linkage in the same cluster. Spillover effects from medium and large automobile units might reach medium and large automobile in the same cluster and outside the cluster. Only in the same cluster, rise of labor productivity in industries with backward linkage contributes to improvement of TFPG. On the other hand, a negative correlation is observed (1) between medium and large automobile units and small automobile units in the same cluster and (2) between medium and large automobile units and medium and small automobile units outside the cluster. A reason is negative and low TFPG due to expansion of production in Delhi and Chennai.
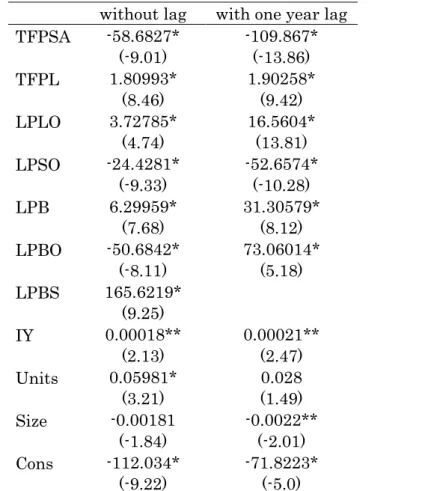
Table 5 shows a significant and positive correlation (1) between small automobile units and medium and large automobile units in the same cluster, (2) between small automobile units and medium and large automobile units outside the cluster, and (3) between small automobile units and medium and large units in industries with backward linkage in the same cluster. It can be concluded that spillover effects from medium and large units reach small units beyond boundary of cluster.
To sum up, (1) spillover effects among medium and large automobile units are effective within the same cluster as well as beyond boundary of cluster, (2) spillover effects from medium and large automobile units to small automobile units are effective
12
not only within the same cluster but also beyond boundary of cluster, and (3) rise of labor productivity in industries with backward linkage contributes to improvement of small automobile units and medium and large automobile units in the same cluster.
4.2 Results of Field Survey
To investigate the sources of knowledge in SMEs, a factory survey was conducted in Delhi between April and June 2010. The target of the survey was companies employing less than 400 employees. Among the 17 companies surveyed, two companies employed more than 300 employees. Three companies were mainly supplying products for foreign replacement markets and 13 were supplying parts and components to assemblers and tier one suppliers. The remaining one company was producing die for assemblers and tier one suppliers. Two companies entered into foreign collaboration.
SME A
The company was established as a SME in 1993 and supplied sheet metal to auto component company in the tier two. Later it got order from a joint venture in tier one in Delhi and accumulated relation-specific skills. It set up the second unit in another cluster to supply parts to new customer (joint venture) in tier one in 2007. The manager of the company pointed out that it received advice from their customers and implemented it. He attended the training program organized by assembler to which new customer is supplying components.
SME B
The company commenced production in 1961. It stated from a tiny enterprise and has grown up to a business group. Flagship company is supplying sheet metal to several assemblers and exporting. It employs 350 workers and has four units in Delhi. As a unit was changing layout of production line at the time of survey, following advice from an engineer of assembler in Delhi. The change of layout needs relatively small amount of investment but shortens the processing time and saves space. As a result, it can improve labor productivity and expand production capacity.
SME C
The company is molding plastic products. In the beginning, it was producing convenience goods. In 1984, it made a sample and brought to Maruti and succeeded in becoming a subcontractor. It become the turning point of the company. Interaction with Maruti gave the opportunity of learning by doing. Later it diversified product range from auto components to
13
electric appliance parts. As production increased, it set up the second unit to increase production capacity. At present it has four units in Delhi.
SME D
The company was founded by a former employee of two wheeler joint venture in 1992. It is manufacturing injections molded components and supplying parts to automobile assemblers in Delhi. Later it diversified business into healthcare product and registered its patent in USA. At present, it is exporting healthcare product to USA. The manager appreciated cluster development program.
The four cases confirm that SMEs have accumulated relation-specific skill by interaction with parent companies in Delhi and improved their technology and management know-how. The experience of subcontractor gave the four SMEs the opportunity to expand their business chance.
5. Discussion
Assemblers and large auto component manufacturers are apt to procure parts and components from suppliers in the same cluster. The results of field survey emphasizes that relation-specific skills are a determinant factor of spillover effects from assemblers and large auto component manufacturers to SMEs. Although it does not increase production dramatically, it helps to reduce defect ratio and save space and processing time. As a result, SMEs can increase value added and profits by saving labor, material and fuel costs without large amount of investment. The result of regression confirms spillover effects from medium and large units to small units in the same cluster.
Econometric analysis shows that spillover effects among medium and large automobile units and from medium and large automobile units to small units went beyond boundary of cluster. The reasons can be explained by concrete examples respectively. Assemblers are procuring critical components from tier one suppliers in the same cluster and outside of cluster. A small number of large enterprises still maintained a majority of the share in critical components. Bharat Forge accounted for more than 60 per cent of crankshafts, Bosch more than 75 per cent of fuel injection equipment, and Federal-Mogul Goetze more than 25 per cent of piston rings between 2003-04 and 2008-09 (CMIE 2010). They have chance of co-development with assemblers in other cluster. Transaction across cluster causes spillover among medium and large automobile units beyond boundary of cluster. Existing SMEs are setting up units in various clusters. The
14
case of SME A is the example. Each unit has interaction with various medium and large automobile units. The SME is correcting knowledge from various customers in clusters and accumulate it in the SME. Establishment of several units by a SME causes spillover from medium and large automobile units to small units beyond boundary of cluster.
Small automobile units as well as medium and large automobile units are procuring material from large enterprises. A SME in the sample of field survey is procuring material from various sizes of enterprises from small enterprise employing 50 workers to large enterprise employing 500 workers. Rise of labor productivity in industries with backward linkage may improve TFP and labor productivity in automobile units.
6. Conclusion
In Indian automobile industry, vertical spillover effects are effective to improve TFP of not only large auto component manufacturers but also SME. Large enterprises are obtaining knowledge from assemblers through co-development and repeated interaction. In some cases, they find out counterpart of technical and foreign collaboration through connection of assemblers. For SMEs, relation-specific skill through repeated interaction is most important to absorb knowledge.
While some SMEs exit from market, some succeeded in becoming subcontractor and developed their business. Entrepreneurship in SMEs is the determinant factor for company growth. There are three kinds of entrepreneur in SMEs in automobile industry. First, former employees of assemblers of two and four wheelers set up their own SMEs. They were working as engineers and have enough knowledge. Two companies among 17 sample companies in the survey were established by former employees of assemblers. Second, the second or third generation of owner families is managing companies. Six companies among 17 sample companies started from tiny enterprises employing less than ten persons. The new generation has a good educational background, engineering knowledge, and sufficient experience. Third, businessmen in other industry entered automobile industry. The companies are employing engineers and managers with experience. In many SMEs, management know-how is transferred among family members.
15
Reference
ACMA (Automotive Component Manufacturers Association of India) 2010. 2010 Buyers’ Guide. Delhi: ACMA.
ACMA. 2011. http://www.acmainfo.com/industry-statistics.htm. (accessed on June 19, 2010)
Asanuma Banri. 1989. “Manufacturer-Supplier Relationships in Japan and the Concept of Relation-Specific Skill.” Journal of the Japanese and International Economics 3, no.1: 1-30.
Blalock, Garrick and Paul. J. Gertler. 2008. “Welfare Gains from Foreign Direct Investment through Technology Transfer to Local Suppliers.” Journal of International Economics 74, no. 2: 402-421.
CSO (Central Statistical Office). 2009. Input-Output Transactions Table 2006-07. Delhi: CSO
CSO. 2011. Nation Accounts Statistics, 2010. Delhi: CSO
http://mospi.nic.in/rept%20_%20pubn/ftest.asp?rept_id=nad01_2010&type=NSSO
Centre for Monitoring Indian Economy (CMIE). 2010. Industry: Market Size & Shares. Mumbai: CMIE.
Crespo, Nuno. 2007. “Determinant Factors of FDI Spillovers: What Do We Really Know?”
World Development 35, no. 3: 410-425.
Goldar, Bishwanath and Anita Kumari. 2003. “Import Liberalization and Productivity Growth in Indian Manufacturing Industries in the 1990s.” The Developing Economies
41, no. 4: 436-60.
Kathuria, Vinish 2002. “Liberalisation, FDI, and Productivity Spillovers: An Analysis of Indian Manufacturing Firms.” Oxford Economic Paper 54, no. 4: 688-718.
Kinoshita, Yuko 2000. “R & D and Technology Spillovers via FDI: Innovation and Absorptive Capacity.” Working Paper no.169. Praha: Center for Economic Research and Graduate Education Economics Institute.
Kohpaiboon, Archnun 2009. “Vertical and Horizontal FDI Technology Spillovers: Evidence from Thai Manufacturing.” Discussion Paper no. 8. Jakarta: Economic Research Institute for ASEAN and East Asia.
Kokko, Ari 1994. “Technology, Market Characteristics, and Spillovers”, Journal of Development Economics, 43 (2): 279-293.
Petrin, Amil, Brian P. Poi and James Levinsohn. 2004. “Production Function Estimation in Stata Using Inputs to Control for Unobservables.” The Stata Journal 4 no.2: 113–123.
Uchikawa, Shuji. 2011. “Small and Medium Enterprises in the Indian Auto-Component
16
Appendix Output
ASI provides the data on products and by-products, other income, indigenous input items, directly imported input items, and fuel costs. The products, by-products and other income are deflated by the whole price index (WPI) of motor vehicles. Indigenous input is deflated by taking a weighted average of price indexes from 130 sectors. The column of the relevant sector in the input flow (absorption) matrix in the Input-Output Transactions Table for 2006-07 provides the weights used (CSO 2009). Directly imported input items are deflated by real effective exchange rate 6 currency index. Fuel costs are deflated by the WPI of fuel and power. Net value added is calculated by reducing the amount of indigenous input items, directly imported input items and fuel costs from the amount of output and other income.
Labor
The average number of persons worked is taken as a measure of labor input. Capital stock
To construct the capital input series in the balanced panel data, gross fixed capital formation, depreciation and capital rent in each year are accumulated on the net value of fixed assets as on the opening day of 2004-05. Capital rent consists of rent paid for plant and machinery and other fixed assets, rent paid for buildings, and rent paid for land on lease or royalties on mines, quarries and similar assets. They are deflated by an implicit deflator on gross fixed capital formation of the registered manufacturing sector in the National Account Statistics (CSO 2011). In the unbalanced panel data for medium and large units and the pooling data for small units, the net value of fixed assets as on the opening day of each year are taken as a measure of capital. They are deflated by an implicit deflator on gross fixed capital formation of the registered manufacturing sector in the National Account Statistics.
17
Figure 1 Distribution of Companies Operating in 2010
Source: Automotive Component Manufacturers Association of India (ACMA): 2010 Buyers’ Guide, Delhi: ACMA.
Figure 2 Distribution of Census Sector Units Operating in 2007 (1) Delhi (2) Pune 0 50 100 150 200 before 1981 1981 to 1990 1991 to 2000 2001 onwards
Less than 100 100 to 299 300 to 499 More than 499
0 20 40 60 80 before 1981 1981 to 1990 1991 to 2000 2001 onwards
Less than 100 100 to 299 300 to 499 More than 499
0 20 40 60
before 1981 1981 to 1990 1991 to 2000 2001 onwards
18
(3) Chennai
Source: CSO. Annual Survey of Industries 2007-08. Unit-level Data. Delhi: CSO.
Table 1 List of Variables and Definition
TFPGU TFPG of a medium and large automobile unit
TFPGA Average TFPG of other medium and large automobile units in the same cluster
TFPS Absolute level of TFP of a small automobile unit
TFPSA Average absolute level of TFP of other small automobile units in the same cluster
TFPL TFPG of medium and large automobile units in the same cluster
LPLO Labor productivity growth rates of medium and large automobile units outside of the cluster
LPS Labor productivity growth rates of small automobile units in the same cluster
LPSO Labor productivity growth rates of small automobile units outside of the cluster
LPB Labor productivity growth rates of medium and large units in industries with backward linkage in the same cluster
LPBO Labor productivity growth rates of medium and large units in industries with backward linkage outside of the cluster
LPBS Labor productivity growth rates of small units in industries with backward linkage
Utili Utilization rates of unit
IM Change in directly imported input items of unit Size Number of average number of persons worked
Units Total number of units the company has
IY The year of initial production
0 10 20 30 40 before 1981 1981 to 1990 1991 to 2000 2001 onwards
19
Table 2 Average Growth Rates of Variable between 2004-2005 and 2007-08 Data Cluster TFPG in cluster LPLO LPS LPSO LPB LPBO LPBS Balanced Panel Delhi -2.8 -3.1 8.0 4.7 1.4 7.0 10.2 Pune 5.3 -3.1 11.7 3.6 5.6 6.9 10.2 Chennai -3.0 -3.7 -3.3 6.5 9.2 6.2 10.2 Unbalanced
Panel Delhi Pune 11.8 3.6 -3.1 -3.1 11.7 8.0 4.7 3.6 1.4 5.6 6.9 7.0 10.2 10.2
Chennai 7.8 -3.7 -3.3 6.5 9.2 6.2 10.2
Small Delhi -4.4 -3.1 1.4 7.0 10.2
Pune 30.2 -3.1 5.6 6.9 10.2
Chennai 5.7 -3.7 9.2 6.2 10.2
Source: Author’s calculation
Figure 3 Net Value Added of the Automobile Industry at 2004-05 Prices
Source: CSO. Annual Survey of Industries. Unit-level Data. Delhi: CSO. Figure 4 Structure of Auto Component Industry
Source: Author 0 100 200 300 400 500 600 700 800 900 1000 2004-05 2005-06 2006-07 2007-08 (Rs b ill ion ) Delhi Pune Chennai
20
Table 3 Descriptive Statistics of Dependent and Independent Variables (1) Balanced panel for medium and large units
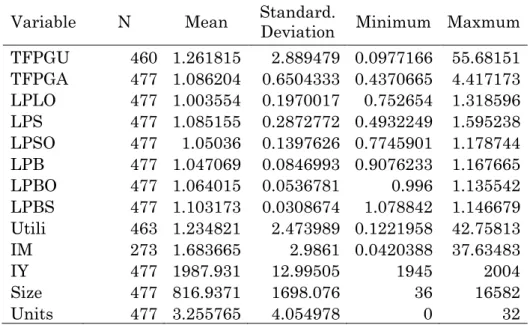
Variable N Mean Standard. Deviation Minimum Maxmum TFPGU 460 1.261815 2.889479 0.0977166 55.68151 TFPGA 477 1.086204 0.6504333 0.4370665 4.417173 LPLO 477 1.003554 0.1970017 0.752654 1.318596 LPS 477 1.085155 0.2872772 0.4932249 1.595238 LPSO 477 1.05036 0.1397626 0.7745901 1.178744 LPB 477 1.047069 0.0846993 0.9076233 1.167665 LPBO 477 1.064015 0.0536781 0.996 1.135542 LPBS 477 1.103173 0.0308674 1.078842 1.146679 Utili 463 1.234821 2.473989 0.1221958 42.75813 IM 273 1.683665 2.9861 0.0420388 37.63483 IY 477 1987.931 12.99505 1945 2004 Size 477 816.9371 1698.076 36 16582 Units 477 3.255765 4.054978 0 32
(2) Unbalanced panel for medium and large units
Variable N Mean Standard. Deviation Minimum Maxmum TFPGU 593 1.347926 2.794044 0.105191 59.6322 TFPGA 593 1.159293 0.604281 0.506769 4.533101 LPLO 593 1.00155 0.1938 0.752654 1.318596 LPS 593 1.08064 0.278786 0.493225 1.595238 LPSO 593 1.04417 0.144394 0.77459 1.178744 LPB 593 1.043466 0.08681 0.907623 1.167665 LPBO 593 1.065453 0.053226 0.996 1.135542 LPBS 593 1.10311 0.030944 1.078842 1.146679 Utili 593 1.453003 3.508477 0.006804 61.61326 IM 333 6.498686 88.97524 0 1624.494 Size 593 734.0641 1541.608 36 16582 Units 591 3.218274 4.208314 0 32
21
(3) Pooling data for small units without lag
Variable N Mean Standard. Deviation Minimum Maxmum TFPS 582 0.190054 0.4806067 0.0039898 8.892447 TFPSA 609 0.063963 0.0172826 0.0419605 0.114167 TFPL 726 1.247777 0.7618265 0.5711251 3.297582 LPLO 726 0.996864 0.1821694 0.752654 1.318596 LPSO 726 1.048949 0.1481968 0.7745901 1.178744 LPB 726 1.047693 0.084597 0.9076233 1.167665 LPBO 726 1.06423 0.0531165 0.996 1.135542 LPBS 726 1.103173 0.0308562 1.078842 1.146679 IY 622 1947.865 285.1373 0 2007 Size 623 34.84751 24.27841 1 98 Units 622 0.863344 1.840405 0 23
(4) Pooling data for small units with lag
Variable N Mean Standard. Deviation Minimum Maxmum TFPS 357 0.202276 0.3826451 0.0099601 5.79616 TFPSA 370 0.068467 0.0190876 0.0419605 0.114167 TFPL* 418 1.335598 0.8694567 0.5711251 3.297582 LPLO* 418 1.005805 0.2260666 0.752654 1.318596 LPSO 418 1.011969 0.1644482 0.7745901 1.178744 LPB 418 1.064527 0.0986257 0.9076233 1.167665 LPBO 418 1.09468 0.0378047 1.047785 1.135542 LPBS 418 1.11276 0.0339593 1.078842 1.146679 IY 379 1937.995 319.7383 0 2007 Size 379 0.849604 1.92342 0 23 Units 380 36.61579 24.72508 1 9
Notes: * TFPL and LPLO take one year lag in Table (4).
22
Table 4 Regression Results of Productivity Determinants
(Dependant Variable: TFP Growth Rates of Medium and Large Units in the Three Clusters)
Data Balanced
panel Balanced panel Unbalanced panel Unbalanced panel TFPGA 0.49747* 0.49713* 0.67265* -0.40531 (4.26) (4.15) (4.19) (-0.82) LPLO 1.84154* 1.83829* 2.30485* -3.4882 (4.11) (4.14) (3.76) (-1.08) LPS -0.49618* -0.36474* -0.47696** 0.73278 (-3.52) (-3.06) (-2.57) (0.55) LPSO -4.17641* -4.0863* -5.26238* 1.88535 (-4.42) (-4.53) (-4.19) (0.43) LPB 2.67243* 2.75977* 3.15171* -2.04258 (3.81) (4.16) (3.73) (-0.98) LPBO -5.74863** -4.30659** -6.77773 -4.64593 (-2.25) (-2.22) (-1.97) (-0.24) LPBS 26.12613* 23.35327* 33.1263* -11.6656 (4.02) (4.02) (3.6) (-0.24) Utili 1.26409* 1.26356* 1.28332* 0.67831* (144.02) (161.22) (109.86) )26.94) IM -0.01229 -0.0162 (-1.48) (-1.4) Size -0.00004 -0.00006 (-1.65) (-1.71) Units 0.01671 -0.00059 (1.17) (-0.03) Cons -23.279* -22.0684* -29.9382* 21.51314 (-4.6) (-4.45) (-4.14) (0.63) Method FE FE FE BE
Note: After F test, Hausman specification test and Breusch and Pagan test were implemented, the estimator was selected.
FE: fixed-effects estimator. BE: between-effects estimator. The t-statistics are in parentheses.
*and **represent statistical significance at the 1% and 5% level, respectively.
23
Table 5 Regression Results of Productivity Determinants
(Dependant Variable: TFP Growth Rates of Small Units in the Three Clusters)
without lag with one year lag TFPSA -58.6827* -109.867* (-9.01) (-13.86) TFPL 1.80993* 1.90258* (8.46) (9.42) LPLO 3.72785* 16.5604* (4.74) (13.81) LPSO -24.4281* -52.6574* (-9.33) (-10.28) LPB 6.29959* 31.30579* (7.68) (8.12) LPBO -50.6842* 73.06014* (-8.11) (5.18) LPBS 165.6219* (9.25) IY 0.00018** 0.00021** (2.13) (2.47) Units 0.05981* 0.028 (3.21) (1.49) Size -0.00181 -0.0022** (-1.84) (-2.01) Cons -112.034* -71.8223* (-9.22) (-5.0) Note: The t-statistics are in parentheses.
*and **represent statistical significance at the 1% and 5% level, respectively.