East Asia's Economic Development cum Trade
"Divergence"
著者
Ishido Hikari
権利
Copyrights 日本貿易振興機構(ジェトロ)アジア
経済研究所 / Institute of Developing
Economies, Japan External Trade Organization
(IDE-JETRO) http://www.ide.go.jp
journal or
publication title
IDE Discussion Paper
volume
11
year
2004-10-01
INSTITUTE OF DEVELOPING ECONOMIES
Discussion Papers are preliminary materials circulated to stimulate discussions and critical comments
Keywords: globalization, dynamic technological change, trade divergence
JEL classification: F15, L23, O31
* The author wishes to thank Ms.Reiko Hirai for her assistance in the data calculation.
†Research Fellow, Development Strategies Studies Group, Development Studies Center,
IDE ([email protected])
DISCUSSION PAPER No. 11
East Asia’s Economic Development
cum Trade “Divergence”
*
Hikari ISHIDO
†October 2004
Abstract
This paper addresses some salient features of how some of “successful” East Asian economies have been faring in terms of enhancing their export competitiveness. That export becomes more divergent in terms of its unit price as more technology-enhancing economic activity is undertaken within an economy, is the primary message that this study conveys. This is indeed what Schumpeter had addressed in conjunction with his “creative destruction” thesis. From this perspective, East Asia’s export-led industrialization has been attained through a particular policy focus upon high “trade divergence” sectors underpinned by a generally high level of manufacturing flexibility. The experience of Malaysia’s development serves as the strong case in point. As an East Asia-wide FTA is expected to facilitate “divergent” export-led industrialization through enhanced knowledge interaction, this dynamic or “divergent” impact that knowledge creation could exert should come to the fore of relevant policy arguments, together with static consideration of trade creation and diversion. A formal statistical test of the “divergence hypothesis” above is called for with a view to building upon this preliminary study.
The Institute of Developing Economies (IDE) is a semigovernmental, nonpartisan, nonprofit research institute, founded in 1958. The Institute
merged with the Japan External Trade Organization (JETRO) on July 1, 1998.
The Institute conducts basic and comprehensive studies on economic and related affairs in all developing countries and regions, including Asia, Middle East, Africa, Latin America, Oceania, and East Europe.
The views expressed in this publication are those of the author(s). Publication does not imply endorsement by the Institute of Developing Economies of any of the views expressed.
INSTITUTE OF DEVELOPING ECONOMIES (IDE), JETRO
3-2-2, WAKABA,MIHAMA-KU,CHIBA-SHI
1. The Role of Knowledge in Industrialization
The critical role of knowledge in development through industrialization is pronounced in recent years (Nelson and Winter 1982; Dosi et al. 1988; Grossman and Helpman 1991). There may be incidences in which a country benefits from having more than one sector with competitive advantages, whereas there may also be cases in which multiple competitive advantages stand to gain by increased exports. The recent trend in “specialization followed by selection” industrialization strategy can be regarded as an attempt to reap economic rents a la Schumpeter (1942; 1961), although it remains to be seen if this move will indeed generate the expected favorable impact on the country’s export performance.
Whether a country can develop economically depends on a number of factors, of which perhaps the most fundamental is the degree of its manufacturing capacity and consequent export competitiveness. This paper addresses some salient features of how some of “successful” East Asian economies have been performing in terms of their export competitiveness. This paper is structured as follows. Section 2 observes statistics pertinent to an economy’s production capacity. Section 3 expounds on export competitiveness measured as “trade divergence”. Section 4 attempts to empirically substantiate the implication of the previous section. Section 5 concludes this paper.
2. Importance of International Trade and Other “Upstream” Measurements
Table 1 gives the magnitude of export relative to total GDP for some selected economies. As shown, ASEAN economies have been increasing their utilization of exporting as a demand component. East Asia’s industrialization can indeed be characterized as export-driven in its salient nature.
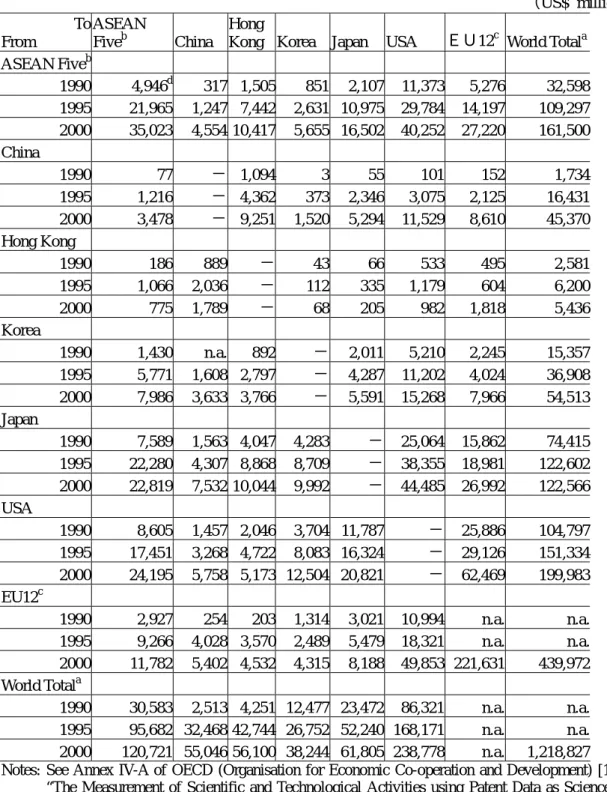
Within the whole spectrum of export commodities, what is so-called “knowledge-intensive products” have been increasing rapidly in ASEAN and China, in particular (Table 2). That the “knowledge” component of those knowledge-intensive products comprises the major source of economic rent is a well-known proposition (Schumpeter, 1942; 1961). It is then imperative for a developing economy to capture ever-progressing industrial technology through streamlining its domestic productive capacity. Since, as is often the case, developing economies lack the very capacity to do so, they oftentimes rely on attracting foreign direct investment (FDI) from developed
economies including the EU, the US and Japan. Indeed, FDI can be viewed as a transfer of money and the channel of acquiring knowledge.
Table 1. Ratio of export to GDP for selected economies, 1990 and 2002
Economy 1990 2002 Indonesia 0.22 0.33 Malaysia 0.67 0.98 Philippines 0.18 0.47 Singapore 1.43 1.44 Thailand 0.27 0.54 Cambodia 0.08 0.37 Laos 0.09 0.18 Vietnam 0.37 0.47 China 0.18 0.26 Korea 0.26 0.34 Japan 0.09 0.10 Hong Kong 1.09 1.25 US 0.07 0.07 France 0.18 0.23 Germany 0.25 0.31 UK 0.19 0.18 Mexico 0.15 0.25 Canada 0.22 0.35
Source: World Bank (2004), World Development Indicators.
As Table 3 suggests, both European and Asian economies have increasingly been dependent on inward FDI as the source of capital stock formation. It is generally observed that smaller economies in terms of GDP, most notably Hong Kong and Singapore in Asia, and Ireland, the Netherlands and Sweden in Europe, record a larger ratio of FDI to capital stock. A major difference between Asia and Europe, may lie in the casual observation (although relevant statistics is lacking) that whereas European economies have been serving as donors and recipients of FDI simultaneously, Asian developing economies have simply been hosting, as entire recipients, those FDI projects undertaken by the region’s developed economies (viz., Japan and Korea) as entire donors.
Table 2. Trade matrix of knowledge-intensive goods (US$ million) To From ASEAN Fiveb China Hong
Kong Korea Japan USA EU12c World Totala ASEAN Fiveb 1990 4,946d 317 1,505 851 2,107 11,373 5,276 32,598 1995 21,965 1,247 7,442 2,631 10,975 29,784 14,197 109,297 2000 35,023 4,554 10,417 5,655 16,502 40,252 27,220 161,500 China 1990 77 − 1,094 3 55 101 152 1,734 1995 1,216 − 4,362 373 2,346 3,075 2,125 16,431 2000 3,478 − 9,251 1,520 5,294 11,529 8,610 45,370 Hong Kong 1990 186 889 − 43 66 533 495 2,581 1995 1,066 2,036 − 112 335 1,179 604 6,200 2000 775 1,789 − 68 205 982 1,818 5,436 Korea 1990 1,430 n.a. 892 − 2,011 5,210 2,245 15,357 1995 5,771 1,608 2,797 − 4,287 11,202 4,024 36,908 2000 7,986 3,633 3,766 − 5,591 15,268 7,966 54,513 Japan 1990 7,589 1,563 4,047 4,283 − 25,064 15,862 74,415 1995 22,280 4,307 8,868 8,709 − 38,355 18,981 122,602 2000 22,819 7,532 10,044 9,992 − 44,485 26,992 122,566 USA 1990 8,605 1,457 2,046 3,704 11,787 − 25,886 104,797 1995 17,451 3,268 4,722 8,083 16,324 − 29,126 151,334 2000 24,195 5,758 5,173 12,504 20,821 − 62,469 199,983 EU12c 1990 2,927 254 203 1,314 3,021 10,994 n.a. n.a. 1995 9,266 4,028 3,570 2,489 5,479 18,321 n.a. n.a. 2000 11,782 5,402 4,532 4,315 8,188 49,853 221,631 439,972 World Totala 1990 30,583 2,513 4,251 12,477 23,472 86,321 n.a. n.a. 1995 95,682 32,468 42,744 26,752 52,240 168,171 n.a. n.a. 2000 120,721 55,046 56,100 38,244 61,805 238,778 n.a. 1,218,827 Notes: See Annex IV-A of OECD (Organisation for Economic Co-operation and Development) [1994]
“The Measurement of Scientific and Technological Activities using Patent Data as Science and Technology Indicators, Patent Manual 1994”, Paris: OECD (http://www.oecd.org/dataoecd/33/62/2095942.pdf, accessed on 28 September 2004) for the trade classification codes of “knowledge-intensive products”.
a
Total of exports by economies listed in PC-TAS.
b
ASEAN Five refers to Indonesia, Malaysia, the Philippines, Singapore and Thailand.
c
EU12 refers to Belgium, Denmark, France, Germany, Greece, Ireland, Italy, Luxembourg, the Netherlands, Portugal, Spain and the United Kingdom.
d
The Philippines’ data is not included.
Table 3. Inward FDI stock as a percentage of gross domestic product, by region and economy, 1980-2002
(Percent) Economy 1980 1985 1990 1995 2003
Japan 0.3 0.3 0.3 0.6 2.1
Asia (excl. Japan) 17.9 20.9 17.9 19.1 30.3 Indonesia 13.2 28.2 34.0 25.0 27.5 Malaysia 20.7 23.3 23.4 32.3 57.2 Philippines 3.9 8.5 7.4 8.2 14.5 Singapore 52.9 73.6 83.1 78.7 161.3 Thailand 3.0 5.1 9.6 10.4 25.8 Cambodia 2.4 2.0 3.4 12.1 46.4 Laos 0.3 - 1.5 11.6 30.1 Myanmar .. .. .. 6.1 .. Vietnam 0.2 1.1 4.0 28.5 50.6 China 3.1 3.4 7.0 19.6 35.6 Hong Kong 623.8 525.5 269.6 163.4 236.5 Taiwan 5.8 4.7 6.1 5.9 11.9 Korea 2.1 2.3 2.1 1.9 7.8 India 0.6 0.5 0.5 1.6 5.4 Bangladesh 0.4 0.5 0.5 0.5 5.0 Sri Lanka 5.7 8.6 8.5 10.0 15.6 Pakistan 2.9 3.5 4.8 9.1 10.7 Nepal 0.1 0.1 0.3 0.9 2.5 Western Europe 6.2 9.3 11.0 13.3 33.0 Austria 4.0 5.6 6.1 7.4 23.7 Belgium and Luxembourg 5.8 21.2 27.8 38.3 Denmark 6.1 6.0 6.9 13.2 36.1 Finland 1.0 2.5 3.8 6.5 28.6 France 3.8 6.9 7.1 12.3 24.7 Germany 3.9 5.1 7.1 7.8 22.6 Greece 9.3 20.2 6.7 9.3 9.8 Ireland 149.9 157.7 71.5 60.2 129.7 Italy 2.0 4.5 5.3 5.8 11.8 Netherlands 10.8 18.8 23.3 28.0 65.6 Portugal 12.3 18.7 14.8 17.1 36.3 Spain 2.3 5.2 12.8 18.7 27.4 Sweden 2.2 4.2 5.3 12.5 47.5 United Kingdom 11.8 14.1 20.6 17.6 37.4 Central and Eastern Europe - 0.2 1.3 5.4 23.7 West Asia .. 0.2 1.3 5.3 9.2 Pacific 22.5 24.8 29.2 27.1 40.6 Africa 8.2 9.9 10.8 15.6 25.3 Latin America, Caribbean 6.5 11.0 10.4 11.8 36.8 North America 4.5 5.5 8.0 8.3 15.4
USA 3.0 4.4 6.9 7.3 14.1
World total 6.7 8.4 9.3 10.3 22.9 Notes: .. Negligible - Not available.
There is another nexus to knowledge-intensive international trade which concerns intellectual property right figures, e.g., patent counts and royalty receipts and payments. In terms of patent counts, as shown in Table 4, most Asian economies listed (with the exception of Japan and Korea to some extent) have smaller patent “markets” than European economies, and they are dominated by non-residential application.
Table 4. Number of patent applications filed by economy, 1990, 1995, 1999 and 2001 Economy 1990 1995 1999 2001 Korea 20,595 96,557 (59,249) 133,127 (56,214) 190,022 (74,001) Taiwan n.a. n.a. 31,115 -China 28,176 41,773 (10,066) 52,348 (146) 149,294 (30,324) Hong Kong 1,093 1,961 (23) 6,040 (42) 8,914 (74) Indonesia n.a. n.a. 42,503
(0) 77,407 (0) Malaysia n.a. 4,052 (141) 6,451 (179) -(-) Philippines 1,256 97 3,361 (144) 13,598 (0) Singapore 880 11,881 (10) 51,495 (374) 79,026 (0) Thailand n.a. n.a. 5,071
(477) 5,665 (1,117) Vietnam 29 16,982 (23) 42,212 (37) 76,542 (0) India 2,129 6,566 (1,545) 38,362 (14) 78,522 (234) Japan 303,960 388,957 (335,061) 442,245 (361,094) 496,621 (388,390) USA 91,245 235,440 (127,476) 294,706 (138313) 375,657 (190,907) United Kingdom 12,699 115,754 (25,355) 192,875 (31,326) 264,706 (34,500) Germany 69,943 136,615 (51,948) 220,761 (74,232) 292,398 (80,222) France 15,430 89,766 (16,140) 138,455 (20,998) 175,122 (21,790) Italy 14,824 64,955 (1,625) 128,260 (9,613) 156,858 (3,819)
Note: Figures in parentheses denote the number of patent applications filed by residents. - not available.
Sources: The European Patent Office database (http://ep.espacenet.com/) for 1990; World Bank (2002) for 1995 and 1999; World Bank (2004) for 2001.
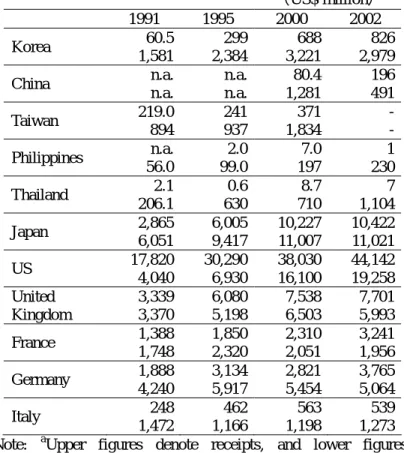
Reflecting the small size of the patent “market” and relatively large demand for production technology, royalty receipts and payments, as in Table 5, register deficit (excess payments) for all the Asian economies listed (including Japan). Put simply, these Asian countries are net recipients of “knowledge”. The US, France and the United Kingdom, in contrast, serve as net donors of the knowledge. This knowledge-creation aspect of economic activity can be viewed as “dynamic” as opposed to “static” within the standard trade analysis framework, yet should actually be among the foremost considerations in addressing economic integration. With this in mind, the next section addresses conceptualization of knowledge-creation, or innovation, in conjunction with international trade analysis.
Table 5. Royalty receipts and payments a
(US$ million) 1991 1995 2000 2002 Korea 60.5 1,581 299 2,384 688 3,221 826 2,979 China n.a. n.a. n.a. n.a. 80.4 1,281 196 491 Taiwan 219.0 894 241 937 371 1,834 - - Philippines n.a. 56.0 2.0 99.0 7.0 197 1 230 Thailand 2.1 206.1 0.6 630 8.7 710 7 1,104 Japan 2,865 6,051 6,005 9,417 10,227 11,007 10,422 11,021 US 17,820 4,040 30,290 6,930 38,030 16,100 44,142 19,258 United Kingdom 3,339 3,370 6,080 5,198 7,538 6,503 7,701 5,993 France 1,388 1,748 1,850 2,320 2,310 2,051 3,241 1,956 Germany 1,888 4,240 3,134 5,917 2,821 5,454 3,765 5,064 Italy 248 1,472 462 1,166 563 1,198 539 1,273 Note: aUpper figures denote receipts, and lower figures, payments.
Source: International Trade and Investment Center (Japan) (2002); World Bank (2004).
3. Export Competitiveness Measured as “Trade Divergence”
During the past couple of decades, with the rapid advancement of technological knowledge, unit prices of “high-tech” products have been rising steadily relative to the unit prices of “low-tech” products. Indeed, processed goods are more expensive than raw materials because the remuneration for human effort and capital used in the production is added to the value of the manufactured products (Nurnberger, 1999). Put differently, processed goods have become more expensive since technology has become more sophisticated and the remuneration for the technology has risen constantly in industrialized economies. With a view to capturing the role of technological knowledge in the economic process, this section first reviews what constitute innovation in the face of economic globalization. Then it attempts to associate the argument with international trade.
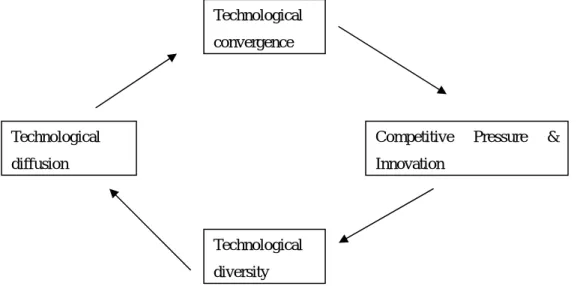
Otani (2003) propounds, within the empirical context of economic globalization and also under the theoretical purview of evolutionary theory (not necessarily confined to evolutionary economics), the concept of “globalization cycle”.
Source: Adapted from Otani (2003), Figure 1. Figure 1. Globalization Cycle
According to Otani, the dynamic aspect of economic globalization can be schematically diagramed as Figure 1:
“In a dynamic real economy, firms engage in continuous struggle to innovate newer goods and newer technologies to gain pronounced competitive advantages. Through the diffusion of
Competitive Pressure & Innovation Technological diffusion Technological convergence Technological diversity
knowledge, these innovations will stimulate other firms to catch up and the competitive advantage of the original innovator will dissipate. […] This dissipation of the older competitive advantages will push firms to further innovations to regain a newer competitive advantage. […] Therefore globalization can be divided up into the process of convergence and that of creative innovations through intensified international competition (Otani, 2003: 126).
Otani’s (2003) dynamic view of globalization is not only in line with Schumpeterian creative destructions but also Aoki and Yorhikawa’s (1999) “growth cum incessant innovation”. An empirical illustration of Figure 2 would be: demand for “tele”-communication (to mean communication “from a distance”) lead an
entrepreneurial firm to create at time t1 the innovation (or invention) of telegraph; as the
demand for telegraph saturates and competitive pressure pushes down the price, the economic rent for manufacturing telegraphs dissipates; then the firm strives for creating
a newer product, culminating at time t2 in the innovation (invention) of radio; then at
time t3, by the same token, the emergence of “tele”-vision follows. The same line of
argument can be made for almost all the other industrial products. The birth of semiconductors, personal computers, cellular phones and internet services are just a a few such examples.
Ceiling of demand Demand
t1 t2 t3
0
Demand for the new product created at time 0
・ ・ ・ ・ ・
Time
Demand for the new product created at time t3
Note: ti refers to the time at which a new product/industry emerged
Source: Adapted from Aoki and Yoshikawa (1999).
In the context of Otani’s globalization view, it seems that in Asia, the innovation has tended to be simply “one-directional”, from the more technologically
advanced part of the world (i.e., Europe and North America) to those Asian economies.1
Since the globalization cycle still remains “severed” or cut off as an “open loop) in Asia at a point between “Technological convergence” and “Competitive Pressure &
Innovation” of Figure 1, and since, importantly, economic process cannot be undone2
(Georgescu-Roegen, 1971; Mayumi, 2001), the Asian region had seen the emergence of a flying geese pattern (a la Akamatsu, 1962) of industrial production and international trade.
Be the case as it may in the argument of technological creation/acquisition, some Asian economies had been successful at least in their export-leveraged development through utilizing those “imported” technologies. In order to consider this issue, the knowledge argument above is translated into the context of international trade below. Given that Hymer’s (1976) and Penrose’s (1980) resource-based view of the firm can be applicable to nation states, those nations’ manufacturing capability as a whole hinges on the extent to which their domestic (to mean “within their territory”) production capacity captures technology ranging from new to old: the more diversified or divergent their domestic technological levels are, the more profit opportunities they could capture. The divergent-ness of domestic technological capability can be reflected in the unit value of export, i.e., a higher (lower) unit value of exports should reveal a higher (lower) technological level embodied in those exported products (Fontagné, Freudenberg and Péridy, 1997; Fukao, Ishido and Ito, 2002). What is important to be borne in mind is that there is no single quality ladder as presented formally in Grossman and Helpman (1991), which nations on the whole climb up: there exist both “low-tech”
and “high-tech” oriented firms within the economy.3
1
While empirical substantiation is awaited, EU-type innovation is “two-directional”, i.e., innovation takes place by turns in major economies including France, Germany and the United Kingdom. A free trade agreement (FTA) is hence expected for the realization of the cross-border “two-directional” exchange of knowledge through an increased level of trade, FDI and workforce.
2
Albeit exogenously, Dixit and Pindyck (1994) observe that physical capital investment, e.g., establishment of factories embodying current (or old) technology, cannot be adjusted “smoothly” (with no energy and/or no cost) to form newer factories embodying newer technology.
3
Kimura (2001) in this connection argues that the strategic fragmentation of firms’ production facilities across economies both developed and developing, make the quality ladder further blurred. In a nutshell, “quality ladder” (pursuit of a higher export unit value) is not congruous with
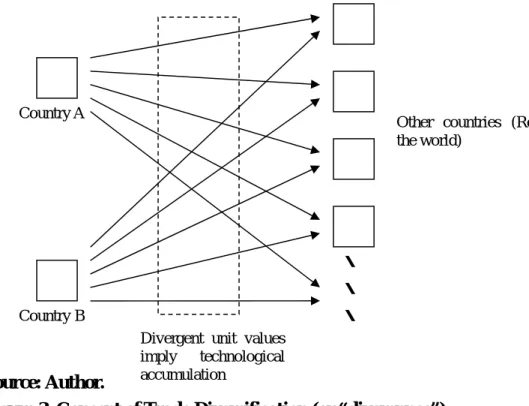
All these considerations lead to on a trade-dimension version of measuring technological divergence as a proposal: an economy’s technological “diversity” or “divergence” in an industry can be reflected in the cross-sectional “variance” of its export unit value (as shown in Figure 3). Put another way, the more divergent the economy’s production possibility is, the “fitter” it is for meeting demand from outside,
as illustrated in Figure 4.4
Source: Author.
Figure 3. Concept of Trade Diversification (or “divergence”)
A further extension of this line of reasoning would be stated in terms of
“Fisher’s Fundamental Theorem of Natural Selection” in evolutionary science5: “the
rate of increase in fitness of any organism at any time is equal to its genetic variance in fitness at that time (Fisher, 1958). Then an economic interpretation of Fisher’s Theorem would be: “the rate of reduction in industry average unit cost is equal to the share-weighted cross-sectional variance of unit cost” (Nelson and Winter, 1982: 243), or in a modified form for This paper focusing on exports, “the rate of increase in the industry’s exports has a positive correlation with the cross-sectional variance of unit
4
In other words, manufacturing flexibility is revealed by the extent of diversity of products (Carlsson, 1989). Country B Country A ・ ・ ・
Other countries (Rest of the world)
Divergent unit values imply technological accumulation
value of exports”. Drawing on this line of argument, the next section attempts a preliminary effort to measure Asian and other economies’ domestic productive capacity.
Source: Author.
Figure 4. An Image of Technological Capability as Flexibility
4. Descriptive Statistics: Coefficient of Variation and Export Volume
As discussed in the previous section, an economy’s domestic productive capacity, or “fitness” to demand (“external environment” in evolutionary science), might be measured by the “variance” (reflecting domestic technological divergence) of
the unit value of the economy’s exports.6 The present section makes a preliminary
analysis of Asian and other economies’ export performance, from the viewpoint introduced above.
A proxy measurement of manufacturing capability cum technological divergence is introduced: coefficient of variation (CV, defined as “standard deviation
divided by mean” in statistics).7 Then a hypothesis can be submitted which states that a
high CV of an economy’s cross-sectional exports (to its trade partner economies in the
6
In methodological terms, firm-level data sets might be desirable, yet those statistics lack unit prices of those manufactured products. As a second-best proxy, therefore, trade statistics is used in this study.
7
As is known, the normalized nature of CVs enables cross-sectional (including cross-industry) comparison. See, e.g., Woodridge (2002) for statistical arguments on this point.
Flexible technological capability accommodates a wide range of external “shocks”, or new demands for product specifications
Inflexible technological capability accommodates only a narrow range of external “shocks”, or new demands for product specifications
rest of the world) suggests high manufacturing (technological) capability of the economy’s industry under consideration. As regards trade data, this study uses the
United Nations’ online trade statistics “TradeMap” and “COMTRADE”.8
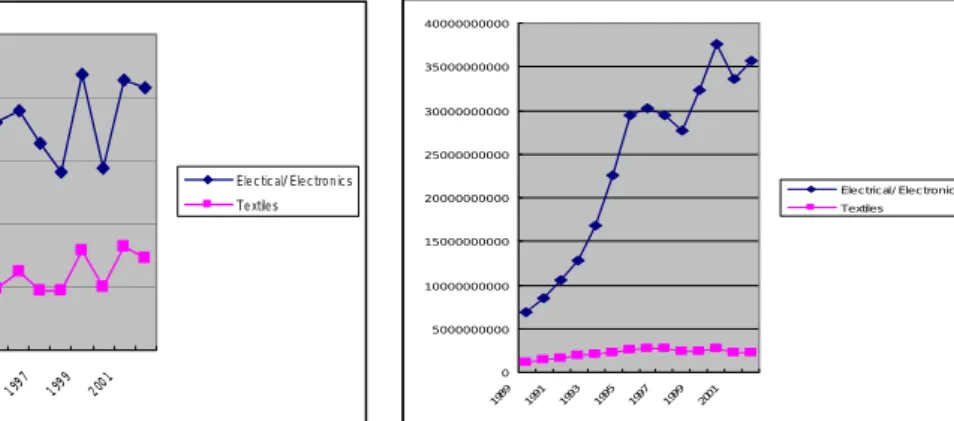
Based on the United Nations’ said trade statistics (“TradeMap” and “COMTRADE”), Coefficient of Variations (CVs) defined above have been calculated by taking the simple average of a cross-sectional set for each year of unit values for the exports (f.o.b. basis) to partner countries at the 6-digit (most detailed) level and aggregating them up to 2 digit (HS85 for “Electrical/electronics products”, HS50-63 for “Textiles”). Export volumes have also been computed in time series.
Results of the calculation are shown in Figures 5 through 23 (unit for the vertical axis: no unit for CVs on the left and US$ thousand for export volumes on the right). A general observation of the results is that the export sector with a higher CV tends to grow faster than the one with a lower CV, which is in line with the Fisher’s Theorem introduced above. For instance, the disparity between trade in textiles and trade in Electronics is wider for Malaysia than for the Philippines. Relatedly, increasing CVs characterize Malaysia’s and China’s electronics exports, in contrast with declining CVs for Cyprus’ electronics and textile exports. Also, there seems to be a robust observation within each economy that electrical/electronics products have a higher CV than textiles. One explanation for this might be the standardized nature (in the sense argued by Vernon, 1966) of textile-related products. Another way of making this point is that technology embodied in the manufacture of textile-related products has already been converged, whereas in the case of electrical/electronics products, relevant technologies are still in the rapid cycle of divergence and convergence.
Further, and most importantly, the disparity in trade volume between electrical/electronics and textiles is larger in some Asian economies such as Singapore and Malaysia than in most European economies. This particular point appears to explain those Asian economies’ rapid or even “miraculous” economic development through recourse to the concept of “technological divergence” at issue in this study. Those Asian economies with a high share in total export of high-CV products (exemplified by electrical and electronic products) have overall raised the unit-price variety of their
export commodities, thus reaping relatively higher value-added alias Schumpeterian rents. 0 0.2 0.4 0.6 0.8 1 1.2 1.4 1.6 1989 1991 1993 1995 1997 1999 2001 Electrical/Electronic s Textiles 0 1000000000 2000000000 3000000000 4000000000 5000000000 6000000000 7000000000 8000000000 9000000000 1989 1991 1993 1995 1997 1999 2001 Electrical/Electronics T extiles
Figure 5-1. CVs for Indonesia Figure 5-2. Export volume for Indonesia
0 0.5 1 1.5 2 2.5 1989 1991 1993 1995 1997 1999 2001
Elec tic al/ Electronics Te xtiles 0 5 0 0 0 0 0 0 0 0 0 1 0 0 0 0 0 0 0 0 0 0 1 5 0 0 0 0 0 0 0 0 0 2 0 0 0 0 0 0 0 0 0 0 2 5 0 0 0 0 0 0 0 0 0 3 0 0 0 0 0 0 0 0 0 0 3 5 0 0 0 0 0 0 0 0 0 4 0 0 0 0 0 0 0 0 0 0 1989 1991 1993 1995 1997 1999 2001
Ele c tric al/ Ele c tro n ic s Te xtile s
Figure 6-1. CVs for Malaysia Figure 6-2. Export volume for Malaysia
Electrical/Electronics 0 0.2 0.4 0.6 0.8 1 1.2 1996 1997 1998 1999 2000 2001 2002 Electrical/Electronics 0 5000000000 10000000000 15000000000 20000000000 25000000000 1996 1997 1998 1999 2000 2001 2002 Electrical/Electronics T extiles
Note: Export data for textiles are missing.
Figure 7-1. CVs for the Philippines Figure 7-2. Export volume for the Philippines
0 1 1 2 2 3 198 9 199 1 199 3 199 5 1997 1999 2001 2003
Ele c tric al/ Ele c tron i c s Te xtile s 0 10000000000 20000000000 30000000000 40000000000 50000000000 60000000000 1990 1993 1996 1999 2002 Electrical/Electronics T extiles
Figure 8-1. CVs for Singapore Figure 8-2. Export volume for Singapore
0 0 .5 1 1 .5 2 2 .5 198 9 199 1 199 3 1995 1997 1999 2001
Ele c tric al/ Ele c tro n ic s Te xtile s 0 2 0 0 0 0 0 0 0 0 0 4 0 0 0 0 0 0 0 0 0 6 0 0 0 0 0 0 0 0 0 8 0 0 0 0 0 0 0 0 0 1 0 0 0 0 0 0 0 0 0 0 1 2 0 0 0 0 0 0 0 0 0 1 4 0 0 0 0 0 0 0 0 0 1 6 0 0 0 0 0 0 0 0 0 1 8 0 0 0 0 0 0 0 0 0 1989 1991 1993 1995 1997 1999 2001
Ele c tric al/ Ele c tro n i c s
Te xtile s
Figure 9-1. CVs for Thailand Figure 9-2. Export volume for Thailand
0 0 .5 1 1 .5 2 2 .5 1988 1990 1993 1995 1997 1999 2001
Ele c tric al/ Ele c tro n ic s Te xtile s 0 2E +10 4E +10 6E +10 8E +10 1E +11 1. 2E +11 1. 4E +11 1988 1990 1993 1995 1997 1999 2001
E lectrica l/E lectronic s
T ex tiles
0 0.5 1 1.5 2 2.5 3 1992 1994 199 6 199 8 2000 2002 Electrical/Electronics T extiles 0 10000000000 20000000000 30000000000 40000000000 50000000000 60000000000 70000000000 80000000000 1992 1993 1994 1995 1996 1997 1998 1999 2000 2001 2002 Electrical/Electronics Textiles
Figure 11-1. CVs for China Figure 11-2. Export volume for China
0 0.2 0.4 0.6 0.8 1 1.2 1.4 1.6 1.8 1988 1990 1992 1994 1996 1998 2000 2002 Electrical/Electr onics Textiles 0 1 E+ 1 0 2 E+ 1 0 3 E+ 1 0 4 E+ 1 0 5 E+ 1 0 6 E+ 1 0 7 E+ 1 0 8 E+ 1 0 9 E+ 1 0 1 E+ 1 1 1988 1990 1992 1994 1996 1998 2000 2002
Ele c tric al/ Ele c tro n ic s
Te xtile s
Figure 12-1. CVs for Korea Figure 12-2. Export volume for Korea
0 0.5 1 1.5 2 2.5 3 3.5 4 1993 1994 1995 1996 1997 1998 1999 2000 2001 2002 Electrical/Electronics T exiles 0 5000000000 10000000000 15000000000 20000000000 25000000000 30000000000 35000000000 40000000000 45000000000 50000000000 1993 1995 1997 1999 2001 Electrical/Electronics T extiles
0 0.2 0.4 0.6 0.8 1 1.2 1.4 1.6 1994 1995 1996 1997 1998 1999 2000 2001 2002 2003 Electrical/Electronics T extiles 0 5000000000 10000000000 15000000000 20000000000 25000000000 30000000000 35000000000 40000000000 45000000000 1994 1996 1998 2000 2002 Electrical/Electronic s T extiles
Figure 14-1. CVs for France Figure 14-2. Export volume for France
0 0.2 0.4 0.6 0.8 1 1.2 1991 1993 1995 1997 1999 2001
Elec tric al/ Elec tronic s Textile s 0 10000000000 20000000000 30000000000 40000000000 50000000000 60000000000 70000000000 80000000000 90000000000 1991 1993 1995 1997 1999 2001 2003 Electrical/Electronics T extiles
Figure 15-1. CVs for Germany Figure 15-2. Export volume for Germany
0 0 .5 1 1 .5 2 2 .5 1994 1995 1996 199 7 1998 1999 2000 200 1 2002 2003
Ele c tric al/Elec tron ic s Te xtile s 0 5000000000 10000000000 15000000000 20000000000 25000000000 30000000000 35000000000 1994 1996 1998 2000 2002 Electrical/Electronics T extiles
0 0.2 0.4 0.6 0.8 1 1.2 1.4 1.6 1.8 2 1994 1995 1996 1997 1998 1999 2000 2001 2002 Electrical/Electroni cs Textiles 0 1000000000 2000000000 3000000000 4000000000 5000000000 6000000000 7000000000 8000000000 9000000000 10000000000 1994 1996 1998 2000 2002 Electrical/Electronics T extiles
Figure 17-1. CVs for Austria Figure 17-2. Export volume for Austria
0 0.2 0.4 0.6 0.8 1 1.2 1.4 1.6 1.8 2 1999 2000 2001 2002 Elect Electrical/Electronics T ext T extiles 0 2 0000 000 00 4 0000 000 00 6 0000 000 00 8 0000 000 00 10 0000 000 00 12 0000 000 00 14 0000 000 00 19 99 200 0 2001 20 02 20 03
Ele ctrical/Elec tronics Textiles
Figure 18-1. CVs for Belgium Figure 18-2. Export volume for Belgium
0 0.5 1 1.5 2 2.5 1993 1994 1995 1996 1997 1998 1999 2000 2001 2002 Electrical/Electroni cs Textiles 0 1 0 0 0 0 0 0 0 0 0 2 0 0 0 0 0 0 0 0 0 3 0 0 0 0 0 0 0 0 0 4 0 0 0 0 0 0 0 0 0 5 0 0 0 0 0 0 0 0 0 6 0 0 0 0 0 0 0 0 0 7 0 0 0 0 0 0 0 0 0 8 0 0 0 0 0 0 0 0 0 1993 1995 1997 1999 2001 2003
Ele c tric al/ Ele c tro n ic s Te xtile s
0 0.2 0.4 0.6 0.8 1 1.2 1989 1991 1993 1995 1997 1999 2001 2003
Ele ctric al/ Elec tro nics Textile s 0 50000000 100000000 150000000 200000000 250000000 300000000 1989 1991 1993 1995 1997 1999 2001 2003 Electrical/Electronics T extiles
Figure 20-1. CVs for Cyprus Figure 20-2. Export volume for Cyprus
Te xtile s 0 0 .2 0 .4 0 .6 0 .8 1 1 .2 1 .4 1 .6 1991 1992 1993 1994 1995 1996 1997 1998 1999 2000 2001 2002 Te xtile s 0 2E+10 4E+10 6E+10 8E+10 1E+11 1.2E+11 1.4E+11 1.6E+11 1991 199 3 1995 199 7 1999 200 1 2003 Electrical/Electronic s T extiles
Note: Export data for Electrical/Electronics are missing.
Figure 21-1. CVs for the US Figure 21-2. Export volume for the US
0 0.2 0.4 0.6 0.8 1 1.2 1.4 1.6 1.8 2 198 9 1991 1993 1995 1997 1999 2001 Electrical/Electronics T extiles 0 5 0 0 0 0 0 0 0 0 0 1 0 0 0 0 0 0 0 0 0 0 1 5 0 0 0 0 0 0 0 0 0 2 0 0 0 0 0 0 0 0 0 0 2 5 0 0 0 0 0 0 0 0 0 1989 1992 1995 1998 2001
Ele c tric al/ Ele c tron i c s
Te xtile s
0 0 .2 0 .4 0 .6 0 .8 1 1 .2 1 .4 1 .6 1 .8 2 1990 1992 199 4 1996 199 8 2000 2002 Electrical/ Electronic s Textiles 0 5000000000 10000000000 15000000000 20000000000 25000000000 30000000000 35000000000 40000000000 45000000000 50000000000 1990 1992 1994 1996 1998 2000 2002 Electrical/Electronics T extiles
Figure 23-1. CVs for Mexico Figure 23-2. Export volume for Mexico
Conventional “trade diversification” arguments have tended to focus on the kinds of products (mostly in the primary sector in Asia’s and Africa’s least developed economies), yet this study’s complementary focus is placed on the “unit-value diversification”. Just as a reference, a measurement of export diversification in its conventional sense, “export diversification index” (EDI), can be defined as: “the number of most detailed trade classification codes in an industry (6 digit HS codes for this study) divided by the total export amount of the industry.
Figures 24-1 and 24-2 denote the EDIs of electrical/electronics and textiles for selected Asian economies, respectively (unit of the vertical axis: number of the 6 digit HS codes per US$ thousand). Figures 25 and 26 depict the same thing with the cases of European and NAFTA economies, respectively (unit of the vertical axis: number of the 6 digit HS codes per US$ thousand). As shown, EDIs for both categories of products have been on a declining trend over time in Asia, as in other economies. What is also noticeable is that the products of these economies with a larger trade share exhibit lower EDIs. Put differently, a more comparatively advantageous products exhibits lower EDIs. Thus, the “export diversification” scenario has not been the governing norm in Asian economies’ rapid industrialization. Instead, extensive, or almost exclusive, utilization of “trade divergence”, or technological deepening through unit price diversification, has been in place in those Asian economies.
0 0.00000005 0.0000001 0.00000015 0.0000002 0.00000025 0.0000003 0.00000035 0.0000004 19 88 19 89 19 90 19 91 19 92 19 93 19 94 19 95 19 96 19 97 19 98 19 99 20 00 20 01 20 02 20 03 Indonesia Malaysia Philippines Singapore Thailand China Korea Hong Kong Japan 0 0.00000005 0.0000001 0.00000015 0.0000002 0.00000025 0.0000003 0.00000035 19 88 19 89 19 90 19 91 19 92 19 93 19 94 19 95 19 96 19 97 19 98 19 99 20 00 20 01 20 02 20 03 Indonesia Malaysia Philippines Singapore Thailand China Korea Hong Kong Japan
Figure 24-1. EDIs of electrical/electronics Figure 24-2. EDIs of textiles
for selected Asian economies for selected Asian econoimes
0 0.0000005 0.000001 0.0000015 0.000002 0.0000025 1988 1989 1990 1991 1992 1993 1994 1995 1996 1997 1998 1999 2000 2001 2002 2003 France Gernany UK Italy Denmark Austria Latvia Estonia 0 0.0000002 0.0000004 0.0000006 0.0000008 0.000001 0.0000012 0.0000014 0.0000016 0.0000018 0.000002 1988198919901991199219931994199519961997199819992000200120022003 France Gernany UK Italy Denmark Austria Latvia Estonia
Figure 25-1. EDIs of electrical/electronics Figure 25-2. EDIs of textiles
for selected European economies for selected European economies
0 0.00000002 0.00000004 0.00000006 0.00000008 0.0000001 0.00000012 0.00000014 0.00000016 0.00000018 1988198919901991199219931994199519961997199819992000200120022003 US Canada Mexico 0 0.0000001 0.0000002 0.0000003 0.0000004 0.0000005 0.0000006 1988198919901991199 2 1993199419951996199719981999200020012002200 3 US Canada Mexico
Figure 26-1. EDIs of electrical/electronics Figure 26-2. EDIs of textiles
for NAFTA economies for NAFTA economies
It might be meritorious to consider an illustrative case example. Malaysia, in its three decades of export-oriented industrialization, has been successfully attracting FDI from developed economies including Japan. Multinational firms have undertaken FDI in Malaysia in the form of investing in automation and flexible production systems
by Malaysians”, the country’s GDP has surely been underpinned by foreign firms. Among industrial sectors, Malaysia has been placing an increasing emphasis upon attracting FDI in the electrical and electronic industry (Table 6). As is known, semiconductor chips exhibit unit price diversity ranging from less than 1 dollar to over
100 dollar per chip.9 Unlike this highly divergent property of the semiconductor
industry, textiles, in contrast, have little scope for unit price divergence.10
Table 6. Share of FDI (production basis) in Malaysia by industry, 1986-1998
(Percent) Industry 1986 1990 1995 1996 1997 1998 Food manufacturing 14.3 11.3 7.5 6.5 5.7 5.1 Beverages & tobacco 8.9 4.2 2.6 2.6 2.8 2.6 Textiles & textile products 10.4 8.7 10.4 9.4 9.3 8.1 Leather & leather products 0.4 0.2 0.2 0.2 0.1 0.2 Wood & wood products 1.7 2.3 3.5 3.5 3.4 3.3 Furniture & fixtures 0.3 0.4 0.6 0.6 0.5 0.5 Paper, printing & publishing 1.4 2.3 0.9 0.9 1.0 1.0 Chemicals & chemical products 11.1 6.8 8.1 9.8 5.8 6.1 Petroleum & coal 8.4 11.2 4.8 4.9 9.1 8.9 Rubber products 3.6 3.8 2.8 2.8 2.7 2.6 Plastic products 0.7 1.4 3.2 2.9 2.7 2.4 Non-metallic mineral products 8.9 8.3 5.7 4.9 4.7 4.8 Basic metal products 6.9 3.8 5.0 4.8 5.8 5.4 Fabricated metal products 4.5 3.8 4.0 3.9 3.8 3.8 Machinery manufacturing 1.9 2.2 4.0 4.3 4.3 5.0 Electrical & electronic products 10.8 23.2 30.4 31.9 32.4 33.7 Transport equipment 4.2 4.0 3.8 3.5 3.3 3.0 Scientific & measuring equipment 0.9 1.0 1.7 1.5 1.7 3.0
Miscellaneous 0.8 1.0 0.9 0.9 0.8 0.6
Total 100.0 100.0 100.0 100.0 100.0 100.0
Note: Data are available only until 1998.
Original source: Malaysian Industrial Development Authority, Statistics on the Manufacturing Sector, various years.
Source: Siew-Yean (2004: 193)
There can be no large price disparity in the case of, say, T-shirts as among textile products. As a matter of fact, expenditure on research and development (R&D)
9
An interview by the author at a Japanese semiconductor firm’s headquarters in Tokyo (6 August, 2004) also corroborate this point. This firm’s Japanese factory produces semiconductor chips whose unit price exceeds 15,000 yen (around 120 dollars), while on the other hand some semiconductor chips manufactured by its factory in China are priced less than 10 yen (around 8 cents).
10
Interviews by the author at Malaysia’s Ministry of International Trade and Industry (25 August, 2004), Thailand’s Department of Foreign Trade (31 August 2004) and Thai Garment Manufacturers Association (31 August 2004) have found that the local textile firms’ current operation in both countries stays manufacturing of low-end products. This exemplifies the fact that within the relatively standardized textile industry, the scope for product differentiation and price elevation in developing economies is even more limited.
for textiles is much smaller than for electrical/electronics in Malaysia (Table 7). That the R&D expenditure on electrical/electronics products have been dominated by foreign investors with a high-level technology, and that in the case of textiles Malaysian firm’s much smaller amount of R&D still “dominates”, can be viewed as both a cause and a consequence of the latter textile industry’s little scope for Schumpeterian innovation. In sum, its strategic policy efforts in favor of capturing a larger share of “high CV” industry’s products in its export has enabled Malaysia to attain the export-driven development cum trade divergence. A formal statistical test of this “divergence hypothesis” is called for with a view to building upon this preliminary and descriptive study.
Table 7. Firms’ R&D Expenditure by Industry and ownership in Malaysia, 2000
(RM million) Industry Foreign- owned or
controlled firms
Malaysian- owned or controlled firms
Total R&D expenditure
Food & beverages 262 5.4 267.3
Textiles 0.3 4.2 4.5
Wearing apparel, dressing & dyeing of fur - 1.1 1.1 Wood, wood & cork products except
furniture, articles of straw, & plaited materials
1.1 0.8 2.0 Paper & paper products 0.1 0 0.1
Publishing, printing, & reproduction of recorded media
- 0.4 0.4
Coke, refined petroleum products, & nuclear fuel
- 0.3 0.3
Chemicals & chemical products 2.5 11.5 13.9 Rubber & plastic products 8.5 5.2 13.7 Non-metallic & mineral products - 9.2 9.2
Basic metals - 0.5 0.5
Fabricated metal products except machinery & equipment
0.4 1.7 2.1 Machinery & equipment 106.4 0.7 107.1
Office, accounting, & computing machinery 7.2 2.8 10.0 Electrical machinery & apparatus 223.4 10.8 234.2 Radio, television, & communication
equipment & apparatus
23.1 8.3 31.4 Medical & precision optical instruments,
watches & clocks
0.9 0.8 1.7 Motor vehicles, trailers, & semi-trailers - 258.2 258.2
Other transport equipment - 5.3 5.3 Furniture, manufacturing not elsewhere
classified
- 2.3 2.3
Total (% of total) 635.9 (64.0) 329.4 (36.0) 991.7 (100.0) Notes: Figures may not add up to total due to rounding.
5. Conclusion
That export becomes more divergent in terms of its unit price the more technology-enhancing economic activity is undertaken within an economy is the primary message this study has to convey. This is indeed what Schumpeter had addressed in conjunction with his “creative destruction” thesis. From this perspective, East Asia’s export-led industrialization has been attained through “trade divergence” underpinned by a generally high level of manufacturing flexibility. This study though obviously remain preliminary in both stage and orientation. A formal statistical test of the claimed hypothesis would be required to this effect.
By way of concluding this paper, it must be stressed that just as an isolated individual could hardly stay alive in the society, isolated nation states, cannot attain higher degrees of prosperity. Cooperation therefore must come in, which depends on two things: First, individuals must be free to develop their particular gifts. This is called specialization. Second, these specialized functions must be integrated optimally in an institutionalized process. As an East Asia-wide FTA is expected to facilitate “divergent” export-led industrialization through enhanced knowledge interaction, this dynamic or “divergent” impact that knowledge creation could exert should come to the fore of relevant policy arguments, together with static consideration of trade creation and diversion. Last but not the least, FTAs in East Asia and elsewhere should not imprison member states’ potentials in predefined roles and statuses, but should instead incubate “community spirit”, with which the humans, not the states, can achieve higher satisfaction levels.
References:
Akamatsu, K. (1962), “A Historical Pattern of Economic Growth in Developing Countries”, The Developing Economies, March-August, pp. 3-25.
Aoki, Masanao and Hiroshi Yoshikawa (1999), “Demand Creation and Economic Growth”, Discussion Paper, CIRJE-F-43, Faculty of Economics, University of Tokyo, March.
Carlsson, Bo (1989), “Flexibility and the Theory of the Firm”, International Journal of Industrial Organization, 7, pp.179-203.
Dixit, A. K. and R. S. Pindyck (1994), Investment under Uncertainty, Princeton, New Jersey: Princeton University Press.
Dosi, Giovanni Christopher Freeman, Richard Nelson, Gerald Silverberg, and Luc Soete (eds.) (1988), Technical Change and Economic Theory, London: Pinter Publishers.
Fisher, R.A. (1958), The General Theory of Natural Selection, New York: Dover (originally published 1929).
Fontagné, Lionel, Michael Freudenberg, and Nicholas Péridy (1997) “Trade Patterns Inside the Single Market,” CEPII Working Paper No. 1997-07, April, Centre D’etudes Prospectives Et D’informations Internationales (http://www.cepii.fr/ang/aisgraph/workpap/summaries/1997/wp97-07.htm).
Fukao, Kyoji, Hikari Ishido and Keiko Ito (2002), “Vertical Intra-Industry Trade and Foreign Direct Investment in East Asia”, Journal of the Japanese and International Economies, 17, pp.468-506, 2003
Georgesçu-Roegen, N. (1971), The Entropy Law and the Economic Process, Cambridge, MA: Harvard University Press.
Grossman, G. M. and E. Helpman (1991), Innovation and Growth: in the Global Economy, Cambridge, MA: The MIT Press.
Hymer, S. H. (1976), The International Operations of National Firms: A Study of Direct Foreign Investment, Cambridge, MA: The MIT Press.
International Trade and Investment Center (Japan) (2002), Sekai-Syuyokoku no Chokusetu Tokei Syu (FDI Statistics in the World’s Major Countries)
Kimura, Fukunari (2001), “Fragmentation, Internalization, and Inter-firm Linkages: Evidence from the Micro Data of Japanese Manufacturing Firms” in Leonard K. Cheng and Henryk Kiezkowski (eds.), Global Production and Trade in East Asia, Norwell: Kluwer Academic Publishers.
MASTIC (Malaysian Science and Technology Center) (2002), National Survey of Research and Development 2000, Kuala Lumpur: MASTIC.
Mayumi, K. (2001), The Origins of Ecological Economics: The Bioeconomics of Georgescu-Roegen, London: Routledge.
Nelson, R. R. and S. G. Winter (1982), An Evolutionary Theory of Economic Change, Cambridge, MA: The Belknap Press of Harvard University Press.
Nurnberger, Klaus (1999), Prosperity, Poverty and Pollution: Managing the Approaching Crisis, London and New York: Zed Books.
Otani, Yoshihiko (2003), “Globalization, Convergence and Diversity: Economic Perspectives”, Ekonomikusu (Economics, Kyushu Sangyo University), vol. 7(4), pp.119-133.
Schumpeter, J. A. (1942), Capitalism, Socialism and Democracy, New York: Harper. Schumpeter, J. A. (1961; original publication 1912), The Theory of Economic
Development: An Inquiry into Profits, Capital, Credit, and the Business Cycle, trans. R. Opie, New York: Oxford University Press [Original publ. In Germany with title: Theorie der Wirtschaftlichen Entwicklung].
Siew-Yean, Tham (2004), “Malaysia” in Douglas H. Brooks and Hal Hill (eds.) (2004), Managing FDI in a Globalizing Economy: Asian Experiences, New York: Palgrave Macmillan.
Vernon, R. (1966), “International Investment and International Trade in the Product Cycle”, Quarterly Journal of Economics, 80, pp. 190-207.
Woodridge, Jeffrey M. (2002), Econometric Analysis of Cross Section and Panel data, Cambridge, Mass: The MIT Press.
World Bank (2002), World Development Indicators. World Bank (2004), World Development Indicators.