Theory of genes network in reprogramming of iPS cells
Kazuhisa NishiSchool of Engineering, University of Hyogo 1. Introduction
Reprogramming of somatic ceıls into iPS cells can be achieved by expression of several transcriptional factors (Takahashi and Yamanaka, 2006; Takahashi et al., 2007; Okita et al., 2007; Wemig et al., 2007; Maherali et al., 2007; Yu et al., 2007). There are some distinct properties in the reprogramming of iPScelıs compared with nuclear transfer or cell fusion in somatic cells (Gurdon et al., 1958; Wilmut et al., 1997; Tada et al., 2001; Cowan et al., 2005). The first is that the specified transgenes (Oct4, Sox2 etc.) are needed in reprogramming, the second is that the endogenous loci of the transgenes should be expressed, and the third is that iPS celı generation requires several cell division. These facts imply that if the genes transcriptional network of somatic cells is activated by the specific factors, they could be finally reprogrammed by changing the total expressing pattem of genome. However, its mechanism still remains unsolved probıem. In this paper I suggest a reprogramming mechanism of iPS ceıls, emphasizing how the dynamics of genes transcriptionaı network can be related with deterministic and stochastic processes.
2. Equations of gene network
The discovery of the iPS ceıls leads to the astonishing facts that tranceducing trigger genes into somatic cells can change the expressing pattems of genome drastically. In order to find the reprogramming mechanism of iPS cels, we wilı have to consider not only the genes network of the specified factors such as Sox2, Oct3 etc but also the total dynamics of genome with interacting between these pluripotency relevant factors. First ıet us consider basic equations used in the genes networks. Figure 1 shows the model of transcription factors network in iPScells which is the positive feedback co‐operated with Oct4, Sox2, and Nanog. Extemally tranceduced Oct4 and Sox2 activate Oct4 and Sox2 enhancer, which expresses endogenous Oct4, Sox2, Nanog and so on. Further, they begin to activate Oct4‐Sox2 enhanceL and a basic network of iPScells is finally stabilized in the expression ofthe endogenous genes, Mathematicaı models of the gene‐network have been almost applied for the system in which
Basic Network
the genes are directly interacting with transcription factors (Elowitz and Leibler, 2000; Gadner et al., 2000). However, since in the eukaryote cells, genes are constituted with the chromatin structures, the control system of the gene transcription is not the same as the case of the prokaryote cells. Nevertheless, it is for simpıicity assumed here that the main frame of the model equations adopted in the prokaryote cells can be also applied for the case of the eukaryote cells. To carry out this treatment efficientıy, the system parameters or coefficients in equations w \cdot
ıl be re‐defined so as to reflect the interaction between the transcriptionaı factors and the chromatin structures. The network starts with a mathematical model of transcriptional regulation, which is represented by Michaelis‐Menten equation that describes the chemical reaction of the feedforward control constituted with Oct4, Sox2 and Nanog. It is considered that Oct4‐Sox2 enhancer is co‐operatively activated by the product of the Oct4 and Sox2 expressing quantity.
Basic equations ofthe system are given by
\frac{dm_{oc(x)}}{dt}=-m_{x(sx)}+\frac{\alpha p_{oc}p_{\alpha}}{{\imath}+p_{oc}p_{x}}, \frac{dp_{oc(\alpha)}}{dt}=-\beta(p_{oc\langle\alpha)}-m_{oc(x))})
(1)
\frac{dm_{ng}}{dt}=-m_{ng}+\frac{ap_{ed}}{1+p_{eA}}, \frac{dp_{ng}}{dt}=-\beta(p_{ng}-m_{ng})
.where the variable p_{oc}, p_{sx},p_{ng}are Nanog, Oct4, Sox2 protein number per cell in units of K_{m}
(the number ofproteins necessary to half‐maximally activate a promoter), respectively, and
m_{oc}, m_{sx}, m_{ng} are the corresponding mRNA respectively. It shows whether the number per cell rescaled by the average expression of Oct4 or Sox2 can be stabilized
number of proteins produced per mRNA in a cell or not is determined by the initial
molecule. The coefficient ctı, \alpha_{2},\alpha_{3} are quantity ofthese proteins.
maximum numbers of proteins per cell of
Nanog, Oct4, Sox2, respectiveıy. The 16
coefficient \beta is the ratio of the protein decay
f^{t5}
rate to the mRNA decay rate. The action of
\backslash \ovalbox{\tt\small REJECT} 4=\Phi
the network depends on several factors, o\ovalbox{\tt\small REJECT} 3 including the dependence of transcription 8^{12} rate on activator or repressor concentration,D\in 10v^{11}
the translation rate, and the decay values of C39 the protein and the messenger RNA. Figure \Phi\subseteq 8 2 shows that Oct4 or Sox2 proteins number \dot{8}7per ceıl in units of K_{m} (the number of
\varepsilon\triangleleft\alpha 6
proteins necessary to half‐maximally\infty ox5
activate a promoter) is represented as a \dot{o}4function of time rescaled in units of the \backslash \vee 3
mRNA decay lifetime. Here, \alphaı +a2, a_{3} are
g\dot{o}2
maximum numbers of proteins per ceıl of ot
Oct4 or Sox2 and Nanog, respectively, and \beta
is the ratio of the protein decay rate to the 0
T2.
\ovalbox{\tt\small REJECT} me[t/1fetime4.6
1 of mRNA]8 10mRNA decay rate. The values of p_{1}, p_{2}, p_{3}
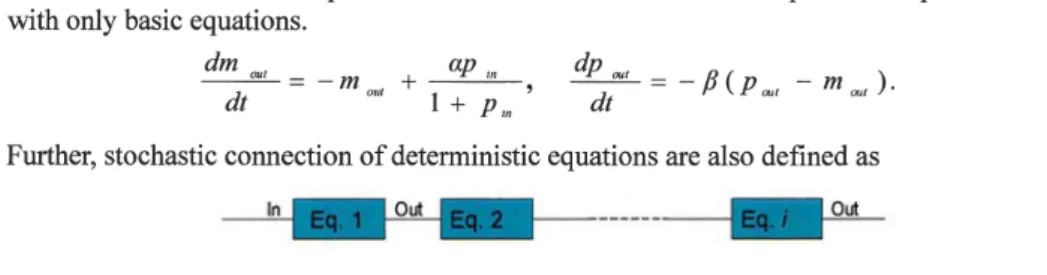
Effective deterministic equations are defmed as the formuıa of input and output constructed with only basic equations.
\frac{dm_{mt}}{dt}=-m_{out}+\frac{\alpha p_{ln}}{1+p_{m}}, \frac{dp_{\alpha t}}{dt}=-\beta(p_{\alpha t}-m_{wt})
. (2)Further, stochastic connection of deterministic equations are also defined as
3. Reprogramming process
Now let us consider the reprogramming process of somatic cells. In order to understand the reprogramming mechanism, the total dynamics of genome has to been revealed. First three groups of cells which are somatic, partially reprogrammed, and iPS cells wiıl be considered
and be factorized into G1\sim G5 groups, shown in the left side of Fig. 3. The right side of Fig. 3
shows the process model indicating how the expression pattems of genome can change from somatic state to reprogrammed state as the result of the interaction between reprogrammed
related genes, master genes of G1\sim G5groups and other genes as environment.
It is well known that requiring several cell divisions in reprogramming can be one reason why iPS cell generation is so slow and inefficient. These experimental facts lead us to the conjecture that the wild types of somatic cells can repair the epigenetic modifications after
cell division, but the somewhat artificial ceıls modified by the basic network cannot
sufficiently repair them. The epigenetic modifications of eukaryote cells can be also
Genes; Transti\propto’ Process
()1So\not\subset, Od4, Nanog genes are actng \varpi OctkSox2
c\sigmain Qof somatic state.
(i) Master genes of G145
(ii) \alpha krgenes as
*\backslash adivted in Qa/p\mu e\approx\infty roe
environment \dot{n}Gl.
; in G3 are activated by suppression ne genes in G\uparrow.
enes in Gare s\iotappraesd by activation
genes \dot{n}G3.
mes in G5 (Nanog et_{0}) are activated by
ppression of Q
mes \dot{n}\inftyare s\iota \mathfrak{p}praesed by activabOn
G5.
rog arming state
interpreted to be evolutionarily conserved, and this situation may not be applicable for the
artificial cells such as iPS/ES. With these considerations on mind, several conditions wiıl be
considered in the reprogramming process.
There are epigenetic states such as DNA methylation and histon modificstion. Since the reprogramming transition from these epigenetic states has two properties ofactive and passive processes. Then, let us consider the two stochastic processes which are in the absence and presence of cell divisions. In the absence of cell divisions incıuding both active and passive reprogramming processes, stochastic reıation between deterministic genes network equations is given by
P=p_{1}\cross\cdots\cross p_{I} (3)
where i shows the number of effective deterministic equations. Next let us consider in the
presence of cell divisions (passive reprogramming process). Given L the number of genes
epigenetically modified in somatic cells. Here r is defined as the probability attaining the
reprogrammed state after one cell division per one gene. The expectation value Q_{1} of the genes in a single DNA, which are in the reprogrammed state after one cell division, on the average, is given by
Q_{1}= \sum_{k-1}^{L}Ckr^{k}(1-r)^{L-k}\equiv Lr
. (4)After one cell division, the number of cells which have the partial reprogrammed region is
given by N_{{\imath}}=p_{1}N. (5)
where Nis the number of imtial somatic cells and p_{1}is the probability defined by the relation (3). This means the existence of Nı cells which have reprogrammed region Qı. The value Q_{n} after ntimes celı divisions and the number N_{n}ofpartially reprogrammed cells are represented as
Q_{n}=r(L-Q_{n-1})+Q_{n-1}\equiv L[1-(1-r)^{n}], N_{n}=p_{I}\cross\cdots p,N. (6) The reprogrammed ratio in a cell is represented as a function of cell divisions and is shown in Fig. 4a.
R_{n}= \frac{\partial}{\partial n}(\frac{Q_{n}}{L})=(1-r)^{n}\ln\frac{1}{1-r}
. (7) The minimum cell divisions M for the complete iPS cells is obtained by the following relationsNPL(1-r)^{M-{\imath}}\geq 1, NPL(1-r)^{M}<1. (8)
Then, Mis given by (shown in Fig. 4b)
M=ı‐
\frac{\log NPL}{\log({\imath}-r)}
. (9)The efficiency E_{f} producing iPSceıls is also given by (shown in Fig. 4c)
E_{f}=PL(1-r)^{M-1}
. (10)processes can be caıculated from equations 0,
(7), (9), (10). Choosing the values of R_{1}=
(a)_{0.0}
0.08, M=50 and E_{f}=1\% which is reaıistic
0.0
in the experimentaı data, the values of parameters are evaluated as P=0.001, L=
\propto_{0.0}^{*}Q
300 and r=0.08. Let us interpret briefly
r^{0.0}\Phi
some experimental facts related to the c\overline{E}0.0 success of reprogramming and its producing \varpi E
b^{0.0} efficiency. Why Klfi4 and c‐Myc enhance the \llcorner 0
iPS producing can be interpreted by two
oe\Phi a00
possible mechanisms. One of these is to 0.0decrease reprogramming time by 0. 0
acceıerating the cell division rate, and the
other is to prevent the epigenetic 0 20 40 60 80
modifications by the expressing factors of celldivisions, n
these genes. It is well known that the
inhibition of p53/p2 pathway does not Fig. 4 (a) Reprogramming rate
change necessary cell divisions to produce
(b) 1
(c) 0. 0.0 s \iota\check{u}^{0.0}\underline{oc\dot{\omega}}
w\hat{\mathbb{E}_{o}\epsilon 0}0.0\frac{o}{o}0.0
>=_{o}\sim 0
\underline{c}u^{0.0}
\equiv\in 3\in
3^{o}0.0
\equiv
!_{-0.0}^{t\hslash}\circ 0.0e
o.o
0 0. 10.20.30.40.50.60.70.80.9 I 0 0. 02 0. 04 0. 06 0. 08 0.\iota
Reprogramming probability per gene, r Reprogramming probability per gene. r
Fig. 4 (b) Minimum cell dvision for reprogramming; (c) iPSproducing efficiency
iPS cells, but it decreases the necessary time to produce iPS cells (Hanna et al., 2009). This
corresponds to the case that Mis unchanged and \tauis smaller in the model parameters. When
Nanog, that is one of proteins expressing in the basic network, increases, it will increase the
value of r because the repairing of epigenetic modification is prevented by operation of the
basic network. This explains the experimental fact that Nanog overexpression decreases the
necessary time to produce iPS cells. Only a small portion of the transduced cells become
pluripotent and the others become almost partially reprogrammed state. This phenomenon
may be corresponding to the case of r<<1 in the model. Also, the partially reprogrammed
cells not only express the genes expressing in both somatic and iPScells, but also express the
genes non‐expressing in these cells (Mikkelsen at al., 2006) In this model, the suppressed genes in somatic celıs can activate by de‐epigenetic process after celı divisions. Of these
genes, there exist the genes to be suppressive in iPS cells. However, there will be some cells which are not suppressed by basic network. This case is then considered to be the partially reprogrammed cells.
4. Conclusions
This model can compute the minimum cell divisions for attaining iPS cell and its generating efficiency, and can expıain various experimental facts which have been by now reported in iPS cells. The reprogramming mechanism considered here assumes the existence of the
undefmed determinants or environmental conditions suppressing the repair enzyme for the
epigenetic modifications. If suppressing determinants can be identified, it will make the efficiency of producing iPS cells more improved. More speculatively, since genes control system is not still closed, it wiıı be modified by the interaction with the unknown environment or material which must be evolutionally determined. Thus, if the genes control system experiences the environment which can be never realized in wild types of cells, it wiıl be
possible to change the genes control system drastically. This viewpoint may open a new
approach to controı the gene network including reprogramming treatment.
References
1. K. Takahashi, S. Yamanaka, Cell 126, 663 (2006). 2. K. Takahashi, et al., Cell 131, (2007).
3. K. Okita, T. Ichisaka, S. Yamanaka, Nature 448, 313 (2007). 4. M. Wemig, et al., Nature 448, 318 (2007).
5. N. Maherali, et al., Cell Stem Cell 1, 55 (2007). 6. J. Yu, et al., Science 318, 1917 (2007).
7. J. B. Gurdon, T. R. Elsdale, M. Fischberg, Nature 182, 64 (1958). 8. I. Wilmut, et al., Nature 385, 810 (ı997).
9. M. Tada, et al., Cum. Biol. 11, ı553 (2001). ı0. C. A. Cowan, et al., Science 309, 1369 (2005). ıl. L. A. Boyer, et al., Cell 122, 947 (2005). 12. H. Niwa, et al., Development 134, 635 (2007). 13. J. Kim, et al., Cell 132, 1049 (2008).
14. M. B. Elowitz, S. Leibler, Nature 403, 335 (2000). 15. T. S. Gardner, et al., Nature 403, 339 (2000). ı6. J. Hanna, et al., Nature 462, 595 (2009). 17. T. S. Mikkelsen, et al., Nature 454, 49 (2006).
School of Engineering University of Hyogo Himeji, Hyogo 671‐2201 Japan