Japan Advanced Institute of Science and Technology
JAIST Repository
https://dspace.jaist.ac.jp/Title
Computational study on ice growth inhibition of
Antarctic bacterium antifreeze protein using
coarse grained simulation
Author(s)
Nguyen, Hung; Le, Ly; Ho, Tu Bao
Citation
Journal of Chemical Physics, 140(22):
225101-1-225101-8
Issue Date
2014-06-11
Type
Journal Article
Text version
publisher
URL
http://hdl.handle.net/10119/12349
Rights
Copyright 2014 American Institute of Physics.
This article may be downloaded for personal use
only. Any other use requires prior permission of
the author and the American Institute of Physics.
The following article appeared in Hung Nguyen, Ly
Le, and Tu Bao Ho, Journal of Chemical Physics,
140(22), 225101 (2014) and may be found at
http://dx.doi.org/10.1063/1.4881895
Computational study on ice growth inhibition of Antarctic bacterium antifreeze protein
using coarse grained simulation
Hung Nguyen, Ly Le, and Tu Bao Ho
Citation: The Journal of Chemical Physics 140, 225101 (2014); doi: 10.1063/1.4881895
View online: http://dx.doi.org/10.1063/1.4881895
View Table of Contents: http://scitation.aip.org/content/aip/journal/jcp/140/22?ver=pdfcov
Published by the AIP Publishing
Articles you may be interested in
A coarse grain model for protein-surface interactions
J. Chem. Phys. 139, 095102 (2013); 10.1063/1.4819131
Influence of mobile DNA-protein-DNA bridges on DNA configurations: Coarse-grained Monte-Carlo simulations
J. Chem. Phys. 135, 125104 (2011); 10.1063/1.3636383
Monte Carlo study of the molecular mechanisms of surface-layer protein self-assembly
J. Chem. Phys. 134, 125103 (2011); 10.1063/1.3565457
Residue energy and mobility in sequence to global structure and dynamics of a HIV-1 protease (1DIFA) by a coarse-grained Monte Carlo simulation
J. Chem. Phys. 130, 044906 (2009); 10.1063/1.3050106
The role of sidechain packing and native contact interactions in folding: Discontinuous molecular dynamics folding simulations of an all-atom G model of fragment B of Staphylococcal protein A
THE JOURNAL OF CHEMICAL PHYSICS 140, 225101 (2014)
Computational study on ice growth inhibition of Antarctic bacterium
antifreeze protein using coarse grained simulation
Hung Nguyen,1Ly Le,1,2,a) and Tu Bao Ho3
1Life Science Laboratory of the Institute for Computational Science and Technology at Ho Chi Minh City, Vietnam
2School of Biotechnology of Ho Chi Minh International University, Vietnam National University, Ho Chi Minh City, Vietnam
3School of Knowledge Science of Japan Advanced Institute of Science and Technology, Nomi, Ishikawa, Japan
(Received 23 January 2014; accepted 22 May 2014; published online 11 June 2014)
Antarctic bacterium antifreeze proteins (AFPs) protect and support the survival of cold-adapted or-ganisms by binding and inhibiting the growth of ice crystals. The mechanism of the anti-freezing pro-cess in a water environment at low temperature of Antarctic bacterium AFPs remains unclear. In this research, we study the effects of Antarctic bacterium AFPs by coarse grained simulations solution at a temperature range from 262 to 273 K. The results indicated that Antarctic bacterium AFPs were fully active in temperatures greater than 265 K. Additionally, the specific temperature ranges at which the water molecules become completely frozen, partially frozen, and not frozen were identified. © 2014 AIP Publishing LLC. [http://dx.doi.org/10.1063/1.4881895]
I. INTRODUCTION
Many organisms that live in cold climates produce sev-eral specific types of proteins including antifreeze proteins (AFPs) and antifreeze glycoprotein (AFGPs)1 in order to inhibit growth of ice within their body fluids and sup-port their survival during winter condition.2,3 Especially, the AFPs found in a variety of organisms such as fishes,4–6
insects,7–9 plants,10,11 and bacteria12,13 have the ability to
prevent the formation and recrystallization of ice at ex-tremely low temperatures2 by adsorbing on the ice
sur-face. This mechanism was considered as recrystallization inhibition.14,15 Therefore, liquid water does not completely
form ice when it contains AFPs, even at significantly lower temperatures than the melting point of ice.2In cold
environ-ments, some bacteria and plants that cannot avoid freezing use AFPs to lessen the destructive effects of ice recrystalliza-tion. These AFPs have weak freezing point depression activity in order to avoid the uncontrolled growth of ice. The mecha-nism by which AFPs irreversibly bind to ice has not been fully understood.14
The binding site of AFPs was relatively hydropho-bic and also contained many potential hydrogen bond donors/acceptors. The extent to which hydrogen bonds and the hydrophobic effects contributed to ice binding has been debated for over last 30 years.16,17 These problems had been
elucidated by the ice binding mechanisms and the first crys-tal structure of Antarctic bacterium AFPs. The largest AFPs demonstrated that folds or Ca2+-bound parallel beta-helices with an extensive array of ice-like surface waters were an-chored via hydrogen bonds directly to the polypeptide back-bone and adjacent side chains.17
The AFPs produce the difference between the freezing and the melting temperature, which was identified as ther-a)E-mail: ly.le@hcmiu.edu.vn
mal hysteresis (TH) which has been used as a characteris-tic to measure AFPs activity.2,14,18,19 The presence of TH
activity of bacteria was first demonstrated by Duman and Olsen.20 AFPs can reduce the freezing point of aqueous flu-ids below the melting point of ice. Subsequently, a num-ber of cold-adapted bacteria have been found to possess AFPs with a proportional fraction to their body size includ-ing Antarctic isolates. As a result, the roles of bacterial AFPs in cold environment have been indicated.16 Some TH values
were found to be associated with AFPs isolated from insects (3–6◦C), fishes (0.7–1.5◦C), plants (0.2–0.5◦C), and bacte-ria (less than 0.1◦C).15 Therefore, it was certain that AFPs
in animals work by the mechanism of freeze avoidance, and mechanism of freeze tolerance was also the strategy used by the AFPs occurring in plants and bacteria. The Antarctic bac-terium AFPs could additionally perform the mechanism of freeze avoidance.15
In this research, we focused on the different effects of Antarctic bacterium AFPs in NaCl environment at a concen-tration of 0.6 mol/l at low temperatures. In comparison and review the inhibition ability in the salt liquid freezing process of Antarctic bacterium AFPs, the freezing process of salt solu-tion surrounding proteins and other related values of water-ice structures were observed by coarse grained simulations.
II. MATERIALS AND METHODS A. Preparation the protein structures for MD simulations
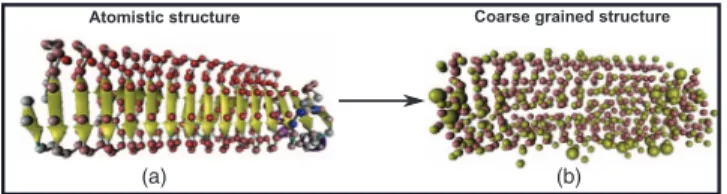
The 3D structure of Antarctic bacterium AFPs was taken from Protein Data Bank (PDB) with PDB entry 3P4G.17 The Visual Molecular Dynamics (VMD) software21was em-ployed to create the monomer structure of full-atom structure (Fig. 1(a)). And then, MARTINIZE version 2.2 was ap-plied to convert full-atom Antarctic bacterium AFPs structure
225101-2 Nguyen, Le, and Ho J. Chem. Phys. 140, 225101 (2014)
(a) (b)
FIG. 1. Image illustrates the atomistic structure (the beads are CA2+ions) (Fig.1(a)) and coarse grained structure (Fig.1(b)) of Antarctic bacterium AFPs.
existing in PDB format into coarse grained beads22
(Fig. 1(b)). In coarse grained model, each amino acid was modeled by one or two beads according to their specific sizes, which can be classified into two broad categories: backbone beads and side chain beads. The side chain and backbone beads can be denoted as SCi (i = ARG, GLN, GLU, HIS, ILE, LYS, MET, PHE, TRP, TYR) and BBi(i= ALA, ASN, ASP, CYS, GLY, LEU, PRO, SER, THR, VAL), respectively.
B. Simulation methods
All MD simulations were performed using GROMACS 4.5 package23 with MARTINI force field for coarse grained
model. The periodic boundary conditions were used through-out the simulation process; the electrostatic potential was shifted from 0.0 nm to 1.2 nm and the Lennard Jones (LJ) po-tential was shifted from 0.9 nm to 1.2 nm on all three axes (x, y, and z).24The complexes of Antarctic bacterium AFPs were
positioned inside a cubic box at a distance of 1.2 nm from the solute and the box wall; the water model was used specifically in coarse grained model (here was MARTINI force field).
The minimization was converged when the maximum force became smaller than 0.01 kJ/mol/nm; the steepest de-scent simulation for minimization was performed over 5000
steps. The equilibration was performed coupling with temper-ature and pressure. Constant tempertemper-ature 303 K was enforced using Berendsen algorithm25under 1 ns for constant volume and temperature (NVT) simulation with a damping coefficient of 0.1 ps; Parrinello-Rahman pressure26was coupled in 1.5 ns
constant pressure and temperature (NPT) run at 1 bar constant pressure with the damping coefficient of 0.1 ps. The structures were generated as the configurations for our MD simulation with 12 temperatures including 262 K, 263 K, 264 K, 265 K, 266 K, 267 K, 268 K, 269 K, 270 K, 271 K, 272 K, and 273 K. In addition, we also generated complex structure at 278 K for comparison. The final MD simulation allowed us to integrate the equations of motion with a time step of 1 fs and our sim-ulation run for totally 100 ns in the leap-frog algorithm.27
III. RESULTS AND DISCUSSION
The stability of simulation complex was explored by root mean square deviation (RMSD), which related to ini-tial complex structures. RMSD values of Antarctic bacterium AFPs (Figs.2(a)and2(b)) presented large variations in mag-nitude and interactions between Antarctic bacterium AFPs residues and water molecules. It is reasonable that available Ca2+ions in the original structure of the Antarctic bacterium AFPs play a key role in contributing to inhibit their water freezing process at low temperatures. The RMSD results for 12 temperatures were divided into two separate states: from 262 K to 267 K (Fig. 2(a)), and 268 K and over (Fig.2(b)). In the former, RMSD fluctuated slightly in the first 20 ns and then remained stable at under 0.7 nm. However, the lat-ter saw the significant fluctuations in RMSD, which indicated strong interactions between proteins and other molecules in the simulation systems (here, other molecules were in-cluded: water molecules, Na+ and Cl−ions). Especially, the RMSD of Antarctic bacterium AFPs at 270 K was remarkably
FIG. 2. Root mean square deviation (RMSD) (Figs.2(a)and2(b)) and root mean square fluctuation (RMSF) (Figs.2(c)and2(d)) values of Antarctic bacterium AFPs.
225101-3 Nguyen, Le, and Ho J. Chem. Phys. 140, 225101 (2014)
FIG. 3. The percentages of hydrophobic interactions of Antarctic bacterium AFPs were calculated from 262 K to 273 K and 278 K.
highest throughout the simulation systems with the peak value of 1.0226 nm.
Besides, the root mean square fluctuation (RMSF) of Antarctic bacterium AFPs, showed in Figs. 2(c) and 2(d), presented the characteristic variation of each residue in the whole simulation process. Similarly to the RMSD’s results, the RMSF values presented changes along the simulation tem-perature range of Antarctic bacterium AFPs. The RMSF val-ues of Antarctic bacterium AFP residval-ues (Fig. 2(c)) were fluctuated lower than 0.8 nm. From 269 K to 273 K, the RMSF started fluctuating strongly, especially at the first 65 residues and the last 43 residues during complex simulation (Fig. 2(d)). The RMSF value of Antarctic bacterium AFPs at 270 K contained the numbered residue 301 reached the level of 1.1403 nm, which was also the largest value in the whole results. From these results, it can be defined that all hy-drophobic residues in AFPs could interact strongly with wa-ter molecules, Na+and Cl−ions; thereby inhibit the freezing process of water molecules at low temperatures. These results were further investigated more details in Sec.IV.
In Fig. 3, the hydrophobic residues would be bounded to ice crystals and hydrophilic residues were exposed to liq-uid water. The interactions of hydrophobic residues with ice would produce entropy while those hydrophilic residues ex-posed to liquid water surrounding formed vaguely hexago-nal shapes (cage-like structures). The exposure process of hy-drophilic residues to liquid water would produce enthalpy and possibly lead to the rearrangement of liquid water molecules to form hydrogen bonds with hydrophilic residues. From en-tropy and enthalpy achievements, this finding has shed some light on the reasons why ice binding regions of Antarctic bac-terium AFPs are various at different temperatures.
The radial distribution function was used when water structures were studied. The aqueous solution was frozen at extremely low temperatures and formed the ice structure
net-work under the vaguely hexagonal shape.28,29 The ice
struc-ture network would be gradually enhanced with the simula-tion time, thereby probably expand the influenced region of ice crystals in the whole simulation space. The activity of liq-uid water will be reduced and completely inhibited in order to form the crystal structure (crystallize or recrystallize process). The thermodynamic process would be subsided and most
(a)
(b)
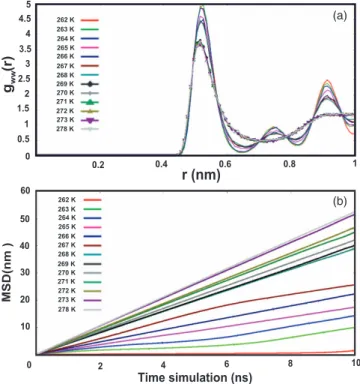
FIG. 4. Water-water radial distribution function (gww(r)) is shown in
Fig.4(a)(the results described were the last frame of 100 ns simulation) and Fig.4(b)illustrated mean square displacement (MSD) values as a function of time in 10 ns simulation time.
225101-4 Nguyen, Le, and Ho J. Chem. Phys. 140, 225101 (2014)
FIG. 5. The snapshots showed the freezing process of Antarctic bacterium AFPs in NaCl environment from 262 K to 265 K, respectively. It was shown by VMD software.
activities of the creatures living in ice environment will be completely paralyzed. In general, the gww(r) value has proved that water molecules have ability to form the ice crystal struc-tures or ice-water strucstruc-tures, or maintain liquid solution. The gww(r) of water-water beads surrounded Antarctic bacterium AFPs for coarse grained model (Fig.4(a)) was distinguished among different temperatures from 262 K to 273 K. Here, it could be divided into three stages based on gww(r) values: First, from 262 K to 264 K, the gww(r) fluctuated around the r distance of 2.5 nm, and water molecules existed in ice ar-ray formation completely (100% ice crystal structures). The height of three peaks from 262 K to 264 K decreased when
the temperatures increased, which was inversely proportional. Second, from 265 K to 268 K, the gww(r) values reached from 1.55 nm to 2.45 nm. From this it could be inferred that water molecules around Antarctic bacterium AFPs became partially frozen and the ratio of ice existence in the complex mainly depended on the simulation temperatures. For instance, water molecules at 265 K formed ice crystals more than liquid water and when the temperature increased to 268 K, the ice crystals were formed less than liquid water. Finally, from 269 K to 273 K, the gww(r) values remained stable at 1.375 nm, water molecules were entirely in a liquid state. In addition, we also show the gww(r) of 278 K to compare with 12 temperatures
225101-5 Nguyen, Le, and Ho J. Chem. Phys. 140, 225101 (2014)
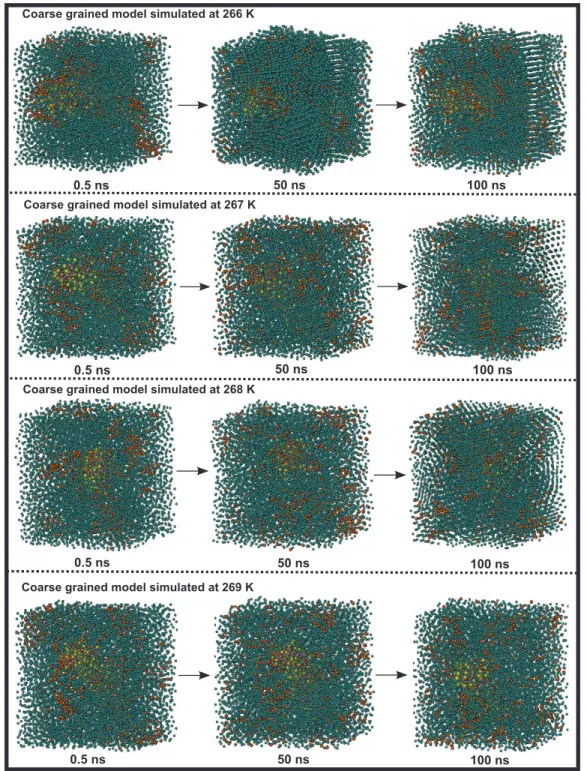
FIG. 6. The snapshots showed the freezing process of Antarctic bacterium AFPs in NaCl environment from 266 K to 269 K, respectively. It was shown by VMD software.
above, and this value is overlapped with the gww(r) of temper-atures from 269 K to 273 K. These findings will be mentioned in detail in some snapshots below (Figs. 5 and6). Hence it could be confirmed that Antarctic bacterium AFPs were only activated by the ability of inhibiting the ice growth at the temperatures greater than 265 K, which is in agreement with the prior experimental results. Simultaneously, mean square displacement (MSD) results of water in Fig. 4(b)also indi-cated that the restraints restricted the diffusion adequately. The MSD values were calculated for 10 ns of stable sim-ulation. These images became interferences when time in-creased. We see that the MSD values increased when the
tem-peratures increased; the smallest result was at 262 K and the largest at 278 K.
The simulations provide a clue as to how the freezing transition happens at lower temperature for Antarctic bac-terium AFPs. Figs.5and6show snapshots of Antarctic bac-terium AFPs and surrounding water molecules during the growth of ice and Antarctic bacterium AFPs partially sur-rounded by the growth of ice during the simulation. Here, each figure showed complex structures at 0.5 ns, 50 ns, and 100 ns simulation time at four different temperatures. In Fig.5, we present the snapshots of Antarctic bacterium AFPs, water molecules, Na+and Cl−ions in simulation complexes
225101-6 Nguyen, Le, and Ho J. Chem. Phys. 140, 225101 (2014)
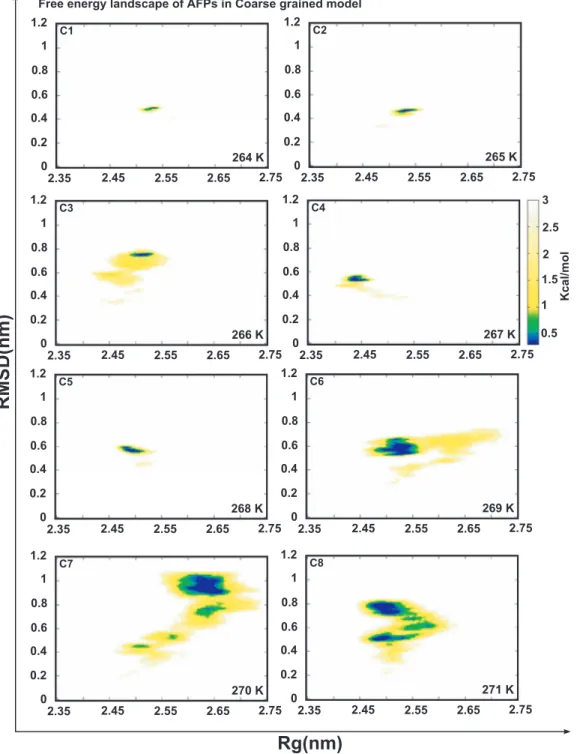
FIG. 7. Free energy landscape of Antarctic bacterium AFPs from 264 K to 271 K. RMSD stands for root mean square deviation of protein and Rg represents the radius of gyration of protein.
at 262 K, 263 K, 264 K, and 265 K, respectively. It can be seen that from 262 K to 264 K, the water molecules were not frozen at 0.5 ns, but were completely frozen after 50 ns simulation. There was a difference between the crystal struc-tures of ice forming at 262 K and those at 263 K and 264 K. Whereas the growth of ice crystals at 262 K did not follow certain directions, and be interspersed between segments; at 263 K and 264 K, the ice crystals were formed in a certain di-rection, which were stacked between the ice arrays. Actually, the ice formation only occurs randomly, so it is not a spe-cial problem. With the complex at 265 K, the ice crystals in the complex were much more than liquid water components,
only a small amount of liquid water existed around Antarctic bacterium AFPs.
Fig. 6 showed the snapshots of complexes at tempera-tures from 266 K to 269 K. From 266 K to 268 K, the wa-ter molecules transformed partially into ice crystal structures around Antarctic bacterium AFPs, the ice formations in these temperatures gradually reduced when the temperatures in-creased. The ice crystals in the complex were less than liquid water components. Apparently, the ratio of ice to liquid wa-ter in these three temperatures was insignificantly small. Oth-erwise, the water molecules around the Antarctic bacterium AFPs were completely in the form of liquid water when
225101-7 Nguyen, Le, and Ho J. Chem. Phys. 140, 225101 (2014)
temperature was equal or greater than 269 K. These snap-shots provide useful background to identify different temper-ature ranges that Antarctic bacterium AFPs can be activated in NaCl environment.
In this work, the free energy landscape was employed to determine the most stable structure of the complex system corresponding to local energy minimum point. The typical structures from the simulation were also chosen from free ergy landscape via choosing the minimum regions of free en-ergy landscape values. Hence, the ice binding site of Antarctic bacterium AFPs could be determined via local energy mini-mum regions on free energy landscape. Fig.7shows the free energy landscape for the Antarctic bacterium AFPs structure at different temperatures from 264 K to 271 K. These val-ues of the Antarctic bacterium AFPs structure are the most stable and repeated abundantly with minimum free energy values. There were significant changes of magnitude in min-imum free energy regions, which was extended along when the temperatures increased. The residues of protein fluctuated strongly when the bound of ice crystal structure and the com-plex was not frozen at low temperatures, leading to the expan-sion of free energy minimum regions. At those temperatures, Antarctic bacterium AFPs have enough conditions to activate the freezing process inhibition of liquid water (normally at those temperatures water is frozen). Meanwhile, side chains in Antarctic bacterium AFPs that act strongly will form much more configurations having tendency to stabilize. That is the reason why, with the complexes at high temperatures, the area of local minimum energy region is much larger. The number of structures accepted as stable structures was also identified easily. In detail, free energy landscapes for temperatures from 264 K to 268 K have smaller local minimum energy regions compared with those for temperatures equal and greater than 269 K.
IV. CONCLUSIONS
In conclusion, the results from our simulations have shed some light into the exact mechanism of Antarctic bac-terium AFPs in NaCl environment among various tempera-tures ranging from 262 K to 273 K. This study pointed out that Antarctic bacterium has the capability to inhibit the freezing process of water at low temperatures. In addition, we also identified specific temperature ranges at which water molecules become completely frozen (from 262 K to 264 K), partially frozen (from 265 K to 268 K), and not frozen (the temperatures are greater than 268 K). As a result, we can iden-tify action temperature ranges at which Antarctic bacterium AFPs can exist at low temperature environment.
In general, freezing of water is a slow process in compar-ison with time scale in simulation. The coarse grained models allow us to overcome this limitation and to capture the role of anti-freezing protein with affordable computing expense. However, with coarse grained models, we lost some detailed information, specifically, the effect of protonated amino acids near Ca2+on ice formation. Further studies at lower salt con-centration with atomistic MD simulation are strongly recom-mended.
ACKNOWLEDGMENTS
The work was funded by the Department of the Navy, Of-fice of Naval Research under Grant No. N62909-12-1-7121. The computing resources and support provided by the School of Knowledge Science of Japan Advanced Institute of Science and Technology are gratefully acknowledged.
1Y. Yeh and R. E. Feeney, “Antifreeze proteins: Structures and mechanisms
of function,”Chem. Rev.96, 601–618 (1996).
2H. Nada and Y. Furukawa, “Antifreeze proteins: Computer simulation
stud-ies on the mechanism of ice growth inhibition,”Polym. J.44, 690–698
(2012).
3E. Kristiansen, E. Wilkens, B. Vincents, D. Friis, A. B. Lorentzen, H.
Jenssen, A. Lobner-Olesen, and H. Ramlov, “Hyperactive antifreeze pro-teins from longhorn beetles: Some structural insights,”Insects Physiol.58,
1502–1510 (2012).
4A. L. DeVries, S. K. Komatsu, and R. E. Feeney, “Chemical and
phys-ical properties of freezing point depressing glycoproteins from Antarctic fishes,” Biol. Chem. 245, 2901–2908 (1970).
5P. L. Davies, C. L. Hew, and G. L. Fletcher, “Fish antifreeze proteins:
Phys-iology and evolutionary bPhys-iology,”Can. J. Zool.66, 2611–2617 (1980).
6C. B. Marshall, G. L. Fletcher, and P. L. Davies, “Hyperactive antifreeze
protein in a fish,”Nature (London)429, 153 (2004).
7C. L. Hew, M. H. Kao, Y.-P. So, and K.-P Lim, “Presence of
cystine-containing antifreeze proteins in the spruce budworm, Choristoneura
fu-miferana,”Can. J. Zool.61, 2324–2328 (1983).
8R. Schneppenheim and H. Theede, “Isolation and characterization of
freezing-point depressing peptides from larvae of Tenebrio molitor,”
Comp. Biochem. Physiol., Part B: Biochem. Mol. Biol.67, 561–568 (1980).
9J. G. Duman, V. Bennett, T. Sformo, R. Hochstrasser, and B. M. Barnes,
“Anti-freeze proteins in Alaskan insects and spiders,”Insects Physiol.50,
259–266 (2004).
10O. Atıcı and B. Nalbantoglu, “Antifreeze proteins in higher plants,” Phyto-chemistry64, 1187–1196 (2003).
11M. Griffith and M. W. F. Yaish, “Antifreeze proteins in overwintering
plants: A tale of two activities,”Trends Plant Sci.9, 399–405 (2004).
12K. Meister, S. Ebbinghaus, Y. Xu, G. D. John, A. DeVries, M. Gruebele,
M. L. David, and M. Havenith, “Long-range protein-water dynamics in hyperactive insect antifreeze proteins,”Proc. Natl. Acad. Sci. U.S.A.110,
1617–1622 (2012).
13C. Yang and A. S. Kim, “The mechanism of the type III antifreeze protein
action: A computational study,”Biophys. Chem.109, 137–148 (2004).
14A. G. Jack, L. D. Peter, and L.-P. Johanna, “A hyperactive, Ca2+-
depen-dent antifreeze protein in an Antarctic bacterium,”FEMS Microbiol. Lett.
245, 67–72 (2005).
15M. K. Chattopadhyay, “Antifreeze proteins of bacteria,”Resonance12, 25–
30 (2007).
16P. L. Davies, J. Baardsnes, M. J. Kuiper, and V. K. Walker, “Structure and
function of antifreeze proteins,”Philos. Trans. R. Soc. Lond. B357, 927–
935 (2002).
17P. G. Christopher, L. C. Robert, and L. D. Peter, “Anchored clathrate waters
bind antifreeze proteins to ice,”Proc. Natl. Acad. Sci. U.S.A.108, 7363–
7367 (2011).
18P. G. Christopher, A. G. Jack, P. H. Christopher, L. C. Robert, L.-P.
Jo-hanna, and L. D. Peter, “A Ca2+-dependent bacterial antifreeze protein do-main has a novel β-helical ice-binding fold,”Proc. Natl. Acad. Sci. U.S.A.
411, 171–180 (2008).
19H. Kondo, Y. Hanada, H. Sugimoto, T. Hoshino, P. G. Christopher, and L.
D. Peter, “Ice-binding site of snow mold fungus antifreeze protein deviates from structural regularity and high conservation,”Proc. Natl. Acad. Sci. U.S.A.109, 9360–9365 (2012).
20G. D. John and T. M. Olsen, “Thermal hysteresis protein activity in
bacte-ria, fungi and phylogenetically diverse plants,”Cryobiology30, 322–328
(1993).
21W. Humphrey, A. Dalke, and K. Schulten, “VMD-visual molecular
dynam-ics,”Mol. Graphics14, 33–38 (1996).
22J. M. Siewert, H. J. Risselada, S. Yefimov, D. P. Tieleman, and H. D. Alex,
“The MARTINI force field: Coarse grained model for biomolecular simu-lation,”Phys. Chem. B111, 7812–7824 (2007).
23B. Hess, C. Kutzner, D. van der Spoel, and E. Lindahl, “GROMACS 4:
Al-gorithms for highly efficient, load-balanced, and scalable molecular simu-lation,”Chem. Theory Comput.4, 435–447 (2008).
225101-8 Nguyen, Le, and Ho J. Chem. Phys. 140, 225101 (2014)
24T. Darden, D. York, and J. Pedersen, “Particle mesh Ewald: An Nlog (N)
method for Ewald sums in large systems,”Chem. Phys.98, 10089–10092
(1993).
25H. J. C. Berendsen, J. P. M. Postma, W. F. V. Gunsteren, A. Dinola, and J.
R. Haak, “Molecular dynamics with coupling to an external bath,”Chem. Phys.81, 3684–3690 (1984).
26M. Parrinello, A. Rahman, “Polymorphic transitions in single crystals: A
new molecular dynamics method,”Appl. Phys.52, 7182–7190 (1981).
27R. W. Hockney, S. P. Goel, and J. Eastwood, “Quiet high resolution
com-puter models of plasma,”J. Comput. Phys.14, 148–158 (1974).
28L. M. Tamsin, J. M. Benjamin, V. B. Andrey, J. Anwar, and G. S. Christoph,
“Structure of ice crystallized from supercooled water,”Proc. Natl. Acad. Sci. U.S.A.109, 1041–1045 (2011).
29R. A. Nistor, T. E. Markland, and B. J. Berne, “Interface-limit growth of
heterogeneously nucleated ice in supercooled water,”Phys. Chem. B118,