令和元年度
学位論⽂(博⼠)
Altered Limb Representation in the Rat Motor Cortices Under
Hemiparkinsonian State
令和 元年 7 ⽉ 23 ⽇ 提出
⽟川⼤学⼤学院脳科学研究科
脳科学専攻
学籍番号
162725002
Alain Antonio Ríos Dávila
アライン アントニオ リオス ダビラ
0. Index
0. Index 1. Abstract 2. Introduction 3. Materials and Methods 4. Results 5. Discussion and Conclusion 6. References 7. Figures 8. Resume 9. Acknowledgments 3 5 6 11 24 34 46 61 72 74
Declaration. The present study is fundamentally based on the methodology and data published in the next scientific article: Rios A, Soma S,
Yoshida J, Nonomura S, Kawabata M, Sakai Y, Isomura Y (2019) Differential changes in the lateralized activity of identified projection neurons of motor cortex in hemiparkinsonian rats. eNeuro; 10.1523/ENEURO.0110-19.2019
1. Abstract
Parkinson’s disease (PD) is a neurodegenerative disorder produced by the loss of dopaminergic neurons in the substantia nigra pars compacta (SNc), leading to an abnormal activity of the cortico-basal ganglia circuit. The most striking disabilities resulting from these changes include paucity and slowness of movements, stiffness, and tremor. In the parkinsonian state, the motor cortex and basal ganglia undergo dynamic remodeling of movement representation. One such change is the loss of the normal contralateral lateralized activity pattern. The increasing number of movement-related neurons responding to ipsilateral or bilateral limb movements may produce motor problems, including impaired balance, reduced bimanual coordination, and abnormal mirror movements. However, it remains unknown how individual types of motor cortical neurons are reorganized during the pathological process or compensatory changes. To explore the effect of dopamine depletion on lateralized activity in the parkinsonian state, we used a partial hemiparkinsonian model (6-hydroxydopamine lesion) in Long-Evans rats performing unilateral movements in a right–left pedal task, while recording from primary (M1) and secondary motor cortex (M2). In the parkinsonian condition we found a decrease contralateral preferred activity in both M1 and M2. In addition, the change in the forelimb selectivity differed among identified intratelencephalic (IT) and pyramidal tract (PT) cortical projection neurons, depending on the cortical area. We detected a decrease in lateralized activity only in PT neurons in M1, whereas in M2, this change was observed in IT neurons, with no change in the PT population. Our results suggest a differential effect of dopamine depletion in the lateralized activity of the motor cortex, and suggest possible compensatory changes in the contralateral hemisphere.
2. Introduction
Parkinson’s disease (PD) is a neurodegenerative disorder produced by the loss of dopaminergic neurons in the substantia nigra pars compacta (SNc), which leads to an abnormal activity of the cortico-basal ganglia circuit (Gradinaru, 2009). The most striking physical disabilities resulting from these changes include paucity and slowness of movements, stiffness, and tremor (Galvan, 2008). Because the locus of primary pathology is in the SNc, PD research has focused on the basal ganglia (BG). However, dopamine depletion in one hemisphere may not only disturb the function of the BG, but also affects frontal areas of the cortex in the same side and produces compensatory shifts in activation towards motor and non-motor areas of the contralateral hemisphere (Shepherd, 2013; Pasquereau, 2011, 2016). Box 1. Parkinson’s Disease Definition. Parkinson disease (PD) is the most common cause of parkinsonism, a syndrome manifested by rest tremor, rigidity, bradykinesia, and postural instability. A meta-analysis of 47 studies found that the worldwide prevalence of was approximately 0.3 percent in the general population 40 years of age and older (Pringsheim, 2014). A systematic review estimated a global prevalence of 6.1 million people with PD in the year 2016, increased from 2.5 million in 1990, and PD is the fastest growing source of disability due to neurologic disorders (GBD PDC, 2018). Risk Factors. An inverse correlation between PD and smoking is supported by the findings of large cohort studies and meta-analyses (Noyce, 2012). Other factors associated with a reduced risk of PD in at least some studies include coffee and caffeine intake, exercise, ibuprofen, and statins (Noyce, 2012; Fang, 2018; Samii, 2009; Bai, 2016). On the other hand, a family history of PD is an important risk factor for developing PD (Pringsheim, 2014). A number of reports, including several large population-based case-control studies, have found an association between depression, history of constipation, exposure to pesticides, high consumption of dairy products and the subsequent development of PD (Gustafsson, 2015; Noyce A, 2012; Jiang W, 2014). Although the majority of cases of PD appear to be sporadic, there is increasing evidence that genetic factors play a role in the pathogenesis of PD, particularly when the age at symptom onset is younger than 50 years (Singleton, 2013). These familial forms of parkinsonism (designated PARK1 through PARK13) have been associated with causative mutations in a number of nuclear genes (Klein, 2007).
Pathological Findings. Depigmentation, neuronal loss, and gliosis, particularly in the substantia nigra pars
compacta (SNc) and in the pontine locus ceruleus, are typical abnormalities found in the brains of patients with PD. The ventrolateral portion of the substantia nigra that projects to the dorsal putamen is preferentially affected early in the course of PD, resulting in the gradual loss of dopaminergic neurons in the SNc and a nearly complete depletion of dopamine, particularly in the putamen (Porritt, 2005). This contrasts with normal aging, which is usually associated with neuronal loss in the dorsal tier of the SNc, and depletion of dopamine, predominantly in the caudate nucleus (Fearnley, 1991).
While there is evidence for alteration of somatotopy and motor mapping at several levels of the basal ganglia circuit in parkinsonian conditions, the exact cellular and synaptic structure supporting these maps (and action selection) is yet unclear. However, several studies have examined the sensory receptive fields of basal ganglia neurons during single-unit recordings and have observed changes in parkinsonian animals. In the striatum of rats and cats, clusters of units responsive to somatosensory stimulation shrank in size and showed diminished spatial specificity (Rothblat, 1995; Cho, 2002). Similarly, while most GPi neurons in healthy primates responded to one type of passive joint movement, in parkinsonian animals the majority of neurons responded to multiple joint movements (Boraud, 2000). Results at the level of the motor thalamus have proven more variable. Increases in responsiveness of single units to somatosensory stimulation have been reported (Pessiglione, 2005), though no change (Kiss, 2003) and even decreases (Schneider, 1996) have been reported as well. Changes in receptive fields suggest the possibility that dopamine-related changes in synaptic connectivity may lead Box 1. Parkinson’s Disease, continue. Clinical Manifestations and Diagnosis. The cardinal features of PD are tremor, bradykinesia, and rigidity. A fourth feature, postural instability, is commonly mentioned, although it does not generally occur until much later in the course of the disease and is thus not included in any published diagnostic criteria for PD (Gelb, 1999; Galvan, 2008). The severity of motor symptoms appears to be an independent predictor of mortality in patients with PD (Forsaa, 2010). At a minimum, bradykinesia plus either tremor or rigidity must be present in order to consider the diagnosis of PD (Postuma, 2015; Gibb, 1988). In addition, an unequivocal, beneficial response to dopaminergic therapy is an important supportive feature of the diagnosis, while the absence of an observable response to high-dose levodopa therapy (>1000 mg daily) in patients with at least a moderate severity of parkinsonism makes the diagnosis of PD extremely unlikely. Other clinical features that are supportive of the diagnosis are unilateral onset, presence of a rest tremor, and a persistent asymmetry throughout the course of the disease, with the side of onset most affected (Hughes, 1992).
Pharmacologic Treatment. The four main drugs or classes of drugs that have antiparkinson activity are
monoamine oxidase type B (MAO B) inhibitors, amantadine, dopamine agonists (DAs), and levodopa. They differ with respect to potency, dosing frequency, and side effects. All are considered to be symptomatic therapies, and none have been firmly established as disease modifying or neuroprotective (Fox, 2018).
to deficits in action selection.
Neuroimaging and electrophysiological studies in humans and monkeys have shown that unilateral movements are associated with preferred activation (lateralization) of the contralateral M1, premotor cortex (PM) and supplementary motor area (SMA) (Colebatch, 1991; Catalan, 1998; Mattay, 1998; Solodkin, 2001; Kurata, 2007). However, there is a difference in the degree of lateralization among M1 and other motor areas: the preferred activation during contralateral movements in M1 contrasts with the bilateral activation of PM (Kurata, 2007; Soma, 2017, 2019). Imaging studies have revealed that the lateralization in the Box 2. Basal Ganglia Models Parallel Circuit Model. This model proposes that different types of information (sensorimotor, associative, limbic) flow in parallel streams through the BG thalamo-cortical loop. At the simplest level, this model divides the striatum into three broad regions: the ventral striatum, the caudate and pre-commissural putamen, and the post-commissural putamen. The ventral striatum, comprised of the nucleus accumbens and olfactory tubercle, receives glutamatergic input from limbic regions and is predominantly innervated by dopamine neurons in the VTA. The caudate and pre-commissural putamen receive dopaminergic input from the SNc and glutamatergic input from associative regions. The post-commissural putamen also receives dopaminergic input from the SNc but receives greater input from sensorimotor regions of the cortex. Notably, in rodents, the dorsal striatum is contiguous, with the dorsomedial portion receiving greater associative input and the dorsolateral greater sensorimotor input. Limbic, associative, and sensorimotor channels arise at the level of striatal input but are preserved in part through downstream basal ganglia structures. The Classical Model. The classical model divides striatal MSNs into two populations, direct and indirect pathway MSNs, based on their projection targets. Direct pathway MSNs (dMSNs) project directly to basal ganglia output (GPi/SNr) and express Gaolf-coupled D1-like dopamine receptors (Gerfen, 1990; Herve ́, 1995; Deng, 2006). Thus, activation of the direct pathway is thought to decrease basal ganglia output, disinhibiting the thalamus and promoting movement. In contrast, indirect pathway MSNs (iMSNs) project to basal ganglia output indirectly via the GPe and STN and express Gi-coupled D2-like dopamine receptors (Gerfen, 1990; Herve , 1995; Deng, 2006). Activation of this pathway is thought to increase basal ganglia output, inhibiting the thalamus and suppressing movement. The net effect of dopaminergic signaling, according to this model, is to promote movement by suppressing basal ganglia output from the GPi. In PD, dopamine loss is predicted to cause imbalanced activity between the two pathways at the striatal level. Excessive indirect pathway activity is hypothesized to suppress GPe firing, increase STN activity, and drive an increase in GPi-mediated thalamic inhibition. Concurrently, diminished direct pathway firing is thought to disinhibit GPi neurons, furthering suppression of the thalamus and cortex.
Center-Surround Model. The center-surround model provides a conceptual framework for how basal
output might control selection of actions and shape motor deficits (Nambu, 2005). The underlying concept of this model is that to execute an action, other similar or competing actions must be simultaneously suppressed. In this model, activation of direct cortical-STN projections (the hyperdirect pathway [Monakow, 1978; Nambu, 2005]) produces broad increases in GPi firing, which in turn inhibit thalamus and cortex to suppress competing actions.
motor cortex is diminished in PD (Wu, 2015). Moreover, parkinsonian patients and animal models exhibit reduced activity in the contralateral BG or motor thalamic nuclei (Donoghue, 1982; Taha, 1996; Boraud, 2000; Levy, 2001; Pessiglione, 2005; Baker, 2010). Patients with PD commonly exhibit motor symptoms related to abnormal selective limb representation, such as impaired bimanual coordination or mirror movements (i.e., simultaneous contralateral, involuntary, identical movements that accompany voluntary movements) (Espay, 2005), circumstances that have been attributed to the loss of this lateralized activity pattern (Johnson, 1998; van den Berg, 2000; Almeida, 2002; Vidal, 2003; Espay, 2005; Li, 2007; Ottaviani, 2008; Borgheresi, 2010; Wu, 2010, 2015).
Rodents are suitable for investigations of motor information processing due to the possibility of genetic and optical manipulation and identification of specific neurons and circuits in these animals. Also, the use of head-fixed rodents has been useful for the precise study of forelimb movements in a stable posture (Kimura, 2012; Saiki, 2018). By contrast, most hemiparkinsonian rat studies used anesthetized or freely moving animals (Magill, 2001; Mallet 2008; Lemaire, 2012; Delaville, 2015).
In rodents, M1 and M2 are homologous to primate M1 and PM/SMA, respectively (Donoghue, 1982; Neafsey, 1986; Reep, 1987; Rouiller, 1993; Deffeyes, 2015; Hira, 2015). Previous studies show that M1 neurons undergo greater activation during contralateral movements than M2 neurons, supporting the idea of functional diversity between rodent motor cortices (Soma, 2017, 2019). In addition, the motor cortical areas have two classes of projection neurons with specific morphologies and axonal projections: intratelencephalic (IT) and pyramidal tract (PT) neurons (Shepherd, 2013, 2014). IT neurons send projections bilaterally to other areas within the telencephalon. By contrast, PT neurons send projections
to the ipsilateral cortex, striatum, thalamus, pontine nuclei, and contralateral spinal cord, but do not send bilateral telencephalic projections (Reiner, 2003; Morishima, 2006). In accordance with the anatomical traits of these neurons (Shepherd, 2014; Harris, 2015), PT neurons represent contralateral movements more preferentially than IT neurons in M1 and M2 of primates (Tanji, 1987) and rodents (Soma, 2017). The parkinsonian state produces specific changes in these cortical projection neurons (Shepherd, 2013). Studies of identified projection neurons in M1 in hemiparkinsonian primates revealed selective abnormalities in the PT population, including reduced resting firing rates, an elevated tendency to fire action potentials in irregular patterns, and a weakened encoding of movement kinematics (Pasquereau, 2011, 2016). However, we have yet to elucidate the control of ipsi- and contralateral movements in parkinsonism, as well as how specific neuronal populations are reorganized under this condition.
In this study, it was analyzed the effect of partial unilateral striatal dopamine loss in the lateralized activity of M1 and M2, and possible compensatory changes in the contralateral hemisphere. This objective was approached with an optogenetic spike collision method in transgenic rats to identify two kinds of projection neurons (IT and PT) and interneurons. During the recording sessions, the rats performed a two-pedal behavioral task that required unilateral movements. In a partially lesioned hemiparkinsonian model, the rats were able to successfully perform the task with both forelimbs, but still exhibited some of the characteristic parkinsonian behaviors and changes in cortical activity (Sauer, 1994; Brazhnik, 2012; Hernandez, 2013; Guo, 2015; Jávor-Duray, 2015).
3. Materials and Methods Animals and surgery
All experiments were approved by the Animal Research Ethics Committee of Tamagawa University and were performed in accordance with the Fundamental Guidelines for Proper Conduct of Animal Experiment and Related Activities in Academic Research Institutions (Ministry of Education, Culture, Sports, Science, and Technology of Japan) and the Guidelines for Animal Experimentation in Neuroscience (Japan Neuroscience Society). All surgical procedures were performed under appropriate isoflurane anesthesia (see below), and all reasonable efforts were made to minimize suffering. Eighteen adult W-TChR2V4 Long-Evans rats (253 ± 41 g, males) that expressed the ChR2-Venus conjugate under the control of the Thy1.2 promoter (Tomita, 2009) were kept in their home cage under an inverted light schedule (lights off at 9:00 A.M.; lights on at 9:00 P.M.). The rats were briefly handled by the experimenter (10 min/day on two days) before the surgery. For implantation of the head-plate (CFR-2, Narishige) and injection of 6-hydroxydopamine (6-OHDA), animals were anesthetized with isoflurane (4.5% for induction and 2.0–2.5% for maintenance; Pfizer) using an inhalation anesthesia apparatus (Univentor 400 anesthesia unit, Univentor) and placed on a stereotaxic frame (SR-10R-HT, Narishige). For local anesthesia, lidocaine (AstraZeneca) was administered around the surgical incisions. Reference and ground electrodes (Teflon-coated silver wires, A-M Systems; 125 μm in diameter) were implanted above the cerebellum. During anesthesia, body temperature was maintained at 37°C using an animal warmer (BWT-100, Bio Research Center). Analgesics and antibiotics were applied postoperatively as required (meloxicam, 1 mg/kg s.c., Boehringer Ingelheim; gentamicin ointment, 0.1%, MSD). In some experiments (seven hemiparkinsonian [13 sessions] and 6
healthy rats [6 sessions]), a twisted Teflon-coated silver wire electrode was implanted into both upper forelimbs (near the biceps brachii muscle) for simultaneous monitoring of EMG activity in both forelimbs. After full recovery from surgery (5 days later), rats had ad libitum access to water for one day a week, but during the rest of the week could obtain water only by performing the task correctly. When necessary, an agar block (containing 15 ml of water) was given to the rats in their home cage to maintain them at 85% of original body weight (Saiki, 2014). 6-OHDA lesion 6-OHDA injections were performed in the same surgical session as for the head-plate implant. Two doses of 3 μl of solution containing 12 μg of 6-OHDA bromide (Sigma) in 0.9% saline NaCl stabilized with 0.05% ascorbic acid, were injected trough a glass capillary with a 50-μm tip into two right dorsolateral striatum (DLS) locations with the following coordinates: AP +1, ML +3.5, DV -4 mm, and AP +0.2, ML +3.8, -DV 4.5 mm. Similar amount of 0.9% saline NaCl was injected in the left hemisphere (Lemaire, 2012; Hernandez, 2013; Guo, 2015). Injections were administered at 0.1 μl per minute using an automatic injection pump. After the injection was completed, the capillary was left in place for 5 additional minutes to allow diffusion and to prevent the solution from flowing back up the guide. Desipramine hydrochloride solution (25 mg/kg, Sigma) was injected intraperitoneally 30 minutes before 6-OHDA injection in order to protect noradrenergic neurons (Lemaire, 2012). The dopamine neuron lesion was assessed 14 days after 6-OHDA injection by challenge with apomorphine (0.05 mg/kg, s.c.) (Schwarting, 1996b). Those animals that made ≥150 net contraversive rotations in 1 hour were considered for recording sessions.
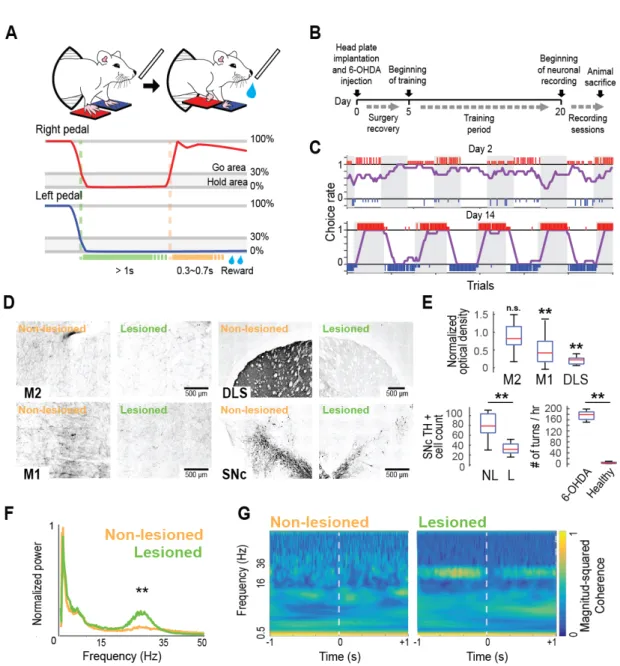
A right–left pedal task was used in a custom-made operant conditioning system (custom-made by O’hara & Co., Ltd., Tokyo, Japan) to examine the selectivity of contralateral or ipsilateral forelimb movement in the neuronal activity of the motor cortices (M1 and M2) in rats (Figure 1A, top). In this task, the rat had to manipulate the right and left pedals with the corresponding forelimb in a head-fixed condition. The rat spontaneously started each trial by pushing both pedals down and holding them for a short period (“holding period,” at least 1 s; within a holding area, 0–30% in relative pedal position). After the holding period was completed, either the right or left pedal had to be chosen without any instruction cue, and then release it to obtain 0.1% saccharin water (10 μl) as a reward (Figure 1A, bottom). This task consisted of two blocks, right pedal–rewarded and left pedal–rewarded, in which the rat had to choose the appropriate pedal depending on the context. Each block lasted until at least 30 correct trials were performed and achieved a correct performance of 80% in the last 10 trials. The reward was dispensed from the tip of a spout by a micropump with a 300–700 ms delay (100 ms steps at random). The reward delivery period was followed by a short intertrial interval (1 s). If the rat chose the incorrect pedal, they were not rewarded (error trial), and only an error sound was given (3 kHz, 300 ms). If the rat did not complete the holding period (immature trial), no feedback was given (no reward and no error sound). The rats typically learned this task within 2 weeks (training for 2–3 h a day; see Figure 1B, C).
Once the rats completed the operant learning of the right–left pedal task, they underwent a second surgery under isoflurane anesthesia, and tiny holes (1.0–1.5 mm in diameter) were made in the skull and dura mater above M1 (1.0 mm anterior, 2.5 mm lateral from bregma) and M2 (3.5 mm anterior, ± 2.4 mm lateral from bregma) (Saiki, 2018; Yoshida, 2018). The coordinates were determined by intracortical microstimulation (50–100 μA, 50
pulses at 100 Hz) to evoke reliable movements of the contralateral forelimb in preliminary experiments (data not shown). In addition, after the recordings, the coordinates were confirmed to evoke reliable movements of the contralateral forelimb by optogenetic stimulation with blue light-emitting diode (LED) light pulses (460 nm, 5–10 mW, 20 pulses at 100 Hz). To perform the optogenetic light-induced spike collision in a subset of rats (n=13) (see “Optical [optogenetic] stimulation” in Materials and Methods), additional tiny holes were made above the pontine nuclei (7.0 mm posterior, 1.0 mm lateral from bregma). All holes were immediately covered with silicone sealant (DentSilicone-V, Shofu).
Electrophysiological recording
Extracellular multineuronal (multiple isolated single-unit) recordings were performed from individual neurons in the output layer of motor cortices while the rats performed the behavioral task. All recording sessions were performed after the two weeks of training period, once the rats’ performance reached a plateau (Figure 1B). For this purpose, 32-channel silicon probes (ISO-3x-tet-A32; NeuroNexus Technologies) supported by agarose gel (2% agarose-HGT, Nacalai Tesque) were precisely inserted into M1 and M2 at depths of up to 1,250 μm deep (putative layer 5). Insertions were performed using fine micromanipulators (SM-15 and SMM-200B, Narishige) at least 1 h before the start of the recording experiment. The wide-band signals were amplified, filtered (FA64I, Multi-Channel Systems; final gain, 2000; bandpass filter, 0.5 Hz to 10 kHz) through a 32-channel head-stage (MPA32I, Multi-Channel Systems; gain, 10). The signals were digitized at 20 kHz and recorded by three 32-channel hard-disc recorders (LX-120, TEAC), which simultaneously digitized the pedal positions tracked by angle encoders and the optogenetic stimulation events. In some rats (n=7), the biceps EMG activity of both forelimbs was obtained by an amplifier with a head-stage (EX4-400, Dagan; gain, 1000;
bandpass filter, 0.3 Hz to 10 kHz). This signal was also digitized at 20 kHz and recorded using the 32-channel hard-disc recorder.
Optical (optogenetic) stimulation
In some sessions, the Multi-Linc (Multiareal/multineuronal Light-induced collision) method was performed, to effectively identify pyramidal neurons sending direct projections to specific areas by combining multiareal optogenetic stimulation and multineuronal recordings. Before insertion of the silicon probes, an optical fiber (FT400EMT, FC, Thorlabs; NA, 0.39; internal/external diameters, 400/425 μm) for stimulation was placed on the surface of either M1 or M2, and another optical fiber was vertically inserted into the pontine nuclei (9000 μm deep) using micromanipulators (SM-25A, Narishige). To evoke antidromic spikes in specific axonal projections from the IT or PT neurons of M1 or M2 (IT neurons: contralateral M1 or M2; PT neurons: ipsilateral pontine nuclei), a blue LED light pulse (intensity, 5–10 mW; duration, 0.5–2 ms, typically 1 ms) was applied through each of the two optical fibers using an ultra-high-power LED light source (UHP-Mic-LED-460, FC, Prizmatix) and a stimulator (SEN-8203, Nihon Kohden). To be classified as projecting neurons, neurons were required to meet several criteria, including constant latency, fixed frequency (frequency-following test, two pulses at 100 and 200 Hz), and collision test (Lipski, 1981; Soma, 2017; Saiki, 2018). The online collision test was, at the time, just tentative to readily accumulate spike collision data that would be sufficient for post hoc analysis, completing multineuronal collision tests (Saiki, 2018). EMG data analysis The EMG signal was rectified to calculate the onset time of muscle activity. The onset time was determined by the first of 10 consecutive 1-ms bins (10 ms) in which the EMG power
deviated by 5 SD of the mean value calculated during the baseline period (-1000 to -700 ms relative to the onset of pedal release) (Figure 2A). We determined EMG peak activity as the mean of the normalized activity in a time window of ±150 ms around the maximum EMG activity associated with pedal movement. LFP data analysis The M1 local field potential (LFP) data of a window of ± 1 s around pedal release for every correct trial was acquired. Filtering the LFP signals with a bandpass filter (0.5–100 Hz), and rectified them (Mukovski, 2007). In the first step, the power spectra of LFP signals were calculated; here, power measures the intensity of a signal as a function of its frequency. Data were transformed from time domain to the frequency domain by fast Fourier Transformation (Brillinger, 1983), at a sampling rate of 1000 Hz. Next, we calculated wavelet coherence between LFP of M1 and M2, using the MATLAB function wcoherence (The MathWorks), which measures the correlation between two signals in the time–frequency plane. Coherence ranged between 0 and 1, with 1 representing an ideal linear relationship between the signals, and 0 no linear relationship. Spike isolation Raw signal data were processed offline to isolate spike events of individual neurons in each tetrode of the silicon probes. Briefly, spike candidates were detected and clustered using the semiautomatic spike-sorting software, EToS (Takekawa, 2010; Takekawa, 2012) (http://etos.sourceforge.net/). The spike clusters were further combined, divided, and/or discarded manually to refine single-neuron clusters, based on the presence or absence of refractory periods (2 ms) in the auto-correlograms and cross-correlograms with other clusters,
using the manual clustering software Klusters and the viewing software NeuroScope (Hazan, 2006). Spike collision analysis To identify IT and PT neurons, the Multi-Linc method was used with post hoc analysis to perform multineuronal collision tests (Soma, 2017; Saiki, 2018). After offline sorting for spike isolation, the filtered tetrode (four-channel) traces that had no spikes before the stimulus were compared (see Figure 8B black, control traces) with those that had a spike in one cluster (see Figure 8B red, test traces); these analyses were performed using MATLAB. If antidromic-like (all-or-none and no-jittering) spike activities with short latency in many of the control traces were found, a time window for counting possible antidromic spikes was stablished based on clear dissociation between averaged control and test traces due to the presence or absence of spikes. The cutoff threshold, defined in a receiver operating characteristic curve for the distribution of most negative points within the time window, was used to determine whether the spikes were present; thus, we obtained spike and no-spike counts for the control and test events. According to this method, spike clusters with a control spike probability of 50% and a test spike probability less than half that of the control were used for analysis. Finally, the passing of the collision test was statistically justified by a 2 x 2 chi-squared test (p < 0.05) for spike and no-spike counts in control and test events (Saiki, 2018). The latency of antidromic spikes was defined as the time from the onset of stimulation to the median (the second quartile, 50%) of their peak positions within the time window, and their jitter was defined as the time between the first (25%) and third (75%) quartiles of their peak positions within the time window. In this manner, we judged these spikes to be antidromic or not based on the collisional disappearance of antidromic spikes (collision test), as well as their all-or-none
properties, absence of jitters (constant latency test: 0.5 ms), and high reliability (frequency-following test, if applicable in the tentative collision test).
Analysis of neuronal activity
In each neuron (spike cluster), basal spiking properties and functional activity in relation to behavioral task performance were analyzed using MATLAB, as follows. All spikes occurring for 1 s after optical stimulation were excluded from spike data for subsequent analyses. Ongoing activity was defined as the average firing rate excluding the activity during a time window of -1 to +0.5 seconds around pedal movement. Spike duration was the time from spike onset to the first positive peak, and the spike width refers to the elapsed time above the half-amplitude of the positive spike waveform. Peak activity was the average firing rate during fifteen 20-ms bins centered at the maximum spike rate. Spike clusters other than identified IT and PT neurons were classified as regular-spiking (RS) and fast-spiking (FS) neurons based on spike duration (> 0.6 ms for RS neurons) (Isomura, 2009; Saiki, 2018). As expected, all IT and PT neurons satisfied the criteria for RS neurons (IT neurons: 1.01 ± 0.13 ms, 0.7–1.25 ms, PT neurons: 1.04 ± 0.15 ms, 0.7–1.25 ms). We compared the lesioned hemisphere with the vehicle injected hemisphere in the same hemiparkinsonian rat according to previous studies (Lemaire, 2012; Hernandez, 2013). Additionally, previously acquired data from 16 healthy Long–Evans male rats was used for comparison (Soma, 2017). Because the different groups of neurons (RS vs FS, IT vs PT, and M1 vs M2) under different conditions (healthy [H], non-lesioned side [NL], and 6-OHDA lesioned side [L] in hemiparkinsonian rats), for simplicity we use abbreviated expressions to refer to each group: for example, a RS neuron in M1 in the lesioned hemisphere is referred as M1-RS-L.
performance of forelimb movements was examined. To interpret the relationship between functional activity and right–left forelimb control, we primarily focused on neuronal activity recorded during unilateral (contralateral and ipsilateral) forelimb movements (excluding bilateral movements). Thus, spike trains obtained only from unilateral forelimb movement trials were aligned with the onset (0 ms) of pedal release (following the 1-s holding time) during task performance (≧20 trials with total ≧250 spikes). A pedal-release event was
detected when the pedal was released outside of the holding area (30% in relative pedal position), and the onset of pedal release was defined as the nearest time point at which the pedal position exceeded 5% of the value prior to the pedal release event. To define ''task-related'' activity, the cumulative distribution of all spike positions in the time course of each trial was compared with the distribution of the same number of uniformly distributed spike positions using the Kolmogorov–Smirnov (KS) test, using the p value as the task relevance index, where p < 10−6 was judged as ''task-related'' under our analytical conditions (Saiki, 2014;
Kimura, 2017; Soma, 2017). A neuron was defined as task-related if it had a smaller task relevance index (p < 10-6) in either a contralateral or ipsilateral trial; task-related neurons were
further classified into three categories on the basis of the task relevance index: contralateral (contralateral, p < 10-6; ipsilateral, p > 10-6), ipsilateral (contralateral, p > 10-6; ipsilateral, p <
10-6), and bilateral (contralateral, p < 10-6; ipsilateral, p < 10-6).
Furthermore, the task-related neurons were classified as Go-type and Hold-type based on their preferred activities (either contralateral or ipsilateral trials) with the smaller task relevance indices. First, the neurons that exhibited their peak-activity timings in the peri-event time histograms (PETHs; 20 ms bins) after onset of pedal release were classified as post-movement neurons. Neurons exhibiting their peak-activity timings before pedal-release onset
were further divided into two groups according to the dependence of premovement activity on holding time (Soma, 2017, 2019). Each time point crossing the 75% level of the peak spike activity were measured in all trials for each of the PETHs obtained from different holding time trials (1.0–1.5, 1.5–2.0, 2.0–2.5, and 2.5–3.0 s) and estimated the slope from the plot of cross points vs. holding times. Neurons with slopes < 0.5 were classified as hold-related neurons (Hold-type), and those with slopes > 0.5 were grouped together with the post-movements neurons. These latter two groups exhibited a uniform peak activity distribution and were classified as Go-type neurons. To evaluate the degree of lateralized activity for each neuron, we compared the peak activities (peak firing rate during -1000 to +500 ms relative to the onset of pedal release) for Go-type, between contralateral and ipsilateral trials. In addition, we confirmed the laterality based on normalized peak activities for Go-type neurons, as follows: 𝐿𝑎𝑡𝑒𝑟𝑎𝑙𝑖𝑡𝑦 𝑖𝑛𝑑𝑒𝑥 = (𝑐 − 𝑖)/(𝑐 + 𝑖), 𝑖𝑓 𝑐 > 0 𝑎𝑛𝑑 𝑖 > 0 +1, 𝑖𝑓 𝑐 > 0 𝑎𝑛𝑑 𝑖 < 0 −1, 𝑖𝑓 𝑐 < 0 𝑎𝑛𝑑 𝑖 > 0
where c and 𝑖 are the activities associated with contralateral and ipsilateral movements, respectively (Soma, 2017, 2019). These parameters were obtained from the following equation:
𝑐, 𝑖 = 𝐹𝑅<=>? 𝐹𝑅@>A=BCD=− 1
where FRpeak is the mean firing rate of the peak period (peak ± 150 ms), and FRbaseline is the mean firing rate during the baseline period (-1000 to -700 ms relative to the onset of pedal release). The laterality index ranged from -1 to +1, indicating ipsilateral and contralateral movement–related activity, respectively.
Histological observations
After recording experiments were completed, animals were deeply anesthetized with urethane (2–3 g/kg, i.p.; Nacalai Tesque) and perfused transcardially with cold saline followed by 4% formaldehyde in 0.1 mol/L phosphate buffer. Whole brains were postfixed and sliced coronally into 50-μm serial sections using a microslicer (VT1000S, Leica). The sections were Nissl-stained with Neutral Red (Nacalai Tesque) or performed immunostaining for tyrosine hydroxylase (TH). Optical fiber, electrode tracks and TH staining were observed in the motor cortices, DLS, SNc and pontine nuclei under a microscope (BX51N or IX83P2ZF, Olympus). Tyrosine hydroxylase staining After washing in PBS, sections were preincubated in blocking serum (5% normal swine serum in PBS) for 60 min, and then incubated with rabbit anti-rat TH (Abcam, Tokyo, Japan) diluted 1:400 in PBS + 0.3% TritonX-100. Between incubation steps, washes were performed in PBS. After incubation with biotinylated donkey anti-rabbit IgG (Abcam, Tokyo, Japan; 1:100), peroxidase was visualized using the ABC Immunoperoxidase kit (Vector Laboratories; 1:200) with 3,3’- diaminobenzidine tetrahydrochloride dihydrate (Sigma, St. Louis, MO; 0.5 mg/ml) as the chromogen. Contrast was intensified with 1% nickel ammonium sulfate (Nacalai Tesque). Sections were dehydrated, cleared, and mounted on slides with Entellan (R) new (MERCK) for microscopy. Quantification of TH was performed in 6 rats using ImageJ 1.51 s by calculating optical density (Nonomura, 2018), using 4 continuous sections spanning each of the next areas: M1(AP +1mm), M2 (AP +3.5mm), DLS (AP +0.2mm). All values of axon density were normalized against that of the non-lesioned hemisphere and averaged for each hemisphere. In addition, we quantified the TH+ cells in the SNc using four separate sections through the mesencephalon for each rat, between 5.0 and 5.5 mm posterior from bregma (Metz, 2004).
The medial terminal nucleus was used to differentiate between the SNc and the VTA. Where this was not possible, SNc boundaries were established according to the stereotaxic atlas of Paxinos and Watson (Paxinos, 2007). TH+ SNc cell counts from each of the four sections for each rat, performed manually with the aid of the cell counter plugin to ImageJ, were separately averaged for each hemisphere and used for statistical analysis. TH+ neurons were identified and defined as densely stained cell bodies visible on the sections. Experimental design and statistical analyses In this study, 18 adult male W-TChR2V4 Long–Evans rats were used to investigate the effect of a 6-OHDA lesion on the selectivity for contra- or ipsilateral forelimb movement representations of M1 and M2 neurons. For comparison, previous recordings from healthy rats were also used (16 adult W-TChR2V4 Long–Evans male rats) (Soma, 2017). W-TChR2V4 rats express ChR2-Venus in neurons ubiquitously throughout the brain (Saiki, 2018), which is useful for optogenetically evoked spike collision tests to identify IT and PT neurons, as described above. For the neuronal analysis, the neuronal activity from healthy rats and hemiparkinsonian rats under task performance was compared: healthy rats (834 M1 neurons and 1,316 M2 neurons), non-lesioned hemisphere in hemiparkinsonian rats (3,174 M1 neurons and 3,144 M2 neurons), and lesioned hemisphere in hemiparkinsonian rats (3,578 M1 neurons and 3,771 M2 neurons). These neurons were further divided into subclasses: RS and FS neurons, task-related and non–task-M2 neurons). These neurons were further divided into subclasses: RS and FS neurons, task-related neurons, IT and PT neurons. They were compared using appropriate statistical tests (i.e., unpaired t-test, Mann–Whitney test, Wilcoxon signed-rank test, chi-squared tests, KS test, Kruskal-Wallis with Dunn’s post–hoc test, and ANOVA with Tukey-Kramer post–hoc test). These statistical tests were conducted using MATLAB’s Statistics and Machine Learning Toolbox. Differences were considered statistically significant when p <
0.05 (see Results). Unless otherwise noted, data in the text and figures are given as means ± SD (unless otherwise noted) and sample number (n).
4. Results 6-OHDA partial lesion To develop a hemiparkinsonian rat model suited for the study of motor cortex activity during contralateral and ipsilateral forelimb movements, a partial lesion was performed in the dopaminergic system injecting 6-OHDA directly into the right DLS. This lesion was evident two weeks later as a decrease in TH staining around the injection area corresponding to the DLS. Also, the degree of dopamine depletion was quantified, comparing the TH staining optical density between the lesioned and non-lesioned hemisphere in M1, M2 and DLS, and the number of TH+ cells in the SNc (Figure 1D). The optical density in M2 was similar between the lesioned and the non-lesioned hemisphere (t=1.56, p=0.2, unpaired t-test). In M1, we found a decrease in the optical density (47% relative to the non-lesioned hemisphere; t=4.27, p=2.7 x 10⁻³, unpaired t-test). The highest reduction in the TH optical density was observed in the DLS, around the injection site (20% relative to the non-lesioned hemisphere; t=13.82, p=2.6 x 10⁻⁸, unpaired t-test) (Figure 1E, top). Also, a decrease of the number of TH+ cells in the SNc was observed (non-lesioned: 79.6 ± 26 cells; lesioned: 34.68 ± 11.34 cells; t=6.01, p=2.37 x 10⁻⁵, unpaired t-test) (Figure 1E, bottom left). Thus, even with a local DLS 6-OHDA injection, the dopamine depletion was not limited to the injection site, but also was found in M1, along with an important loss of TH+ cells in the SNc. The rotational behavior induced by injection of 0.05 m/kg apomorphine s.c. was evident, with at least 150 contralateral turns in 1 hour in all recorded rats (n=18), higher than in healthy rats (n=5) (t=19.75, p=4.8 x 10⁻¹⁵, unpaired t-test) (Figure 1E, bottom right). Furthermore, M1 LFP recordings in the lesioned hemisphere exhibited two characteristic changes of the parkinsonian state: an increase in beta-band power relative to the non-lesioned hemisphere (Total power [mV2 x 10-3] 15–35 Hz; non-lesioned:
0.54 ± 0.2, lesioned: 1.02 ± 0.2; z=4.12, p=3.7 x 10⁻⁵, Wilcoxon signed-rank test) (Figure 1E),
and an increase in the coherence of the beta frequency between M1 and M2 (Figure 1G) (Silberstein, 2005; Degos, 2009). These results confirm that the consequences of the partial dopaminergic lesion resembled the behavioral and electrophysiological changes associated with the parkinsonian state, but were milder.
Behavioral changes produced by the partial unilateral 6-OHDA lesion
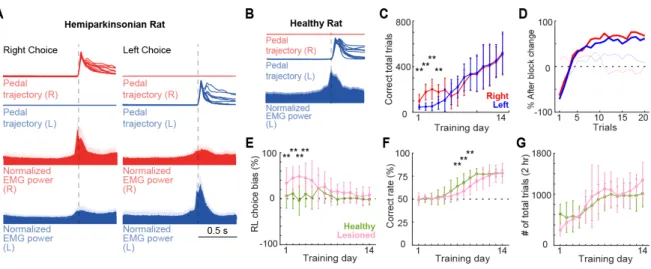
The right–left pedal task was used to examine the laterality of forelimb movement representation in motor cortex (Figure 1A). In this task, the holding area corresponded to the 30% of the total pedal movement range. Even if the rat moved their forelimb within the holding area, this time was also included in the holding period. These subtle movements during the holding period were similar in both forelimbs, and were much smaller than the movement required to pass out the holding area (right, 0.9 ± 1.2%; left, 1.0 ± 1.1%), indicating that the rats stably pushed both pedals during the holding period. In some rats (n=7, 18 sessions), we recorded the EMG activity of both upper forelimbs simultaneously during the recording sessions. There was no significant difference between the peak right and left forelimb EMG activity during the corresponding forelimb movements (change in EMG between
pre- and post-movements: right choice/right-EMG: 45.4 ± 15.4%, left choice/left-EMG: 56.4 ± 17.2%, z=1.02, p=0.3, Wilcoxon rank-sum test) (Figure 2A). The slight muscle activity of the opposite forelimb was not associated with a significant pedal movement, and was similar during right and left unilateral movements. This was confirmed in all rats examined (change in EMG between pre- and post-movements: left choice/right-EMG: 10.3 ± 3.8%; right choice/left-EMG: 8.4 ± 3.1%; z=0.56, p=0.5, Wilcoxon rank-sum test). The mean onset time of forelimb movement, relative to the onset of pedal release, was -232 ms on the right forelimb and -258
ms on the left forelimb, indicating that the muscles became active just before the onset of pedal release. In addition, we recorded the EMG activity of left forelimb in 6 healthy rats, in which the left muscles exhibited changes in activity only during left choice but not during right choice (change in EMG between pre- and post-movements: right pedal release, 4.4 ± 8.4%, left pedal release, 40.2 ± 14.7%), suggesting that the rats executed the pedal release using forelimb movement only on the required side (Figure 2B).
To evaluate the effect of partial dopamine depletion in task performance, the performance of the affected forelimb (left forelimb, contralateral to the lesion) was compared with that of the spared forelimb (right forelimb, ipsilateral to the lesion) in the hemiparkinsonian rat. Population data revealed a preference for the right pedal movement (spared forelimb) in the initial 4 days of the training (F=15.5, p=9.90 x 10⁻⁵; day 1: p=3.4 x 10⁻⁸; day 2: p=1.9 x 10⁻¹⁰; day 3: p=1.1 x 10⁻⁸; day 4: p=2.5 x 10⁻⁴; two-way ANOVA, Tukey-Kramer
post-hoc test). However, at the end of the learning period; there were similar numbers of correct trials for both forelimbs (day 14: right, 505.6 ± 179; left, 519.1 ± 183; p=0.8) (Figure 2C).
Also, when the block changed, the rats learned to properly change their choice within an average of five trials, with no pedal bias (number of trials after block change to achieve a 50% correct response: 5 ± 1 trials) (Figure 2D).
Next, the hemiparkinsonian and healthy rats’ performances were compared, specifically right or left preference, total rate of correct response, and number of total trials. Two-way ANOVA analysis showed significant main effects of lesion (F=58.62, p=2 x 10-13), time (F= 3.96, p=4.93 x 10⁻⁶), and interaction between time and lesion (F=2.91, p=4.8 x 10⁻⁴). Post hoc analyses revealed that in the early days of the learning period the lesioned rats presented a right movement preference (contralateral to the non-lesioned hemisphere) (day 1: p=7.4 x 10
-5; day 2: p=4.3 x 10⁻⁷; day 3: p= 3.3 x 10⁻⁶; day 4: p=2.1 x 10⁻⁴; two-way ANOVA, Tukey-Kramer
post-hoc test). After 2 weeks this right-movement bias disappeared, and the lesioned rats’ performance became similar to those of the healthy rats (day 14: Healthy, -2.0 ± 11.4%; Lesioned, 8.1 ± 16.7%; p=0.1) (Figure 2E). In the total correct rate, there was a significant main effects of lesion (F=15.51, p=9.9 x 10⁻⁵, two-way ANOVA) and time (F= 64.7, p=3.2 x 10-83 , two-way ANOVA). The total rate of correct responses in the lesioned rats was below that of the healthy rats in the middle of the learning period (day 7: p=9 x 10⁻⁴; day 8: p=1.1 x 10⁻⁴; day 9: p=6.5 x 10⁻⁵; two-way ANOVA, Tukey-Kramer post-hoc test), but became similar after two
weeks (day 14: Healthy, 78.4 ± 3.5; Lesion, 78.4 ± 10.8%; p=0.9) (Figure 2F). The total number of trials did not differ significantly between the two groups during the learning period (F= 0.03, p=0.8, two-way ANOVA) (Figure 2G). These results show that the partial dopaminergic lesion used in this study produced a subtle motor imbalance that allowed the rats to correctly perform the task in a similar manner to the healthy animals, executing the pedal release using forelimb movement only on the required side; moreover, after 2 weeks of training, performance was similar in both forelimbs.
Functional activity of M1 and M2 neurons
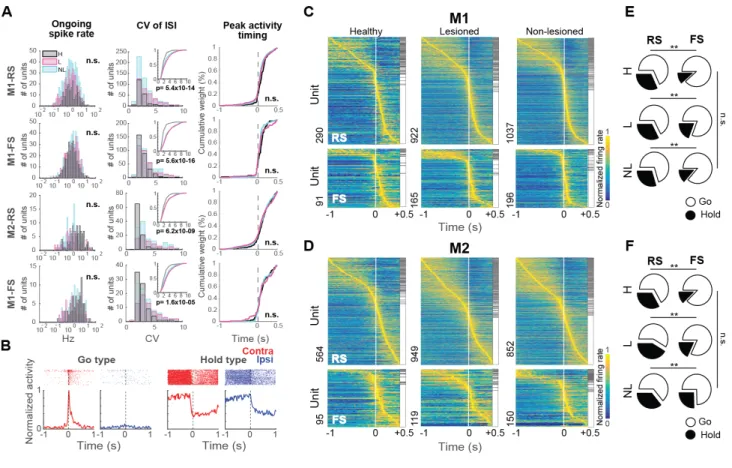
The extracellular multineuronal activity was recorded from the deep layers (putative layer 5) of M1 and M2 and compared the activity under three conditions: healthy rat (H), non-lesioned side in hemiparkinsonian (NL), and 6-OHDA lesioned side in the hemiparkinsonian rat (L), while they performed alternated unilateral forelimb movements. A total of 7,568 M1 neurons (M1-H, 834; M1-L, 3,578; M1-NL, 3,174) and 8,231 M2 neurons (M2-H 1,316; M2-L, 3,771; M2-NL, 3,144) were isolated during task performance. The neurons were classified as RS or FS neurons based on spike duration (Figure 3A), which was consistent with previous
reports (Isomura, 2009; Saiki, 2014, 2018; Soma, 2017). First, some spiking properties of these neurons were examined. No difference was found in the ongoing spike rate in M1 or M2 among the three conditions (M1-RS-H: 3.4 ± 3.8 Hz, M1-RS-L: 2.9 ± 3.5 Hz, M1-RS-NL: 3.8 ± 3.6 Hz, c2= 0.15, p= 0.2; M1-FS-H: 7.8 ± 10.3 Hz, M1-FS-L: 7.2 ± 10.6 Hz, M1-FS-NL: 4.8 ± 6.3 Hz, c2= 5.86, p= 0.053; M2-RS-H: 3.1 ± 3.9 Hz, M2-RS-L: 3.4 ± 3.3 Hz, M2-RS-NL: 3.5 ± 3.5 Hz, c2= 4.8, p= 0.1; M2-FS-H: 7.2 ± 6.7 Hz, M2-FS-L: 5.4 ± 6.3 Hz, M2-FS-NL: 6.2 ± 7.0 Hz, c2= 5.81, p= 0.054; Kruskal-Wallis test) (Figure 3A, left). Next, the CV of ISI was compared to evaluate the spiking regularity. The CV was higher in the non-lesioned and lesioned hemisphere in RS and FS neurons in M1 and M2, compared to the healthy condition (M1-RS: c2= 61.09, p= 5.4 x 10⁻¹⁴; M1-FS: c2= 70.2, p= 5.6 x 10⁻¹⁶; M2-RS: c2= 37.7, p= 6.2 x 10⁻⁹; M2-FS: c2= 22.08, p= 1.6 x 10⁻⁵; Kruskal-Wallis test, Dunn’s post-hoc test) (Figure 3A, middle). Additionally, the peak activity timing of the preferred activity was evaluated. There was not statistical difference in either population or condition (M1-RS: p= 0.54; M1-FS: p= 0.7; M2-RS: p= 0.2; M2-FS: p= 0.9; Kruskal-Wallis test) (Figure 3A, right). These results did not show the expected hypoactivity or delayed peak activity suggested by some hypothetical changes in parkinsonism. However, a higher irregularity in the spiking activity was found in the parkinsonian rats, in agreement to previous reports (Pasquereau, 2016).
Furthermore, we analyzed the activity of M1 and M2 neurons during forelimb movements. First, the spike data was aligned to the onset of the right or left pedal release and defined the task-related neurons using the task relevance index. Next, the task-related neurons were divided as Go-type if they exhibited a phasic activity increase around movement, and Hold-type neurons if they exhibited a sustained activity before the pedal release (Figure 3B, see Methods).
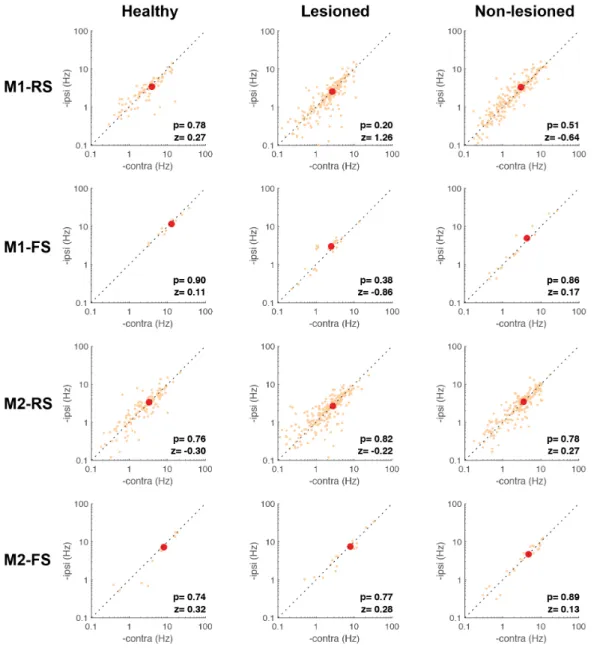
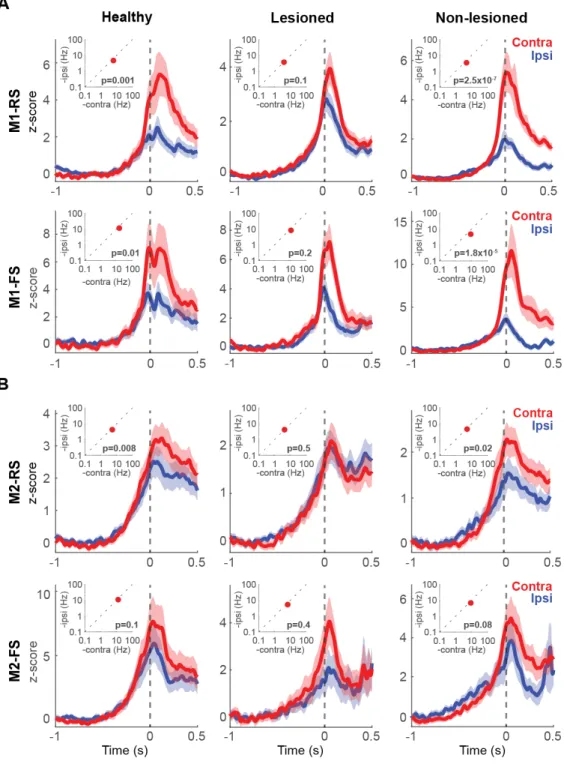
Figures 3C and D show the preferred activity (lower task relevance index during contralateral or ipsilateral movements) sorted by peak position, differentiated by functional activity type. The RS neurons exhibited a higher proportion of Hold-type neurons relative to FS neurons in all instances (M1-H: c2=13.52, p=1 x 10⁻³; M2-H: c2=12.94, p=1 x 10⁻³; M1-NL: c2=19.75, p=5.14 x 10⁻⁵; M2-NL: c2=9.66, p=9 x 10⁻³; M1-L: c2=14.40, p=7.4 x 10⁻⁴; M2-L: c2=20.08, p=4.4 x 10⁻⁵; 2 x 2 chi-squared test for Hold:Go ratio between RS and FS; Figure 3E, F). The 6-OHDA injection did not modify the proportion of these neurons in either condition (M1-RS: c2=2.58, p=0.3; M1-FS: c2=2.39, p=0.3; M2-RS: c2=3.97, p=0.13; M2-FS: c2=5.13, p=0.1, chi-squared test). Effect of the 6-OHDA lesion in lateralized activity in M1 and M2 To analyze the selectivity of neuronal activity for the contralateral or ipsilateral forelimb movement, and evaluate the effect of the partial dopaminergic lesion, the pre-movement activity (for Hold-type neurons), or the peak activity around pedal movements (for Go-type neurons), was first compared between contralateral and ipsilateral movements. Figure 3B shows examples of functional activities obtained from contralateral (red) and ipsilateral (blue) movement trials. For Hold-type neurons, we compared the mean firing rate before contralateral and ipsilateral forelimb movements (-1 to 0 seconds, relatively to movement onset) and after movement onset (0 to 0.5 seconds). No difference was found in the activity between contralateral and ipsilateral movements in any condition (Figure 4, 5). Therefore, for the study of the lateralized activity, we focused only on the phasic activity of the Go-type neurons (Figure 6, insets). In the healthy condition there was a higher activity during contralateral movements in M1-RS (z=3.26, p=1x10⁻³), M1-FS (z=2.36, p=0.01) and M2-RS
rank-sum test). In the lesioned hemisphere, this higher peak activity during contralateral movements was lost in all instances, M1-RS (z=1.62, p=0.1), M1-FS (z=1.26, p=0.2), M2-RS (z=- 0.63, p=0.5) and M2-FS (z=0.7, p=0.4; Wilcoxon rank-sum test). On the other hand, in the non-lesioned hemisphere, the difference in the peak activity during contralateral and ipsilateral movements was higher in M1-RS (z=5.15, p=2.5x10⁻⁷) and M1-FS (z=4.28, p=1.8x10⁻⁵), but not in M2-RS (z=2.25, p=0.02) or M2-FS (z=1.71, p=0.08; Wilcoxon rank-sum test). These results show that the different functional type neurons, Hold- and Go-type, also differed in the preferred activity during contralateral movements. In addition, the 6-OHDA injection modified this preference in the Go-type neurons, particularly in M1. Moreover, in order to qualitatively depict the selectivity of each neuron in M1 and M2, the spike activities were normalized and averaged (Figure 6). In the healthy condition, the PETHs exhibited a preferred activation during contralateral movements in RS and FS, in both M1 and M2 (Figure 6, left column). On the lesioned side, the difference in activity between contralateral and ipsilateral movements was reduced (Figure 6, middle column). In the non-lesioned side in the parkinsonian rats the difference was strengthened, mainly in M1, where there was a notable preferred activation during contralateral movements (Figure 6, right column). These results are in agreement with the peak activity changes produced in the parkinsonian state.
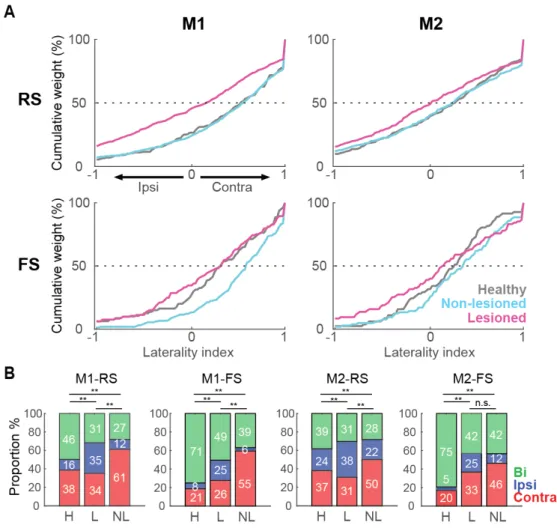
Further, the laterality index based on the normalized phasic activity during contralateral or ipsilateral movement was used to quantify the limb specificity. Figure 7A shows the distribution of the laterality index in the healthy, non-lesioned and lesioned conditions. A laterality index near +1 indicates preferred activity during contralateral movements, and an index near -1 indicates a preference for ipsilateral movements. In M1-RS neurons, the bias in
the laterality index for a contralateral preference was similar in the healthy and non-lesioned conditions, whereas there was a leftward shift in the distribution in the lesioned hemisphere, showing a decrease in the contralateral preference (H: 0.38 ± 0.04, NL: 0.38 ± 0.02, L: 0.05 ± 0.02, F=44.27, p=2 x 10-19; H vs NL: p=0.9; H vs L: p=9.1 x 10⁻⁹; NL vs L: p=9.6 x 10⁻¹⁰; one-way ANOVA, Tukey-Kramer post-hoc test). This decrease in the contralateral bias in the lesioned hemisphere was also present in the M2-RS population, but the difference among the three conditions was minor relative to M1-RS (H: 0.16 ± 0.03, NL: 0.16 ± 0.03, L: 0.02 ± 0.03, F=6.22, p=2 x 10⁻³; H vs NL: p=0.9; H vs L: p= 0.01; NL vs L: p= 5 x 10⁻³; one-way ANOVA, Tukey-Kramer post-hoc test). By contrast, in the M1-FS neurons, the non-lesioned hemisphere exhibited the greatest contralateral preference (H: 0.28 ± 0.06, NL: 0.50 ± 0.03, L: 0.20 ± 0.05, F=11.71, p=1.2 x 10⁻⁵; H vs NL: p=8 x 10⁻³; H vs L: p=0.6; NL vs L: p=9.3 x 10⁻⁶; one-way ANOVA, Tukey-Kramer post-hoc test); whereas the M2-FS population exhibited no difference under either condition (H: 0.21 ± 0.05, NL: 0.29 ± 0.05, L: 0.12 ± 0.06, F=2.33, p=0.09, one-way ANOVA). Additionally, the RS and FS neurons were divided into three categories according to the task relevance index (Figure 7B, contralateral, red; ipsilateral, blue; bilateral, green). In accord with the laterality index, a larger proportion of neurons was selective for ipsilateral movements in the lesioned hemisphere in both M1 and M2 (M1-RS: c2=167.1; p=4.4 x 10⁻³⁵, M1-FS: c2=70.4; p=1.9 x 10⁻¹⁴, M2-RS: c2=64.68; p=3 x 10-13, M2-FS: c2=39.52; p=5.4 x 10⁻⁸ , chi-squared test). These results demonstrate that the main effect of the partial 6-OHDA lesion was to decrease the contralateral preferred activation of both M1-RS and M2-RS, whereas M1-FS neurons in the non-lesioned hemisphere exhibited the opposite effect. Motor laterality in identified IT and PT neurons Next, the limb specificity of the identified IT and PT projection neurons was investigated.
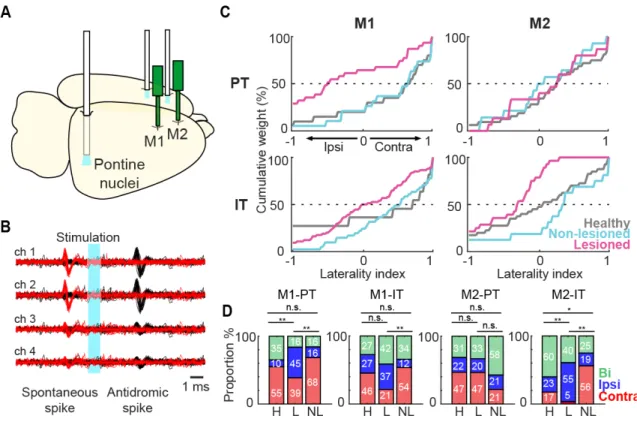
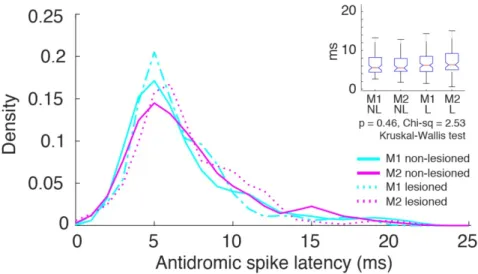
To identify these types of projection neurons, the collision test was performed using the Multi-Linc method (Soma, 2017; Saiki, 2018). Optical stimulation we performed in the contralateral motor cortex to identify IT neurons, and in the ipsilateral pontine nuclei to identify PT neurons (Figure 8A). Figure 8B shows the antidromically evoked spike and the successful collision test, in which the antidromic spike disappeared if the stimulation was triggered by the spontaneous spike. In M1 and M2, latency was shorter in PT neurons than in IT neurons (M1-PT-NL: 6.90 ± 3.80 m, M1-IT-NL: 11.68 ± 5.40 ms, z=7.57, p=3.7 x 10⁻¹⁴; M1-PT-L: 7.62 ± 4.66 ms, M1-IT-L: 11.44 ± 4.99 ms, z=5.79, p=6.6 x 10⁻⁹; M2-PT-NL: 7.16 ± 3.74 ms, M2-IT-NL: 12.31 ± 5.31ms, z=9.12, p=6.9 x 10⁻²⁰; M2-PT-L: 7.10 ± 3.33 ms, M2-IT-L: 10.89 ± 4.78 ms, z=6.41, p=1.4 x 10⁻¹⁰; Wilcoxon rank-sum test). The antidromic spike latency histogram of the identified PT neurons showed a unimodal distribution (Figure 9). Additionally, there was no difference in the latency of any population in the lesioned vs. non-lesioned hemisphere, suggesting that the conduction velocity remained intact after the 6-OHDA lesion (M1-NL-PT=6.9 ± 3.8ms; M1-L-PT=7.1 ± 3.7ms; M2-NL-PT=6.5 ± 3.1ms; M2-L-PT=7.1 ± 3.3ms; c2= 2.53, p= 0.46; M1-NL-IT=11.6 ±
2.7ms; M1-L-IT=12.3 ± 5.3ms; M2-NL-IT=11.4 ± 4.99ms; M2-L-IT=10.8 ± 4.7ms; c2= 7.03, p=
0.1; Kruskal-Wallis test) (Figure 9, inset). There was no significant difference in the proportion of functional activity between IT and PT in M1 and M2, and dopamine depletion had no effect on this proportion.
As with the RS and FS neurons, the limb specificity of Go-type neurons using the normalized laterality indices was evaluated in the identified PT and IT neurons (Figure 8C). Similar to the unidentified RS and FS neurons, the lesioned state was associated with a reduction in contralateral preference in both types of projection neurons. However, we observed a differential effect of the 6-OHDA lesion on the distribution of the laterality index,
depending on the recorded area. In the case of M1-PT neurons, the non-lesioned hemisphere neurons kept the contralateral bias similar to the healthy condition, whereas on the lesioned side there was a significant decrease in the contralateral bias (H: 0.40 ± 0.14 (n=20), NL: 0.30 ± 0.17 (n=19), L: -0.28 ± 0.14 (n=31), F=6.32, p=3 x 10⁻³; H vs NL: p=0.9; H vs L: p=6 x 10⁻³; NL vs L: p=0.02; one-way ANOVA, Tukey-Kramer post-hoc test). On the other hand, the M1-IT neurons did not exhibit significant difference in the laterality index under any of the three conditions (H: 0.24 ± 0.26 (n=11), NL: 0.35 ± 0.10 (n=41), L: 0.04 ± 0.07 (n=75), F=2.82, p=0.1; one-way ANOVA) (Figure 8C, left column). In contrast to M1, the M2-PT neurons did not exhibit any difference in the laterality index (H: 0.25 ± 0.10 (n=32), NL: -0.03 ± 0.19 (n=14), L: 0.03 ± 0.19 (n=15), F=1.09, p=0.34; one-way ANOVA), whereas in the M2-IT neurons there was a significant difference in the laterality index in the lesioned side neurons relative to the healthy and non-lesioned conditions (H: 0.01 ± 0.11 (n=40), NL: 0.15 ± 0.20 (n=16), L: -0.44 ± 0.09 (n=28), F=5.54, p=5 x 10⁻³; H vs NL: p=0.9; H vs L: p=0.02; NL vs L: p=0.01; one-way ANOVA,
Tukey-Kramer post-hoc test) (Figure 8C, right column). Also, the IT and PT neurons were categorized according to the task relevance index (Figure 8D, contralateral, ipsilateral and bilateral). A smaller proportion of neurons selective for contralateral movements was found in the lesioned hemisphere in M1-PT, M1-IT, M2-IT, but there was no difference in this proportion in the M2-PT population (M1-PT: c2=11.27, p=0.02, M1-IT: c2=15.28, p=4 x 10⁻³, M2-PT: c2=3.54, p=0.47, M2-IT: c2=24.91, p=5.2 x 10⁻⁵, chi-squared test). These changes in the laterality index found in the lesioned hemisphere revealed a differential effect of dopamine depletion in the RS population, depending on the motor area. The decrease in the PT contralateral preference was specific to M1, but this population was not affected in M2. On the other hand, IT neurons were the only population affected in M2.
5. Discussion
In this study, it was characterized how different types of neurons in the M1 and M2 areas represent remodeling of lateralized movement representation in the parkinsonian state. Specifically, the effect of partial dopamine depletion on the forelimb selectivity of the motor cortex was investigated; recorded the neuronal activity from the output layer of M1 and M2, differentiating between RS and FS neurons; and identified the IT and PT neurons using the Multi-Linc method. The neuronal activity in rats performing the right–left pedal task was performed under three different conditions: healthy rats, non-lesioned hemisphere, and 6-OHDA lesioned hemisphere in hemiparkinsonian rats. The main finding of this study is that the partial dopamine depletion decreased the characteristic contralateral lateralized activity of the motor cortex. This effect was observed in the RS neurons of M1 and M2. clearly observed in this population. The non-lesioned hemisphere had the opposite effect, increasing the contralateral preference, particularly in the M1-FS neurons, indicating a possible pathological or compensatory change in the hemisphere contralateral to the lesion. In addition, a contrasting effect of the 6-OHDA lesion effect was observed in the PT and IT neuron activity of M1 and M2. In M1, only the PT neurons decreased their contralateral preference, whereas in M2, the affected population was the IT. Partial dopaminergic depletion and task performance In this study a partial hemiparkinsonian rat model was produced injecting 6-OHDA into the right DLS. The rats exhibited rotational behavior after apomorphine injection, with at least 150 contralateral turns per hour. This rotational behavior has been used as a reliable method for demonstrating motor imbalance in PD rat models (Bankiewicz, 2004). It has been detected rotational behavior in partial lesioned animals with cell loss as low as 40% (Truong 2006). Also,
the loss of TH staining in motor cortex and striatum was evident around three weeks after the 6-OHDA injection, where the TH staining was practically completely lost around the injection side, with a smaller, but significant decrease in M1. The loss of TH+ cells in the ipsilateral SNc was around 60%, similar to previous studies using partial lesions. Also, fast-scan cyclic voltammetry demonstrated that the localized striatum 6-OHDA lesions reduced evoked dopamine release by about 75% relative to the contralateral striatum (Amalric, 1987; Lemaire, 2012). However, even with this important reduction in the TH+ cells, the rats did not exhibit overt parkinsonian symptoms. Compensatory mechanisms in the SNc (such as acceleration of DA turnover or receptor hypersensitivity), or broader changes in the cortico-BG network, may explain why clinical signs of parkinsonism emerge only after a massive degeneration of DA neurons (Melamed, 1982). In PD patients and PD monkey models, the loss of dopamine is predominantly observed in the posterior putamen, a region of the BG associated with the control of habitual behavior (Hornykiewicz, 1998; Kish, 1988; Brooks, 1990; Redgrave, 2010). Thus, partial dorsal striatum lesions may resemble this dopamine loss pattern. However, it is important to mention that this kind of lesion also affects the direct dopaminergic input to the motor cortex (Guo, 2015), which was evident in our study with the reduction of TH staining in M1. Therefore, the changes observed in motor cortex activity could be produced by a direct effect of the loss of dopamine in the cortex or by greater dysregulation of the cortico-BG circuit. In any case, we observed an increase in the beta-frequency power in the cortical LFP, and increased coherence between cortical regions, which is characteristic of the parkinsonian state. Somatosensory striatum 6-OHDA lesion similar to the used in this study produced amplified oscillations across beta and low gamma frequencies in the dopamine depleted regions during a T-maze task, which was normalized by L-DOPA treatment (Silberstein, 2005; Mallet, 2008; Stoffers, 2008; Lemaire, 2012). Lesions in the dorsal striatum may resemble presymptomatic
or mild stages of PD, in which early neuronal changes have already occurred, but the overt symptomatology may not still be present.
The study of PD in animal models is usually performed under a complete dopamine depletion in one or both hemispheres (Emborg, 2007; Magill, 2001; Mallet, 2008). This limits the assessment of movement-related activity due to the reluctance of the animals to move (Leblois, 2006). Likewise, under operant conditions, a more extensive striatal activity disruption may affect the velocity and number of movements (Panigrahi, 2015), or the motivational and motor processing (Hori, 2019). However, the partial DLS lesion used in this work permitted the rat to perform skillful forelimb movements after training, and allowed the study of brain activity during task performance under similar forelimb movement conditions. Consistent with our results, partial dopamine depletion does not impede learning of other tasks (Molina-Luna, 2009; Lemaire, 2012). In the right-left pedal task, under healthy conditions, the rats exhibited a preference for either right or left movements in the early training period, which disappeared along with the training progress. In the lesioned rats, the preference for movement of the right forelimb (contralateral to the non-lesioned hemisphere) was consistent across all rats. However, the performance of the lesioned rats was similar in both forelimbs after 2 weeks of training, and similar to that of the healthy rats. This correction may be a consequence of the training itself, or instead the result of compensatory changes from the non-lesioned hemisphere (Remple, 2001). This partially lesioned hemiparkinsonian model under task performance may be useful in future studies of movement-related activity in mild parkinsonism. However, previous studies show that skilled reach training was not necessary for the display of a normal motor map, as has been reported after other form of injuries in animals (Metz, 2004; Friel, 2000).
Decreased limb specificity in M1 and M2 in parkinsonian state
Selectivity during ipsilateral or contralateral movements suggests diversity in the degree of lateralization between the motor cortices, in which regions representing higher-order information exhibit less lateralization (PM, SMA in monkeys; M2 in rats) and have a greater role in bilateral coordination; by contrast, M1 encodes concrete motor information, and therefore requires higher specificity for unilateral forelimb movements (Kurata, 2007; Nakayama, 2015; Soma, 2017). In this study, the contralateral preference, mainly in M1, was decreased by dopamine depletion. These results are in agreement with fMRI studies showing higher ipsilateral cortical activation during voluntary movements in PD patients (Wu, 2015). The disruption of cortical interhemispheric inhibition is likely to be the primary mechanism responsible for promoting the decrease in motor cortex lateralization and the generation of mirror movements (Johnson, 1998; Almeida, 2002; Li, 2007; Wu, 2015). However, these changes are not restricted to the motor cortex. In the parkinsonian state, a large fraction of BG neurons exhibit related to movements of more than one body part, including activity modulations related to movements of both the arm and the leg, movements of multiple joints, and movements of the ipsilateral limbs (Filion, 1988; Levy, 2001; Williams, 2005; Baker, 2010; Erez, 2011). According to the classic rate model of PD, dopamine depletion produces an imbalance between the direct and indirect pathways of the cortico-BG network, decreasing activity in the former and increasing activity in the latter (although we did not find an overall decreased activity). In humans and primates, initial studies using a metabolic estimate of afferent terminal activity suggested increased activation of iMSNs, the STN, and the GPi (Crossman, 1985; Mitchell, 1986) and decreased activation of the GPe and thalamus (Schwartzman and