1
ANALYSIS OF WATER USE BEHAVIOR AND
MICROBIAL POLLUTION OF IRRIGATION WATER,
AND THE ASSOCIATED HEALTH IMPACT
THROUGH VEGETABLE CONSUMPTION IN
KATHMANDU VALLEY, NEPAL
(ネパール・カトマンズ盆地における灌漑水の水利用実態と微生物汚染、お よびそれに伴う野菜摂取による健康影響の解析)
September 2016
Shankar Shrestha
3
Analysis of Water Use Behavior and Microbial Pollution of Irrigation Water, and the Associated Health Impact through Vegetable Consumption in Kathmandu Valley, Nepal
(ネパール・カトマンズ盆地における灌漑水の水利用実態と微生物汚染、およびそれに伴う野菜摂
取による健康影響の解析)
A dissertation submitted in partial fulfillment of the requirements for the degree of Doctor of Philosophy in Engineering
Special Doctoral Course on Integrated River Basin Management Interdisciplinary Graduate School of Medicine and Engineering
University of Yamanashi
September 2016
I
Abstract
Pollution of irrigation sources such as river, pond, canal, and groundwater by untreated and/or partially treated wastewater is widespread in the Kathmandu Valley, Nepal. As such sources are contaminated with enteropathogens, consuming raw vegetables can be a common route of exposure to pathogens. However, data on the prevalence of pathogens in the irrigation sources are limited. In addition to wastewater irrigation, vegetable contamination may occur by inappropriate handling of vegetables after harvest such as washing by polluted water. However, detailed investigation on such postharvest contamination of vegetables is lacking. It would be demanded to quantify such exposures and to assess health risk for farmers and consumers caused by consumption of vegetables irrigated by wastewater and washed with contaminated water in the Kathmandu Valley.
The main objective of this research was to analyze water use behavior and microbial pollution of irrigation water, and assess the associated health impact through vegetable consumption in the Kathmandu Valley, Nepal.
To achieve this aim, first we conducted questionnaire survey for farmers in three municipalities (Kirtipur, Madhyapur Thimi, and Bhaktapur) where wastewater irrigation is known to be practiced, and also questionnaire survey for consumers in areas covering central part of the Kathmandu Valley to analyze irrigation water use situation including wastewater irrigation, vegetable consuming and vegetable washing behavior in the valley. Then, we evaluated microbial quality of irrigation water and vegetables in the same areas of questionnaire survey for farmers. In order to evaluate pathogen exposure due to washing vegetables, removal rate of pathogen and remaining rate of washing water were estimated experimentally. Finally, we assessed health risk to famers and consumers from enteropathogens through consumption of raw vegetables. Annual risk of diarrhea from enteropathogenic Escherichia coli (EPEC), Giardia, and Cryptosporidium through consuming raw spinach, cabbage, carrot, and tomato was quantified using probabilistic Quantitative Microbial Risk Assessment (QMRA) approach.
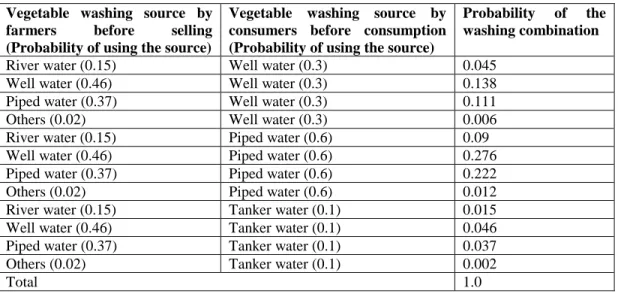
(1) Questionnaire survey conducted for farmers (n = 224) and consumers (n = 1136) showed river and well water as dominant sources of irrigation. Similarly, well, piped, and river water were found to be dominant sources of washing vegetables by farmers before selling, and piped, well, and tanker water were the dominant sources of washing vegetables by consumers before eating. Spinach, carrot, tomato, cauliflower, and cabbage were highly produced and consumed vegetables in the valley. Practices of wastewater irrigation during cultivation, and washing of vegetables by farmers and consumers prior to selling and eating, respectively were found to be commonly observed in the valley. It was also shown that out of the total consumers surveyed, only 10% was found to use treated water for washing vegetables whereas almost all consumers treated water for drinking use. (2) We determined concentrations of E. coli, total coliforms, Giardia, and Cryptosporidium
II
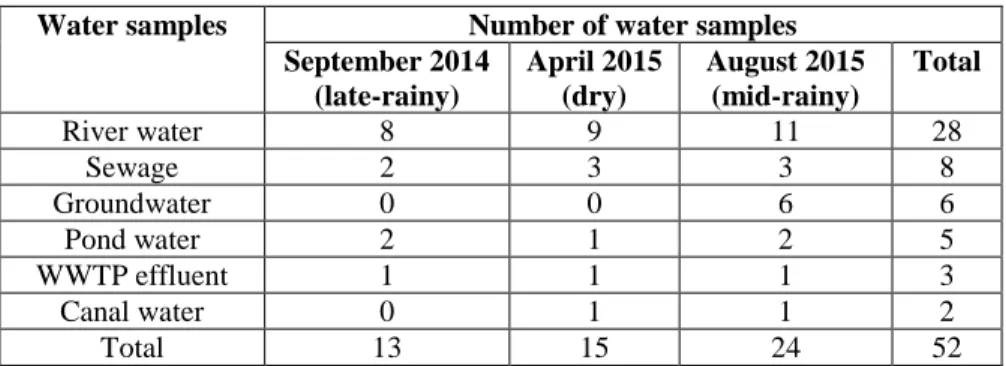
6), pond water (n = 5), canal water (n = 2), and effluent of a wastewater treatment plant (WWTP, n = 3) in different time periods [September 2014 (late-rainy season), April 2015 (dry season), and August 2015 (mid-rainy season)] to evaluate microbial quality of irrigation water. Concentrations of E. coli in irrigation water were above WHO guideline value for use of wastewater in irrigation (3 log counts per 100 ml) in 49 out of 52 water samples, indicating strong contamination of all the irrigation sources. Concentrations of indicator bacteria and protozoa were significantly higher in river water and sewage samples than the remaining samples (i.e. well water, canal water, pond water, and WWTP effluent). Significantly higher concentration of E. coli and total coliforms was observed in river water samples in the dry season than the rainy season. Other than this, seasonal variation was not observed suggesting high microbial contamination throughout the year. In addition, E. coli was found to be a good indicator of protozoa contamination of irrigation water sources.
(3) Vegetable samples (n = 27) from 8 farmers’ farmland were collected on November/December 2015 and concentrations of E. coli and total coliforms were determined. It showed poor relation between irrigation source and vegetable contamination at farmers’ field, although relation was obtained between irrigation method and vegetable contamination. Vegetables when irrigated manually by pouring water on top of vegetable showed higher contamination level than those irrigated by pumping and pouring water in a ditch in between two rows of vegetables. The highest contamination level was obtained for a spinach sample which was irrigated manually using sewage water. Contamination level on vegetables from farmers’ farmland was relatively less than expected from the high contamination probably due to the irrigation method widely used in the Kathmandu Valley. We obtained only a limited number of vegetable quality data, however, more vegetable sampling and analysis might be needed for better understanding of the factors responsible for vegetable contamination at farmers’ field.
(4) Remaining ratio of water on vegetable surface after washing (mean ± sd) was estimated to be 0.1302 ± 0.0148 for spinach (n = 3), 0.0380 ± 0.0103 for cabbage (n = 3), 0.0042 ± 0.0007 for carrot (n = 3), and 0.0032 ± 0.0002 for tomato (n = 3). Similarly, pathogen ratio remaining on vegetable after washing (mean ± sd) was estimated to be 0.1046 ± 0.0597 for spinach (n = 2), 0.2902 ± 0.1707 for cabbage (n = 2), 0.0870 ± 0.0084 for carrot (n = 2), and 0.0799 ± 0.0412 for tomato (n = 2). Different remaining ratio of each vegetable can be partly explained by the different shape and surface texture of them. (5) In QMRA, probability distribution functions were identified for parameters such as pathogen concentration in washing water, vegetable consumption rate, remaining pathogen ratio after washing, remaining water on vegetable after washing, and Monte Carlo simulation was performed to obtain the distribution of annual risk of diarrhea. The result demonstrated high median risk of infection from enteropathogens (above acceptable level of -4 log10 infection/person-year) through consuming vegetable when
III
combinations involving river was not considered. Well-tanker and piped-tanker vegetable washing combinations relatively showed more cases of less risk of infection than other combinations. For each washing combination and enteropathogen, median risk of infection through spinach consumption was the highest followed by that through consuming cabbage, carrot and tomato. Using treated water was effective to reduce the risk but risk of Giardia infection was still high despite assuming use of treated (filtered) water for washing vegetables at consumers’ household. Similarly, using filtered water for washing vegetables could not reduce the estimated risk below the acceptable level for washing combinations involving river water.
The results obtained in this study would serve to provide good dataset, especially on microbial quality of various irrigation sources in the Kathmandu Valley where such information is scarce due to lack of appropriate analytical laboratories and/or high cost of analysis. Moreover, our results on risk assessment through vegetable consumption have helped to identify measures to reduce risk of diarrhea in the valley such as avoiding river water for washing vegetables, using treated water for vegetable washing before eating. Our findings could represent not only urban areas of Nepal but also such areas of developing countries where practices of wastewater irrigation and/or vegetable washing by using contaminated water might be present.
V
Acknowledgement
Looking back to the last 3 years I have spent in the University of Yamanashi, it was a wonderful experience, and I take this opportunity to thank all involved for making this possible.
First, I would like to thank Japanese Government (Monbukagakusho) Scholarship Program for providing scholarship and Interdisciplinary Centre for River Basin Environment (ICRE) of University of Yamanashi for selecting me to pursue 3 years of the doctoral course. I want to thank Ms. Sachiko Maruyama for her academic and logistic arrangement, and my tutor Mr. Tomoya Mochizuki for his guidance during my entrance and early periods of stay at the university.
I am very grateful to my supervisor Prof. Junko Shindo for her constant guidance and valuable suggestions related to the research and manuscript preparation. I am equally grateful to members of Advisory and Thesis committee, Prof. Futaba Kazama, Prof. Yasushi Sakamoto, Assoc. Prof. Kei Nishida, Assoc. Prof. Eiji Haramoto, and Assoc. Prof. Hiroshi Ishidaira for their valuable suggestions to shape my research in the right direction. I am thankful to Dr. Eiji Haramoto not only for kindly allowing me to use his laboratory but also for teaching me advanced techniques of microbial analysis which was very important to my research.
My sincere gratitude goes to Mr. Takashi Furuya who guided me during earlier stage of the microbial analysis. I would also like to thank Dr. Takashi Nakamura and Dr. Yuki Yoneyama for their help during laboratory analysis. Similarly, I am thankful to Mr. Bhesh Raj Thapa for helping me to prepare maps using ArcGIS, and to Dr. Sadhana Shrestha for her guidance in using EasyFit software. Many thanks goes to whole ICRE family including professors, friends, seniors, juniors, and staffs for their wonderful support throughout my stay in Japan. I would like to acknowledge the Science and Technology Research Partnership for Sustainable Development (SATREPS) program of JICA and JST, entitled ‘Hydro-microbiological Approach for Water Security in Kathmandu Valley, Nepal’ for financial support during data collection. Similarly, I would like to thank Center of Research for Energy Environment and Water (CREEW) and The Small Earth Nepal (SEN) in Kathmandu for their help during water sampling and/or conducting questionnaire survey. Tribhuvan University Institute of Medicine (IOM-TU) in Kathmandu is also acknowledged for providing laboratory facilities for conducting microbial analysis.
Last but not the least, I am thankful to my parents, brother, and sisters for their moral support and good wishes from home, and to my wife who kindly came to Japan to give moral boost towards the end of my PhD program. I would like to dedicate this work to my late grandmother for always inspiring me to be kind and disciplined.
VII
List of Abbreviation
ANCOVA Analysis of Covariance ANOVA Analysis of Variance API Analytical profile index
CA California
CBS Central Bureau of Statistics CFU Colony-forming Units
CRAD Regional Directorate of Agriculture (Central-Region) CWF Ceramic water filter
E. coli Escherichia coli
EPEC Enteropathogenic E. coli
FAO Food and Agricultural Organization GON Government of Nepal
GW Groundwater
HH Household
ICIMOD International Center for Integrated Mountain Development IMS Immunomagnetic Separation
IWMI International Water Management Institute JICA Japan International Cooperation Agency JST Japan Science and Technology Agency KMC Kathmandu metropolitan city
LOD Limit of Detection MA Massachusetts
MCS Monte Carlo Simulations
ME Maine
MLD Million Liters per Day
MOEST/GON Ministry of Environment Science and Technology of Government of Nepal MPN Most Probable Number
NA Not Applicable
NHRC Nepal Health Research Council PBS Phosphate-buffered Saline PTFE Polytetrafluoroethylene
PW Pond Water
QMRA Quantitative microbial risk assessment
RW River Water
SATREPS Science and Technology Research Partnership for Sustainable Development SD Standard Deviation
SW Sewage
UNEP United Nations Environmental Program USA United States of America
USEPA United States Environment Protection Agency VDC Village Development Committee
VIII WWTP Wastewater Treatment Plant
IX Table of Contents Abstract………...I Acknowledgement………....….... V List of Abbreviation………...VII Table of Contents……….IX List of Figures………...…XIII List of Tables………..……XV Chapter 1 Introduction
1.1 Background and needs………...……3
1.1.1 Wastewater irrigation: Global perspective………..3
1.1.2 Wastewater irrigation: Kathmandu Valley, Nepal………..3
1.1.3 Health risk assessment: Exposure pathways………...5
1.2 Research objective………...…..6
1.3 Dissertation organization………...…7
Chapter 2 Overview of the study area and research framework 2.1 Study area………..……..11
2.1.1 Physiographic feature………...11
2.1.2 River networks………...11
2.1.3 Climate………. 13
2.1.4 Land Use………..……….13
2.1.5 Irrigation water use………...14
2.2 Research framework………15
Chapter 3 Survey of farmers’ and consumers’ household 3.1 Introduction……….19
3.2 Methodology………...19
3.3 Results……….…21
3.3.1 Proportion of cropped area………....…21
3.3.2 Proportion of irrigation amount………23
3.3.3 Irrigation source………25
3.3.4 Irrigation method / irrigation flow……….26
3.3.5 Vegetable consumption pattern……….…27
3.3.6 Vegetable washing behavior………...27
3.4 Discussion……….…..28
X
Chapter 4
Microbial quality of irrigation water
4.1 Introduction……….33
4.2 Methodology………...…34
4.2.1 Collection of water samples………..34
4.2.2 Detection of Cryptosporidium and Giardia………..35
4.2.3 Detection of E. coli and total coliforms……….…37
4.2.4 Statistical analyses………....37
4.3 Results……….…38
4.3.1 Prevalence of E. coli and total coliforms in water samples……….38
4.3.2 Prevalence of Giardia and Cryptosporidium in water samples……….40
4.3.3 Seasonal variation of indicator bacteria and protozoa concentrations in water samples………...41
4.3.4 Relationship between indicator bacteria and protozoa concentrations in water samples………...44
4.4 Discussion………...45
4.5 Conclusions……….…45
Chapter 5 Microbial quality of vegetables and their irrigation source 5.1 Introduction……….49
5.2 Methodology………...50
5.2.1 Recovery test of E. coli from vegetable surface………....50
5.2.1.1 Preparation of E. coli suspension for inoculation………...50
5.2.1.2 Inoculation of E. coli suspension………....51
5.2.1.3 Recovery of E. coli from vegetable surfaces………..51
5.2.1.4 Detection of E. coli………51
5.2.1.5 Calculation of recovery ratios………....52
5.2.2 Detection of E. coli and total coliforms on vegetable samples and their irrigation sources………...52
5.2.3 Conversion of indicator bacteria concentration (MPN/cm2) to (MPN/g)……..53
5.3 Results……….54
5.3.1 Recovery ratio of E. coli from vegetable surfaces………...54
5.3.2 Occurrence of E. coli and total coliforms in irrigation water and vegetable samples from farmers’ farmland………....54
5.3.3 Relation between vegetable weight and its surface area………....56
5.3.4 Conversion of total coliforms and E. coli concentration MPN/cm2 to MPN/g………..56
5.4 Discussion………...57
XI
Chapter 6
Health risk assessment from enteropathogens through vegetable consumption
6.1 Introduction……….61
6.2 Methodology………...61
6.2.1 Quantitative microbial risk assessment……….62
6.2.1.1 Hazard identification……….……62 6.2.1.2 Exposure assessment……….62 6.2.1.3 Dose-response relationship………....65 6.2.1.4 Risk characterization…...………..66 6.2.2 Sensitivity analysis………...67 6.2.3 Statistical analysis………68 6.3 Results……….68
6.3.1 Detection of enteropathogens and probability distribution………...68
6.3.2 Vegetable consumption rate and probability distribution………..70
6.3.3 Remaining water on vegetable after washing (R1 (= R2)) and probability distribution………...70
6.3.4 Remaining pathogen ratio after washing (X (= Y)) and probability distribution………...71
6.3.5 Risk of diarrhea from vegetable consumption………...71
6.3.5.1 Total risk considering all 12 vegetable washing combinations……..71
6.3.5.2 Risk from each washing combination………72
6.3.5.3 Total risk excluding washing combinations involving river………...76
6.3.6 Sensitivity analysis………...77
6.3.7 Effect of water treatment parameter in risk estimation………..81
6.3.8 Seasonal risk of EPEC infection through vegetable consumption……….82
6.4 Discussion………...83
6.5 Conclusions……….85
Chapter 7 Summary of the research 7.1 Summary of research results………...89
7.2 Contributions………...90
7.3 Recommendations for future research………92
References………95
Appendices Appendix 1………..….107
XIII
List of Figures
Figure 2.1 Location of Kathmandu Valley showing 5 major cities / municipalities………...12 Figure 2.2 River networks in the Kathmandu Valley, Nepal.………...…..13 Figure 2.3 Research Framework………15 Figure 3.1 Proportion of cropped area for different crops from sampled households of farmers in the Kathmandu Valley, Nepal (a) Kirtipur municipality (b) Madhyapur Thimi municipality and (c) Bhaktapur municipality………22 Figure 3.2 Proportion of irrigation amount for different crops from sampled households of farmers in the Kathmandu Valley, Nepal (a) Kirtipur municipality (b) Madhyapur Thimi municipality and (c) Bhaktapur municipality……….……24 Figure 3.3 Percentage share of irrigation water by various irrigation sources from sampled households of farmers in the Kathmandu Valley, Nepal………....25 Figure 4.1 Location of sampling sites in the Kathmandu Valley, Nepal………...…..35 Figure 4.2 Flowchart for detection of pathogens in water samples (Adopted from Haramoto et al. 2012b)………..……….…36 Figure 4.3 Concentration of indicator bacteria in water samples: (a) total coliforms (b) E. coli (c) Giardia (d) Cryptosporidium. Ten percent of LOD value was given to protozoa-negative samples………..……….……….42 Figure 4.4 Relationships between indicator bacteria and protozoan concentrations in water samples (a) E. coli–Giardia (b) E. coli–Cryptosporidium (c) Total coliforms–
Giardia (d) Total coliforms–Cryptosporidium (Green: August 2015, Red: April
2015, and Blue: September 2014)….………44 Figure 6.1 Beta-Poisson and Exponential dose-response functions………....………...66 Figure 6.2 Annual risk of diarrhea through vegetable consumption by considering all 12 washing combinations. Box: interquartile range; high and low lines: maximum and minimum; middle line: median; Dotted line: acceptable limit of risk………72 Figure 6.3 Annual risk of diarrhea through vegetable consumption for different washing combinations: (a) river-well (b) well-well (c) piped-well (d) others-well. Box: interquartile range; high and low lines: maximum and minimum; middle line: median; Dotted line: acceptable limit of risk..……….……..74 Figure 6.4 Annual risk of diarrhea through vegetable consumption for different washing combinations: (a) river-piped (b) well-piped (c) piped-piped (d) others-piped. Box: interquartile range; high and low lines: maximum and minimum; middle line: median; Dotted line: acceptable limit of risk……..………...……75
XIV
Figure 6.5 Annual risk of diarrhea through vegetable consumption for different washing combinations: (a) river-tanker (b) well-tanker (c) piped-tanker (d) others-tanker. Box: interquartile range; high and low lines: maximum and minimum; middle line: median; Dotted line: acceptable limit of risk………..………..…….76 Figure 6.6 Annual risk of diarrhea through vegetable consumption by considering all washing combinations excluding river. Box: interquartile range; high and low lines: maximum and minimum; middle line: median; Dotted line: acceptable limit of risk……….... 77
XV
List of Tables
Table 1.1 Wastewater production in the municipal areas of Kathmandu Valley…….……….4
Table 2.1 Five major land use type of major municipalities of the Kathmandu Valley, Nepal………...…..14
Table 3.1 Number of household with different irrigation sources in the Kathmandu Valley, Nepal……….…………26
Table 3.2 Irrigation flow type in surveyed farmers in the Kathmandu Valley, Nepal……….26
Table 3.3 Average consumption rate of vegetables in the Kathmandu Valley, Nepal……....27
. Table 3.4 Vegetable washing sources by farmers and consumers, and probability of using them………...………...…28
Table 3.5 Cropped area for different crops in three districts of the Kathmandu Valley, Nepal ………...………...………29
Table 4.1 Number of water samples collected in the Kathmandu Valley, Nepal………..…..34
Table 4.2 Positive ratio and concentrations of Cryptosporidium, Giardia, total coliforms, and E. coli in water samples from various irrigation sources………...…..…..38
Table 4.3 Positive ratio and concentrations of Cryptosporidium, Giardia, total coliforms, and E. coli in water samples from different rivers………...………...…..39
Table 4.4 Statistical significance of the mean differences of concentrations of Cryptosporidium, Giardia, total coliforms, and E. coli among different rivers….40 Table 4.5 Seasonal variation of Cryptosporidium, Giardia, total coliforms, and E. coli concentrations in irrigation water samples from paired datasets………...…..…..43
Table 5.1 Collection of irrigation water and vegetable samples from farmers’ farmland…...52
Table 5.2 Recovery ratio of E. coli from vegetable surfaces determined using BM Fukitool A kit………...………...…54
Table 5.3 Occurrence of E. coli and total coliforms in irrigation water source of farmers…..55
Table 5.4 Occurrence of E. coli and total coliforms in vegetable samples from farmers’ farmland………....55
Table 5.5 Relation between vegetable weight and its surface area……….…56
Table 5.6 Conversion of total coliforms and E. coli concentration MPN/cm2 to MPN/g……57
Table 5.7 Vegetable quality, irrigation water quality and irrigation method………..…58
Table 6.1 Descriptive statistics of enteropathogens………..……….69
Table 6.2 Descriptive statistics of vegetable consumption rates and fitted distribution…...70
XVI
Table 6.4 Pathogen ratio remaining on vegetable after washing………..……..71 Table 6.5 Median risk of infection (log10 infection/person-yr)………..72 & 73
Table 6.6 Contribution of parameters of risk calculation to the risk variance (Spinach)………...………...78 & 79 Table 6.7 Contribution of parameters of risk calculation to the risk variance (Carrot)………...80 & 81 Table 6.8 Risk estimation with and without water treatment parameter (Spinach)………….81 Table 6.9 Season risk of EPEC infection through vegetable consumption……….82 Table 6.10 Contribution of parameters of dose estimation to the estimation of dose………..84
XVII CHAPTER 1 INTRODUCTION 1 s f s f
3
1.1 Background and needs
1.1.1 Wastewater irrigation: Global perspective
Use of wastewater for irrigation has been taking place in many countries throughout the world such as Mexico, Vietnam, China, Nepal (Shuva et al. 1986; Rashid-Sally et al. 2004; Peasey et al. 2000), Israel (Haruvy 1997), Ghana (Keraita et al. 2002), Pakistan (Ensink et al. 2004), India (Buechler and Gayathri Devi 2005), middle east countries (AQUASTAT– FAO database 1997), Northern America, Europe and Australia (Angelakis et al. 1999; Crook 2003; Lallana et al. 2001). World Bank (2013) reported 1.6 billion people currently living in countries and regions with absolute water scarcity and the number is expected to rise to 2.8 billion people by 2025 as poor countries will face droughts and floods due to climate change. Wastewater is increasingly recognized as a potential water source for urban agriculture under conditions of increased freshwater scarcity in the urban areas (Mojid et al. 2010; Qadir et al. 2010). In Saudi Arabia, Kuwait, Israel, Jordan, Tunisia and Morocco, which is one of the most water scarce regions in the world, wastewater irrigation has been extensively practiced (AQUASTAT– FAO database 1997). Similarly, extensive wastewater use has also been documented in water scarce developed regions of Northern America, Europe and Australia (Angelakis et al. 1999; Crook 2003; Lallana et al. 2001).
Developed countries commonly use treated wastewater for irrigation, whereas, wastewater are often untreated or partially treated in developing countries due to poor wastewater infrastructure. Van der Hoek (2004) reported approximately 350,000 ha in 75 different cities throughout the world as directly irrigated with wastewater, and 550,000 ha in 17 cities as irrigated indirectly. Here, direct use refers to undiluted use of wastewater extracted from its source, whereas indirect refers to a certain level of dilution taking place through natural or artificial means, before use. International Water Management Institute (IWMI) studies showed around 11,900 ha of peri-urban agricultural areas was irrigated by untreated wastewater in Kumasi Ghana, whereas areas under formal irrigation was less than 6000 ha for the entire country (Keraita et al. 2002). A nationwide survey in Pakistan estimated 30,600 ha of wastewater irrigated area (Ensink et al. 2004). Similarly, out of the estimated 500,000 ha of wastewater irrigated land in Latin America (Chanduvi 2000), 350,000 ha was in Mexico alone (Peasey et al., 2000). Israel is a leading country in wastewater usage and expects to meet 70 percent of its agricultural water demand in 2040 by treated wastewater (Haruvy 1997). In arid regions, wastewater is especially valued for its reliability besides the added benefits from contained nutrients (Van der Hoek et al. 2002). In humid regions, such as Nepal and Vietnam, wastewater agriculture is largely the result of the unplanned pollution of irrigation sources with wastewater (Raschid-Sally et al. 2004).
1.1.2 Wastewater irrigation: Kathmandu Valley, Nepal
Wastewater is globally used as source of irrigation in many urban areas of the world (Mojid et al. 2010; Qadir et al. 2010). However, unlike in developed countries, wastewater used for agriculture in the Kathmandu Valley, Nepal is often untreated or partially treated due to
4
inadequate wastewater treatment plants and sewerage networks for the rapidly growing population. Wastewater treatment plants which are already in existence in the valley are either not in operation, or partially operational (Shukla et al. 2012). Table 1.1 shows the wastewater generated from domestic as well as industries in five municipalities of Kathmandu Valley. Overall, the five major municipalities in Kathmandu Valley generate 93.1 Million Litres per Day (MLD) of domestic wastewater, and 6.5 MLD of industrial wastewater.
Table 1.1 Wastewater production in the municipal areas of Kathmandu Valley
Description Municipalities
Kathmandu Kirtipur Lalitpur Madhyapur Thimi Bhaktapur Total Volume of Domestic Wastewater Generated (MLD) 64.497 3.920 15.647 3.069 5.971 93.1 Volume of Industrial Wastewater Generated (MLD) 4.515 0.274 1.095 0.215 0.418 6.5 Total Wastewater Generated (MLD) 69.012 4.195 16.742 3.284 6.389 99.6 Total Wastewater Collected (MLD) 34.506 2.097 8.371 1.642 3.195 49.8
Source: ICIMOD, MOEST/GON and UNEP, 2007
Only about 50% of the total wastewater generated (99.6 MLD) in Kathmandu Valley is collected at these wastewater treatment plants. Thus, huge amount of these untreated or partially-treated wastewater generated in the valley is directly discharged into water environments such as river, ponds polluting them.
Irrigation by pumping water from sewage and other polluted sources is widespread in the Kathmandu Valley, Nepal (Rutkowski et al. 2007; Shrestha et al. 2016). Rutkowski et al. (2007) surveyed 109 farmers using wastewater within Kirtipur and Bhaktapur municipalities of the Kathmandu Valley and found Bhaktapur farmers practiced direct utilization of wastewater by pumping from sewers, whereas Kirtipur farmers used it indirectly by gravity flow from polluted rivers. Similarly, Sada (2010) studied the practice of wastewater use in Hanumante River in Bhaktapur District, which is a tributary of Bagmati River and the river carries domestic and industrial wastewater generated in the urban areas of Bhaktapur and Madhyapur Thimi municipalities. The water quality analysis of the river from seven locations from upstream to downstream showed large concentration of fecal coliform in the river water, suggesting any direct use of river water, including irrigation, would be hazardous to human health. Wastewater in the area was found to be used mainly for irrigating vegetables, which is important means of cash income for the farmers in the area. Farmers were found selling their produces in the adjoining markets of Thimi, Bhaktapur and markets in Kathmandu as well (Sada 2010).
5 1.1.3 Health risk assessment: Exposure pathways
Positive impact of using wastewater in agriculture as reported in some previous studies has been attributed to increased crop productivity and/or reduction in use of costly fertilizers (Mukherjee and Gupta 2011) due to high levels of nutrients (mainly, nitrogen, phosphorus and potassium) in wastewater (Ensink et al. 2002). Though wastewater is considered to be rich in nutrients it also contains high level of pollutants which risk the health of farmers and consumers. In developing countries, consumers face the most severe health risks, as only a small percentage of the wastewater undergoes sufficient treatment. Wastewater irrigated food is likely a key pathway for epidemics (Ensink et al. 2002). In Accra, Ghana, for example, every day about 200,000 urban dwellers eat fast food with raw salad leaves produced with highly polluted irrigation water (Amoah et al. 2007). Similarly, a study of irrigation water used for production of crops traditionally eaten raw showed widespread presence of protozoan parasites such as Giardia, Cryptosporidium, and Cyclospora in the United States and Central America (Thurston-Enriquez et al. 2002).
In the Kathmandu Valley, Nepal, farmers, who are using water from polluted sources or from sewage because of easy access and/or no alternative source, are experiencing mild-to-serious health impacts from exposure (Rutkowski et al. 2007). Accidental ingestion of polluted irrigation water by farmers during agricultural activities could be a pathway for disease transmission. Similarly, inappropriate handling of produce after harvest such as washing with polluted water might contribute to adverse heath effect on consumers through produce consumption. Vegetables coming into the markets in Nepal are dipped and rinsed in highly contaminated water of small ponds or rivers in order to wash and clean it, but actually it becomes contaminated once again (Sherchand et al. 1999). Vegetables are highly produced and consumed crops in the valley. Irrigation and/or vegetable washing sources such as river, well, piped water are contaminated with pathogens in the valley (chapter 3). In these circumstances, vegetables in the valley are prone to be contaminated with pathogens as a result of irrigation and/or washing. Contamination of vegetables can occur if polluted water comes in contact with the edible portion of the vegetable (Gorny 2006). Sherchand et al. (1999) detected oocysts of parasitic protozoa Cyclospora cayetanensis in washing of green leafy vegetables: cabbage, lettuce, and mustard leaves on four different occasions in June, July, August, October, and November 1998. These vegetables were collected from local vegetable markets in the Kathmandu Valley. Shrestha et al. (2014) similarly reported occurrence of total coliforms in radish, turnip, and lettuce samples collected in September-October 2012 from commercial farms in Mulpani Village Development Committee (VDC) of the Kathmandu Valley.
Diarrhea is the most common disease in the valley with high infection rates transmitted through the fecal-oral route from the intake of water or food predominantly contaminated with protozoa, such as Giardia and Cryptosporidium, and helminths (Ono et al. 2001; Oda et al. 1998). Similarly, other fecal-oral diseases, such as typhoid fever, giardiasis, dysentery, and hepatitis, are also prevalent in the valley (Neupane 2013). Assessment of health risks from exposure to enteropathogens in the valley are rare. Shrestha (2014) assessed risk of
6
diarrhea from enteropathogens such as EPEC, Giardia and Cryptosporidium from using shallow groundwater (dug well and tube well) for drinking and bathing purpose in the Kathmandu Valley, Nepal. The results showed high risk of diarrhea from both drinking and bathing pathways, especially for Giardia and Cryptosporidium. For dug well water, the combined risk from all three enteropathogens was 0.3103 infection/person-year from the drinking pathway and 0.2746 infection/person-year from the bathing pathway. Similarly, for tube well water, the combined risk was 0.2043 infection/person-year from the drinking pathway and 0.1668 infection/person-year from the bathing pathway. The obtained risks were well above the acceptable level of less than 0.0001 infection/person-year.
In Kathmandu Valley, large amounts of vegetables are irrigated with wastewater due to the lack of irrigated infrastructure and the scarcity of drinking water. Health hazards associated with consuming vegetables irrigated with wastewater is an area that needs attention and it is closely linked with water insecurity issues (Prakash et al. 2016). Similarly, exposure to pathogens through consumption of vegetables contaminated with washing water could threaten consumers’ health. However, health risk assessment through such exposures is lacking in the Kathmandu Valley. To assess such risks, data on the concentration of pathogens in washing water and on vegetables are important. However, information on the prevalence of pathogens in aquatic environments is relatively scarce in Nepal. Similarly, measurements of contaminants on vegetables are rare and the pervasiveness of pathogen contaminants on various types of vegetables in the valley is still unknown. This may be due to lack of rigorous detection methods for different pathogens and/or the lack of laboratories equipped with appropriate analytical instruments in developing countries like Nepal. Analyzing microbial quality of irrigation/washing water and assessing the associated health risks through vegetable consumption is the aim of this study, which could be helpful in proposing pollution control strategies in the Kathmandu Valley. The detailed objectives of this study are described below.
1.2 Research objective
The overall objective of this research is to analyze water use behavior and microbial pollution of irrigation water, and assess the associated health impact through vegetable consumption in the Kathmandu Valley, Nepal. To achieve this aim, the specific objectives are as follows:
(1) To understand irrigation water use situation in the Kathmandu Valley (Chapter 3). (2) To understand vegetable consuming and washing behavior in the Kathmandu Valley
(Chapter 3).
(3) To evaluate microbial quality of irrigation water (Chapter 4). (4) To evaluate microbial quality of vegetables (Chapter 5).
(5) To assess health risks to consumers from enteropathogens through consumption of vegetables washed with contaminated water (Chapter 6).
7
Irrigation water use behavior including wastewater irrigation can influence quality of vegetables grown in the valley. In addition, washing of vegetables by contaminated water sources (e.g. irrigation and domestic water) can deteriorate quality of vegetables being consumed. When information on microbial quality of vegetables and various water sources used for washing vegetables are combined with vegetable consuming and washing behavior, then assessment of risk from enteropathogens through vegetable consumption can be conducted.
1.3 Dissertation organization
This dissertation comprises 7 chapters. Brief description of each chapter is given below.
Chapter 1: Introduction
Chapter 1 begins with background on irrigation situation in the Kathmandu Valley, Nepal with emphasis on wastewater irrigation practices commonly observed. Then, it highlights water use behavior of farmers and consumers such as vegetable washing, which can cause postharvest contamination in vegetables, which are commonly produced and consumed in the valley. After pointing out research needs and challenges, it indicates specific tasks to be performed in this research. Finally, it gives brief description of all the chapters included in this study so as to get overall insights of the research at a glance.
Chapter 2: Overview of the study area and research framework
Chapter 2 gives details of the study area including climate, soil type, and land use. Then, it gives general framework of the research.
Chapter 3: Survey of farmers’ and consumers’ household
Chapter 3 describes the survey of farmers’ and consumers’ households such as irrigation water use, irrigation source and methods, crop area, vegetable consumption, vegetable washing behavior before selling and eating, and so on. Based on the results, irrigation water use behavior of farmers, domestic water use behavior of consumers, and vegetable consumption pattern were discussed.
Chapter 4: Microbial quality of irrigation water
Chapter 4 describes about irrigation water sampling activities carried out in different time periods and locations of the Kathmandu Valley, various laboratory experiments conducted to check indicator bacteria (E. coli and total coliforms) and protozoa (Giardia and
Cryptosporidium) concentrations in the water samples, and the results obtained after the
microbial analyses. Based on the results, microbial quality of irrigation water in the valley was assessed.
Chapter 5: Microbial quality of vegetables and their irrigation source
Chapter 5 describes about sampling activities of vegetables and their respective irrigation sources from farmers’ farmland in the valley, lab experiments conducted to check
8
concentrations of E. coli and total coliforms in vegetable and water samples, and the results of the microbial analyses. Based on the results, vegetable contamination level and the associated factors that could influence vegetable contamination in the valley were discussed.
Chapter 6: Health risk assessment from enteropathogens through vegetable consumption
Chapter 6 focuses on probability of infection to consumers from exposure to enteropathogens through consumption of vegetables contaminated with washing water. Based on the results, impacts of different vegetable washing sources, enteropathogen types and vegetable types on the estimated risks were discussed.
Chapter 7: Summary of the research
Finally, chapter 7 summarizes the research results, its contributions and presents the challenges and recommendations for future research works.
9
CHAPTER 2
11
2.1 Study area: Kathmandu Valley
2.1.1 Physiographic feature
Nepal is located entirely in the Ganges basin and is bordered by India in the east, south and west and by China in the north. Physiographically, the country is divided into three parts: the high Himalayas in the north (24% of the country’s total area); the hill and mountain slopes in the centre (56%), which include the lower hills called siwalik where elevations vary between 300 and 700 m; and the plain called terai in the south at elevations below 300 m (20%) (FAO Aquastat 2011).
Kathmandu Valley lies in central hilly region of Nepal between the latitudes 27º 32’ 13” and 27º 49’ 10” north and longitudes 85º 11’ 31” and 85º 31’ 38” east and is located at a mean elevation of about 1,300 meters (4,265 feet) above sea level. Kathmandu Valley comprises of three districts, Kathmandu, Lalitpur, and Bhaktapur, together which cover an area of 899 square kilometers (Kathmandu (395 km2), Lalitpur (385 km2), and Bhaktapur (119 km2)),
whereas the area of the Valley as a whole is 665 square kilometers. The Valley encloses the entire area of Bhaktapur district, 85% of Kathmandu district and 50% of Lalitpur district. (Pant et al. 2009) With more than 1.5 million people, (220,000 households) the Kathmandu Valley is the most important urban center of Nepal and includes five major cities/municipalities: Kathmandu metropolitan city (KMC), Lalitpur sub metropolitan city (LSMC), Bhaktapur municipality, Kirtipur municipality, and Madhyapur Thimi municipality (Figure 2.1).
2.1.2 River networks
Kathmandu Valley lies at the upper part of Bagmati River Basin. Bagmati River is the major river flowing through the valley. The Bagmati River originates just below the summit of Shivapuri Hill and is fed by springs and monsoon rainfall and a number of tributaries as it flows down from the Kathmandu valley floor (Paudel 2002). Hanumante River, Bishnumati River, Dhobi Khola/River, Manahara River, Balkhu River, and Nakhu Khola/River are important tributaries of the Bagmati River (Figure 2.2). The Bagmati River leaves the valley at Chobhar, the south of the watershed. The watershed boundary covers about 664 km2 areas (Acres International 2004). Hanumante is the major river system and also major water source in Bhaktapur, especially for irrigation. The river originates from Mahadev Pokhari at Nagarkot and passes through Bhaktapur and Madhyapur Thimi municipalities before joining Manahara River at Jadibuti in Kathmandu. It flows from northeast to south-west having average width ranging from minimum 10 m to maximum 20 m. The total stretch of the river course is 23.5 km with total catchment area of 143 km2. Of these, 100 km2 is located in the Bhaktapur district and the rest, about 43 km2 falls in Lalitpur District (Sada 2010). The Manahara River is located in the northeast of the Kathmandu Valley (Figure 2.2). It is elongated in shape having 28 km length from NE to SW covering 83 km2 of area. This river is straight and narrow in upstream stretch and is meandered and wide in downstream stretch (Bajracharya 2007).
12
Increasing degradation of the Bagmati Basin has been evident in recent years due to uncontrolled disposal of untreated wastewater (domestic, industrial, solid waste leachate, agricultural runoff etc.) in the rivers by increasing population (Paudel 2002). Water from Hanumante, Manahara, and Balkhu rivers are important sources of irrigation in the valley (Rutkowski et al. 2007; Sada 2010; Shrestha et al. 2016). However, pollution of these sources from wastewater indicate health concerns to farmers and consumers in the region.
13 2.1.3 Climate
Kathmandu Valley has sub-tropical cool temperate climate with maximum of 35.6°C in April and minimum of –3°C in January. Average annual humidity is 75%. The temperature in general is 19°C to 27°C in summer and 2°C to 20°C in winter. The average rainfall is 1400 mm, most of which falls during June to August (Pant et al. 2009). Four seasons are commonly observed in the valley; pre-monsoon (March - May), monsoon (June - September), post monsoon (October - November), and winter (December - February) (Aryal et al. 2008). Monsoon season covers 80% of rainfall whereas winter months are mostly dry with occasional precipitation caused by westerly cyclones (JICA 1990). Due to limited rainfall, frequency of wastewater irrigation by pumping water from sewage and other polluted sources like river is large in the dry season in the valley (Rutkowski et al. 2007).
Figure 2.2 River networks in the Kathmandu Valley, Nepal
(Arrow shows direction of river flow) 2.1.4 Land use
Land use in KMC and LSMC are dominated by mixed type comprising residential and commercial areas. Cultivation comes second in both of these municipalities (Table 2.1). In
14
contrast, land use in Bhaktapur, Madhyapur, and Kirtipur municipalities and other rural areas are dominated by cultivation. The past trend in urbanization indicates that the cultivation areas are most susceptible to haphazard urbanization (Pant et al. 2009).
Table 2.1 Five major land use type of major municipalities of the Kathmandu Valley, Nepal
S.N. Land use type Land class Area (ha) % of total
Kathmandu Metropolitan City
1 Mixed Built up 2592.7 48.89
2 Cultivation Cultivation 891.18 16.80
3 Open area Built up 571.17 10.77
4 Road Road 386.52 7.29
5 Institutional Built up 385.89 7.28
Lalitpur Sub Metropolitan City
1 Mixed Built up 673.0634 43.60
2 Cultivation Cultivation 395.123 25.59
3 Institutional Built up 173.7648 11.26
4 Road Road 95.2971 6.17
5 Open area Open area 57.5482 3.73
Kirtipur Municipality 1 Cultivation Cultivation 944.08 59.71 2 Plantation Plantation 194.13 12.28 3 Mixed Built up 163.05 10.31 4 Institutional Built up 156.36 9.89 5 Road Road 41.33 2.61 Bhaktapur Municipality 1 Cultivation Cultivation 383.976 56.76 2 Mixed Built up 145.4679 21.50 3 Institutional Built up 34.8624 5.15 4 Road Built up 33.6139 4.97
5 Open area Open area 19.8772 2.94
Madhyapur Thimi Municipality
1 Cultivation Cultivation 712.26 62.10
2 Mixed Built up 183.73 16.02
3 Institutional Built up 85.58 7.46
4 Road Road 51.93 4.53
5 Plantation Plantation 47.56 4.15
(Source: Pant et al. 2009) 2.1.5 Irrigation water use
Nepal’s average for total water withdrawal for use in agriculture (irrigation and livestock) is estimated to be 8,226 m3 /yr/ha (0.26 l/s/ha), where surface water, groundwater, and mixed
water (surface water + groundwater) contribute to 80%, 19%, and 1% of the withdrawal amount, respectively (FAO Aquastat 2011). The irrigated area in the Kathmandu valley is reported to be 32,000 ha (CRAD/GON 2013). Information on water use volume for
15
agriculture in the Kathmandu valley is limited. However, we can consider Nepal’s average as a general guideline to understand the situation of agricultural water use in the valley. Wastewater irrigation by pumping water from sewage, and from other polluted sources like rivers, ponds, and pools is a widespread but poorly documented practice in the valley (Rutkowski et al. 2007; Shrestha et al. 2016; Shukla et al. 2012). River pollution is a serious issue in the valley. The sewer systems in Kathmandu and in other parts of the country are essentially combined sewerage and storm water drains and also illegal connection of sewerage to storm water drains are common in many parts of the country. Direct disposal of solid and liquid wastes along the river course and rainwater runoff originating from the urban areas and agricultural lands have been responsible for significant degradation in the water quality of the rivers and other surface water bodies (Shukla et al. 2012). Thus, there are serious health concerns associated with the use of polluted irrigation water and/or consumption of wastewater irrigated food in the valley.
2.2 Research framework
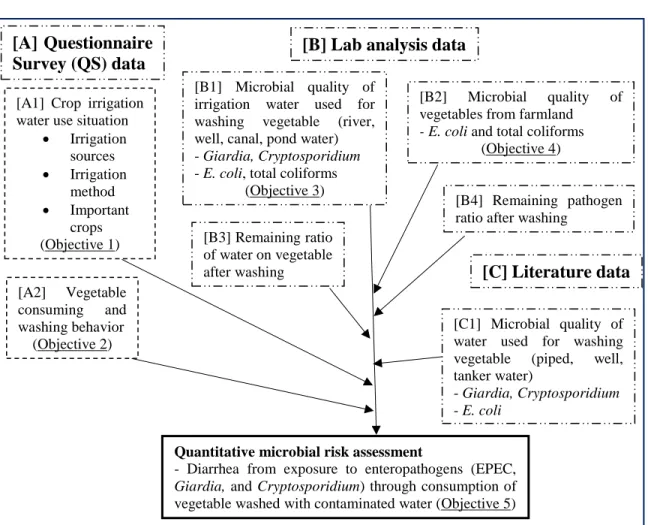
Figure 2.3 Research Framework Quantitative microbial risk assessment
- Diarrhea from exposure to enteropathogens (EPEC,
Giardia, and Cryptosporidium) through consumption of
vegetable washed with contaminated water (Objective 5) [A1] Crop irrigation
water use situation
Irrigation sources Irrigation method Important crops (Objective 1)
[B] Lab analysis data
[B1] Microbial quality of irrigation water used for
washing vegetable (river,
well, canal, pond water) - Giardia, Cryptosporidium - E. coli, total coliforms
(Objective 3)
[B2] Microbial quality of
vegetables from farmland
- E. coli and total coliforms
(Objective 4) [A2] Vegetable consuming and washing behavior (Objective 2) [A] Questionnaire Survey (QS) data [B3] Remaining ratio of water on vegetable after washing [B4] Remaining pathogen ratio after washing
[C] Literature data
[C1] Microbial quality of water used for washing
vegetable (piped, well,
tanker water)
- Giardia, Cryptosporidium - E. coli
16
Figure 2.3 shows general research framework. The main objective of this research was to analyze water use behavior and microbial pollution of irrigation water, and assess the associated health impact through vegetable consumption in the Kathmandu Valley, Nepal. To achieve this aim, first we conducted questionnaire survey for farmers in three municipalities (Kirtipur, Madhyapur Thimi, and Bhaktapur) where wastewater irrigation is known to be practiced, and also questionnaire survey for consumers in areas covering central part of the Kathmandu Valley to analyze irrigation water use situation including wastewater irrigation, vegetable consuming and vegetable washing behavior in the valley (Objective 1 & 2). Then, we evaluated microbial quality of irrigation water (Objective 3) and vegetables (Objective 4) in the same areas of questionnaire survey for farmers. In order to evaluate pathogen exposure due to washing vegetables, removal rate of pathogen and remaining rate of washing water were estimated experimentally. Finally, we assessed health risk to famers and consumers from enteropathogens through consumption of raw vegetables. Annual risk of diarrhea from enteropathogenic Escherichia coli (EPEC), Giardia, and Cryptosporidium through consuming raw spinach, cabbage, carrot, and tomato was quantified using probabilistic Quantitative Microbial Risk Assessment (QMRA) approach (Objective 5).
17
CHAPTER 3
19
3.1 Introduction
Wastewater irrigation has recently emerged as a focus of study in the developing world where its use by urban and peri-urban farming communities is increasingly becoming a livelihood reality. In many of the urban areas around the world, wastewater is being used as source of irrigation for urban agriculture (Mojid et al. 2010; Qadir et al. 2010). In humid regions, such as Nepal and Vietnam, wastewater agriculture is largely the result of the unplanned pollution of irrigation sources with wastewater (Raschid-Sally et al. 2004). The total population of Kathmandu Valley was estimated at 2.51 million in 2011 (CBS 2011) and will reach 3.5 million by 2016. The existing wastewater network has not been maintained or expanded to serve the spreading urban areas and increased population. This has resulted in untreated sewage being discharged directly into local watercourses. The Bagmati Action Plan (2008) showed that daily production of wastewater is 90 Million liters per day (MLD) in dry season and 120 MLD in wet season; of which 70% of domestic wastewater is directly discharged into the river. The rivers have become open sewers presenting severe public health risks, in particular to the urban poor.
A review of literature for the situation in Nepal has shown that wastewater irrigation is not well documented in spite of it being widespread. Fifty-nine percent of the valley is agricultural of which 20% is formally irrigated. Informal irrigation occurs in parts of the urban and peri-urban areas of the valley, where lack of adequate wastewater treatment facilities and low rainfall during the dry winter season (November–April) has led to extensive use of wastewater for agriculture (Rutkowski et al. 2007). Negative health effects such as skin diseases, respiratory problems, headache and worm infections might be concern to farmers during cultivation period of crops. Similarly inappropriate handling of produce after harvest such as washing with polluted water might contribute to adverse heath effect on consumers through produce consumption.
Given this background, the objective of this study was to conduct surveys of farmers and consumers household for understanding wastewater irrigation use situation, agriculture activities, vegetable consuming, and washing behavior of farmers and/or consumers in the Kathmandu Valley.
3.2 Methodology
After obtaining ethical approval from Nepal Health Research Council (NHRC) of Government of Nepal on March 2015, survey of farmers’ household (HH) (n = 224) was conducted on April 2015 from Kirtipur (n = 74), Madhyapur Thimi (n = 75), and Bhaktapur (n = 75) municipalities of the Kathmandu Valley, Nepal in order to understand wastewater irrigation and agricultural activities in the region. It was a cross-sectional study based on household survey. 6 interviewers were selected for conducting household survey (2 interviewer per municipality). These 6 interviewers were current or former university students with good background of engineering, environment science and/or survey. Before
20
starting survey, an orientation was given to the interviewers on the objectives of the study, study procedure, confidentiality, study questionnaire and on the interview technique. Then, the interviewers visited households and conducted interview. My role was to supervise the interviewers throughout the survey period. Following the procedure of getting informed consent, the participants were interviewed using structured questionnaire as shown in Appendix 1 (only the questions used for the analysis in this chapter are shown). The interview method was face to face interview. Participants were specifically informed about the study objectives and procedures and those who met the inclusion criteria were requested to voluntarily participate in the study. The inclusion criteria of the participants were: 18-59 years of age, should be in the state to give interview physically and mentally, willing to provide written informed consent to participate in the study voluntarily, and should understand questions as well as able to answer meaningfully.
Kirtipur municipality falls in Kathmandu district, whereas Madhyapur Thimi, and Bhaktapur municipalities lies in Bhaktapur district. These areas were selected for survey because of a common practice of wastewater irrigation reported in previous studies (Rutkowski et al. 2006; Shukla et al. 2012; Sada 2010). International Water Management Institute (IWMI) Nepal had also identified potential wastewater irrigated areas in 5 municipalities of the Kathmandu valley and it was prominent in Kirtipur, Bhaktapur and Thimi municipalities (IWMI, 2014). The areas not identified by IWMI as wastewater irrigated areas in these municipalities were considered as normal irrigated areas. Thus, data collection sites were categorized into 2 groups in each municipality: wastewater irrigated area (I) and normal irrigated area (II). About 74-75 households were surveyed randomly covering both areas I and II from each of these 3 municipalities. Sample size estimation was done based on the following formula given by Tabachnik & Fidell (2001):
N > 50 + 8m
where, N: sample size, m: number of independent variables.
In this study, 3 key independent variables were considered; i.e. irrigation water supply, sanitation and hygiene behavior, and food consumption pattern. Thus, N > 74. We have 3 municipalities; so altogether 222 households (about 224) were considered.
Information on irrigation water use, crops grown, area cropped, irrigation source, irrigation methods, vegetable consumption and vegetable washing source were assessed by using the structured questionnaire (Appendix 1). Prior to the survey of farmers on April 2015, pre-testing of the questionnaire was done on September/October 2014.
Similarly, survey of consumers’ household (n = 1136) was conducted on January-April 2015 in the Kathmandu Valley covering 4 municipalities of the Kathmandu Valley, namely Kirtipur, Bhaktapur, Madhyapur Thimi, and Lalitpur municipalities in order to analyze domestic water use behavior of consumers. This survey was conducted by the Science and Technology Research Partnership for Sustainable Development (SATREPS) program of
21
JICA and JST, entitled ‘Hydro-microbiological Approach for Water Security in Kathmandu valley, Nepal’ for analysis of domestic water use behavior of people. This survey of consumers was not designed and managed by me. However, questions relating to vegetable consumption, vegetable washing, and treatment of washing water were added for my research on my request. This survey was also conducted after obtaining ethical approval from NHRC. Information on consumption of vegetables, source of washing vegetables, and water treatment before washing vegetables were obtained by using structured questionnaire as shown in Appendix 2 (only the questions used for the analysis in this chapter are shown). Prior to the survey of consumers on January-April 2015, pre-testing of the questionnaire was done on 19 September 2014.
3.3 Results
3.3.1 Proportion of cropped area
Among the three municipalities surveyed, Kirtipur had the highest cropped area per household (0.36 ha/HH), followed by Bhaktapur (0.25 ha/HH), and Madhyapur Thimi (0.18 ha/HH) municipalities. Total cropped area of the surveyed farmers were 26.7 ha (n = 74), 18.9 ha (n = 75), and 13.2 ha (n = 75) for Kirtipur, Bhaktapur, and Madhyapur Thimi municipalities, respectively. Pant et al. (2009) reported total cultivation area of 944.1 ha, 384 ha, and 712.3 ha for Kirtipur, Bhaktapur, and Madhyapur Thimi municipalities, respectively. Kirtipur municipality belongs to Kathmandu district, whereas Bhaktapur and Madhyapur municipalities belong to Bhaktapur district. Department of Agriculture, Nepal reported highest cultivated area for Kathmandu district (21,263 ha), followed by Lalitpur (14,000 ha) and Bhaktapur (8,078 ha) districts (CRAD/GON 2013). In contrast, total irrigated area was the highest for Lalitpur district (14,000 ha), followed by Kathmandu (12,109 ha) and Bhaktapur (5,891 ha) districts (CRAD/GON 2013).
Figure 3.1 shows the proportion of cropped area for different crops of surveyed households in the 3 municipalities. For all the three municipalities, vegetables and rice occupied the highest and 2nd highest share of the total cropped area, respectively. Wheat was also important cultivated crop in Kirtipur and Bhaktapur municipalities. Similarly, potato was an important cultivated crop in Madhyapur Thimi and Bhaktapur municipalities. On the other hand, spice cultivation was also common in Madhyapur Thimi municipality.
22 (a)
(b)
(c)
Figure 3.1 Proportion of cropped area for different crops from sampled households of farmers in the
Kathmandu Valley, Nepal (a) Kirtipur municipality (b) Madhyapur Thimi municipality and (c) Bhaktapur municipality 24% 19% 3% 39% 1% 7% 1% 5% 1% rice wheat mushroom vegetables spices fruits/flowers mustard maize potato Major vegetables: Tomato (36%) Cauliflower (29%)
Total cropped area
(n = 74):26.7 ha Kirtipur municipality 17% 6% 10% 56% 11% rice wheat potato vegetables spices Major vegetables: Carrot (43%) Spinach (29%)
Total cropped area
(n = 75): 13.2 ha Madhyapur Thimi municipality 32% 14% 13% 33% 6% 2% rice wheat potato vegetables spices mustard Major vegetables: Cauliflower (27%) Spinach (19%) Cabbage (10%)
Total cropped area (n = 75):18.9 ha
23
According to the department of agriculture, total cultivated vegetable area was the highest for Bhaktapur district (3,225 ha), followed by Lalitpur (2,695 ha) and Kathmandu (2,218 ha) districts (CRAD/GON 2013). Among the surveyed farmers’ households, total area under vegetable production was 10.3 ha, 7.3 ha, and 6.2 ha in Kirtipur, Madhyapur Thimi, and Bhaktapur municipalities, respectively. Among vegetable cultivation in Kirtipur municipality, tomato (3.7 ha, 36% of total vegetable area), cauliflower (3.0 ha, 29% of total), soybean (1.5 ha, 15 % of total), and cabbage (0.7 ha, 7% of total) occupied the major shares, whereas in Madhyapur Thimi municipality, carrot (3.1 ha, 43% of total), spinach (2.1 ha, 29% of total), and cauliflower (0.6 ha, 8.4% of total) occupied the major shares. Similarly, cauliflower (1.7 ha, 27% of total), spinach (1.1 ha, 19% of total), and cabbage (0.6 ha, 10% of total) were commonly grown in Bhaktapur municipality.
3.3.2 Proportion of irrigation amount
Figure 3.2 shows the proportion of irrigation amount for different crops in the Kathmandu Valley among Kirtipur, Madhyapur Thimi and Bhaktapur municipalities based on survey of farmers’ household (n = 224). Like cropped area, vegetables were found to be dominant crops in terms of irrigation amount use in all the three municipalities of the valley. In addition to vegetables, mushroom also occupied highest share of irrigation water volume in Kirtipur municipality. Among vegetable cultivation in Kirtipur municipality, tomato (40% of total irrigation amount), cauliflower (39% of total), and cabbage (11% of total) occupied the major shares, whereas in Madhyapur Thimi municipality, spinach (39% of total), carrot (38% of total), and cauliflower (7% of total) occupied the major shares. Similarly, cabbage (71% of total), cauliflower (8% of total), and spinach (7% of total) were commonly grown in Bhaktapur municipality.
Thus, vegetables were found to be the most important crops in municipal areas of the Kathmandu Valley in terms of cropped area and irrigation amount use.
24 (a)
(b)
(c)
Figure 3.2 Proportion of irrigation amount for different crops from sampled households of farmers in the
Kathmandu Valley, Nepal (a) Kirtipur municipality (b) Madhyapur Thimi municipality and (c) Bhaktapur municipality 6% 2% 40% 38% 1% 13% rice wheat mushroom vegetables spices fruits/flowers Major vegetables: Tomato (40%) Cauliflower (39%) Kirtipur municipality 8% 3% 6% 73% 10% rice wheat potato vegetables spices Major vegetables: Spinach (39%) Carrot (38%) Madhyapur Thimi municipality 13% 9% 8% 66% 3% 1% rice wheat potato vegetables spices mustard Major vegetable: Cabbage (71%) Bhaktapur municipality
25 3.3.3 Irrigation source
Figure 3.3 shows percentage share of irrigation water by various irrigation sources from sampled households of farmers in three municipalities of the Kathmandu Valley, Nepal.
Figure 3.3 Percentage share of irrigation water by various irrigation sources from sampled households of
farmers in the Kathmandu Valley, Nepal.
In Kirtipur municipality, groundwater well (80.3%) was the most dominant source of irrigation, followed by river water (17.3%), and others (canal water, 2.4%). Similarly, groundwater well (66.5%) was the most dominant source of irrigation, followed by river water (33%), and others (tank/pond, 0.5%) in Madhyapur Thimi municipality. On the other hand, in Bhaktapur municipality, river water (93.3%) was the most dominant source of irrigation, followed by groundwater well (6.6%), and others (canal water, 0.1%). Hanumante River and its tributaries were the dominant source of irrigation in Bhaktapur municipality. Figure 3.3 was prepared based on irrigation amount data estimated for different sources from the survey. However, it was not possible to quantify irrigation amount for some households due to inadequate information. Such information is not represented in Figure 3.3. Similarly, it does not include no irrigation cases. So, it may not give the overall picture of the irrigation sources in the municipality. Therefore, additional information on irrigation source in each municipality was prepared which can be seen in Table 3.1. Table 3.1 includes households with no irrigation and other irrigation sources as well which was not included in Figure 3.3 due to the above mentioned reasons.
As shown in Table 3.1, canal water was an important source of irrigation in Kirtipur municipality in addition to well and river water. In Bhaktapur municipality, irrigation by using sewage, canal water, tank/pond water, and stone spout was also done in some households in addition to river and well water (Table 3.1).
17.3 33 93.3 80.3 66.5 6.6 2.4 0.5 0.1 0% 10% 20% 30% 40% 50% 60% 70% 80% 90% 100%
Kirtipur Thimi Bhaktapur
26
Table 3.1 Number of household with different irrigation sources in the Kathmandu Valley, Nepal Irrigation
source
Number of households with different irrigation sources Kirtipur municipality Madhyapur Thimi
municipality Bhaktapur municipality I II I II I II River water 4 2 8 10 22 30 Well water 25 9 31 25 3 5 Sewage 0 0 0 0 4 0 Canal water 6 14 0 0 5 0 Piped water 2 0 0 0 0 0 Tank/pond 0 0 1 0 1 0 Stone spout 0 0 0 0 1 0 No irrigation 2 10 0 0 4 0 Total 39 35 40 35 40 35
I: wastewater irrigation area; II: normal irrigation area 3.3.4 Irrigation method / irrigation flow
Irrigation in the valley was found to be commonly performed by pumping water from irrigation sources and pouring it into a ditch between 2 rows of vegetables. As shown in Table 3.2, all the farmers surveyed used pump to withdraw water for irrigating their fields in Madhyapur Thimi municipality. Similarly, 77% of total farmers surveyed in Bhaktapur municipality used pump to irrigate their fields and 17% farmers’ fields were irrigated by gravity flow. In contrast, 30% and 22% irrigation was by using pump and gravity flow, respectively in Kirtipur municipality. All farmers surveyed irrigated their field in Madhyapur Thimi municipality, whereas irrigation was not done by 12% and 4% farmers in Kirtipur and Bhaktapur municipalities, respectively.
Table 3.2 Irrigation flow type in surveyed farmers in the Kathmandu Valley, Nepal
Municipality Irrigation flow Number of households % total
Kirtipur Electric/kerosene pump 30 40 Gravity flow 22 30 Manual lift 10 14 No irrigation 12 16 Total 74 100
Madhyapur Thimi Electric/kerosene/diesel pump 75 100
No irrigation 0 0 Total 75 100 Bhaktapur Electric/diesel pump 58 77 Gravity flow 13 17 No irrigation 4 6 Total 75 100
Unlike other municipalities, irrigation by manual lift could be observed in Kirtipur municipality, where farmers take water by themselves from irrigation source such as well,