Self-Aggrandizement and Self-Esteem in Japan
By R. A. Brown
Abstract
One hundred and sixty-nine Japanese college students assessed themselves on a version of the Pelham and Swann (1989) Self-Attributes Questionnaire and the Rosenberg (1965) Self-Esteem Scale. The principle findings were that, contrary to some past research, the self-esteem of the Japanese participants was positively associated with self-aggrandizement and negatively associated with self-effacement, but not associated with lack of self-aggrandizement. Unlike American students, being “average” did not have a negative impact on the self-esteem of Japanese participants. Supplementary finding were that most participants evaluated themselves primarily as average or slightly better than average, females were more likely to evaluate themselves as average, personal importance ratings did not very much influence how much “better than average” self-evaluations were associated with self-esteem, the availability of an “average” option did not affect very much the distribution of self-evaluations.
Americans regard being average as undesirable (Alicke, Klotz, Breitenbecher, Yurak, & Vredenburg, 1995). According to Dunning, Meyerowitz, and Holzberg (1989, p. 1084), “. . . calling someone average often prompts the inference that the person is undesirable.” Indeed, several noted cross-cultural self-esteem researchers have gone so far as to deliberately avoid using the expression “average” in their questionnaires because “ . . . . it may have a pejorative connotation” (Kobayashi & Brown, 2003). In the United States, where competition and achievement are strongly emphasized (Sternberg, 1997; see also Covington, 1989, cited in Kahne, 1996) to be less than “above average” may be experienced as a form of failure (Alicke, et al.,). Viewing oneself as less than above average appears to have a deleterious effect on the self-esteem of North Americans. But are high self-esteem and self-aggrandizement positively related outside of “secular, middle-class Anglo-America”? (Markus & Kitayama, 2003, p. 280).
In Japan, it may be shameful or disgraceful (Endo, 1995) to be below average, but it is not a form of failure not to be above average, hence is not anything that need have a negative impact on one’s sense of self-worth. Japanese indeed are said to value being ordinary and average (Ohashi & Yamaguchi, 2004; Yoshida, Ura, & Kurokawa, 2004). If being average in Japan is a desirable condition, then being average might promote self-esteem. The present research examines the relationship between self-aggrandizement (evaluating oneself as better
Two additional questions were investigated: (4) which domains of self-evaluation contribute more to self-esteem? And (5) does the availability of a neutral scale response option affect participants’ self-evaluations?
Method
ParticipantsParticipants were 169 Japanese university students (71 males, mean age = 19.1, SD = 1.45, and 98 females, mean age 19.0, SD = 1.36) enrolled in an introductory psychology class taught by a Japanese instructor. Students were asked to fill out the questionnaire, which was described as a survey of student self-perceptions. Questionnaires were filled out in large classes, voluntarily, anonymously, and without compensation. No deception or manipulation was involved and students were free not to participate (and 14 chose not to). There were more females than males but Binomial tests revealed that the proportion of males to females was not significantly different from .5. Participants were assigned randomly to two groups: One group (n = 87, 37 males and 50 females) responded to the questionnaire items using a 7-point scale including the option of “average,” the other group (n = 82, 34 males and 48 females), used a 6-point scale without the “average” option. Chi square tests indicated that the distribution of male and females participants did not differ between the two groups.
Procedure
Participants completed the 5-item version of the Pelham and Swann (1989) Self-Attributes Questionnaire SAQ, augmented by seven items previously shown to be relevant for Japanese (Ito, 1999; Yamamoto, Matsui, & Yamanari, 1982). The five SAQ items were chitekinouryouku (intellectual ability), shakousei (social skills), geijutsutekinouryouku (aesthetic sense), undouryouku (athletic abilities), and youshi (physical appearance). The supplemental items were seikaku (character), nouryoku (capability), joushiki (common sense), kinben (diligence), seijitsu (sincerity), kenson (modesty), and eigonouryouku (English language ability). Participants were asked to estimate the degree to which they possessed each of the attributes relative to other people of their own age and sex. As Nunnally (1978) suggested, participants may select the neutral or “don’t know” options because they do not want to respond. Therefore, analyses were also conducted using the data from the 7-point scale sub-sample (described above), but with the neutral responses omitted. Because “self-estimates of qualities are particularly likely to affect global self-esteem when the quality is highly valued [italics in original]” (Rosenberg, 1968, p. 231), participants were then asked to estimate how important each attribute was for them personally. The questionnaire also contained Hoshino’s (1970) translation of the Rosenberg Self-Esteem Scale (RSES). Sample items were “I feel that I have a number of good qualities” and “I certainly feel useless at times” (reverse scored). The RSES is a widely used instrument for assessing self-esteem and Hoshino’s translation was the first available in Japan and has been widely used as well (Hori, 2003). A 5-point rating scale ranging from 1 (strongly disagree) to 5 (strongly agree) was used and a summary score computed after reversing the negatively phrased items. Higher scores indicate higher self-esteem.
Results
The 12 SAQ aggregated items had Cronbach’s αs of .86 and .85 in the 7-step and 6-step formats, respectively, but inter-item correlations were generally not so high as to indicate synonymy (mean inter-item correlation in both formats was .33), in addition to which the items with the highest inter-item correlations were clearly not synonymous (for example, sincere and aesthetic sense, r =.74). Nevertheless, to guard against the possibility of inflated SAQ scores stemming from the summation of highly overlapping domains and traits, analyses were conducted with standardized values where appropriate. The RSES had a Cronbach’s α of .78 (for both males and females).
The male and female means for the SAQ12-7 for did not differ significantly, t (84) = .25, ns. The combined mean was 3.79 (SD = 0.85) which was lower than the scale midpoint, t (85) = 2.27, p < .05. The male and female means for the SAQ12-6 did not differ significantly (t (80) = 0.26, ns). The combined mean was 3.51 (SD = 0.72) which did not differ from the hypothetical scale midpoint, t (81) = 0.11, ns.
In the present data, self-aggrandizement and self-esteem were positively associated. Self-esteem was significantly correlated with the number of above average self-evaluations in the 6-point response format, r (82) = .48, p < .0001. The more often participants evaluated themselves above average, the higher was their self-esteem. Since the 6-point format lacked a neutral option, the total range of responses was fully specified by the above average self-evaluations. In the 7-point format, participants’ self-esteem was again associated with the number of times they evaluated themselves above average, r (86) = 47, p < .0001. Self-esteem was not significantly associated (at p < .05, Bonferroni adjusted to p < .02 to hold the error rate constant over the three tests) with the number of times participants evaluated themselves as average, r (86) = .24, ns. In both formats, below average self-evaluations were associated with lower self-esteem. As in North America, being above average is associated with higher esteem than being average, which in turn is associated with higher self-esteem than being below average (R. A. Brown, 2006b). But unlike in North America, being average is not associated with lower self-esteem.
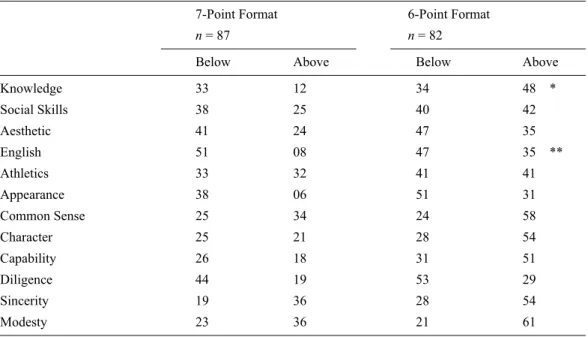
The percentage of the relevant sub-sample describing themselves as average with respect to each of the 12 domains ranged from 13% to 25%, with an average of 18%. Chi-square tests were conducted to determine whether the distribution of above average and below average self-evaluations in the 6-point format, treated categorically, differed from the distribution of above average and below average responses, omitting the neutral “average” responses in the 7-point format. As can be seen in Table 1 below, only two of the 12 self-evaluations differed at p < .01 (knowledge and English ability, where participants who lacked the “average” option were more self-flattering. In sum, participants were about as likely to self-enhance as to self-efface when they could not describe themselves as average.
Table 1. Distribution of Below Average and Above Average Self-Evaluations in Odd and Even Numbered Response Formats, with Neutral “Average” Option Omitted in the Odd Numbered Format.
7-Point Format
n = 87
6-Point Format n = 82
Below Above Below Above
Knowledge 33 12 34 48 * Social Skills 38 25 40 42 Aesthetic 41 24 47 35 English 51 08 47 35 ** Athletics 33 32 41 41 Appearance 38 06 51 31 Common Sense 25 34 24 58 Character 25 21 28 54 Capability 26 18 31 51 Diligence 44 19 53 29 Sincerity 19 36 28 54 Modesty 23 36 21 61
Note. Difference between distribution of responses differs according to chi-square test, * p < .01, ** p < .001.
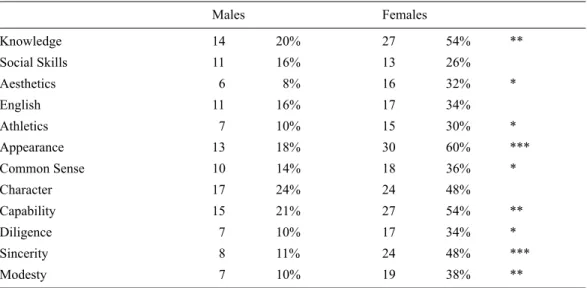
Chi-square tests were conducted to determine if the males and females selected the “average” option with equal frequency. The results (Table 2) show that the female participants described themselves as average more than the males did (p < .01).
Table 2 . Relative Frequency with which Males and Females Selected Neutral Response Option. Males Females Knowledge 14 20% 27 54% ** Social Skills 11 16% 13 26% Aesthetics 6 8% 16 32% * English 11 16% 17 34% Athletics 7 10% 15 30% * Appearance 13 18% 30 60% *** Common Sense 10 14% 18 36% * Character 17 24% 24 48% Capability 15 21% 27 54% ** Diligence 7 10% 17 34% * Sincerity 8 11% 24 48% *** Modesty 7 10% 19 38% **
Note. Distribution of responses between males and females differs according to chi-square test, * p < .01, ** p < .001, *** p < .0001,
Discussion
The present study contributes to the literature on the structure and cognitive concomitants of positive self-assessments and self-affect (self-esteem) in Japanese college students in several ways. Moderate self-esteem scores, for example, can be accounted for by the tendency of Japanese participants to view themselves as mostly average and to use the scale option that reflects that self-perception. When given the explicit option of describing themselves as average, Japanese participants tended to describe themselves as average, females more so than males. Consistent with results reported in R. A. Brown (2006a), the sum of the 12 SAQ items and most of the individual items were positively correlated with self-esteem. Japanese self-aggrandize less than North Americans do, but those who self-aggrandize more have higher self-esteem than those who self-aggrandize less.
These results are more intelligible if it is assumed that Japanese and North Americans are similar in feeling good about being above average and feeling bad about being below average, but are dissimilar in how they feel about being average. North Americans feel bad about this, Japanese do not. This may be because being average connotes lack of success in North America, but lack of failure in Japan, as noted above. Because most people are by definition average, it is perhaps less surprising that most Japanese believe that they are average, than that most Americans believe that they are not.
In Japan, meeting a certain standard is regarded as a more concrete, more attainable goal than the more abstract goal of “achieving excellence” or “being all that one can be.” Being “average” means that one has meet expected standards and thereby successfully avoided failure (rather than failed to achieve excellence).
Concluding Comments
Several limitations in the present research must be addressed. It is generally impossible to distinguish between responses and attitudes based on questionnaire data alone. Moderate responses are particularly problematic because there are so many possible things that midpoint scale responses can indicate, including ambivalence, uncertainty, apathy, and even hostility to the assumptions, method, or objectives of the research (Nunnally (1978, p. 596). These, needless to say, are problems that beset every study that assesses subjective states using self-reports. In any case, there is at present no better way to know what people feel than to ask them (Barrett, 2006), and self-reported data are probably as reliable as any other source of information, provided that obvious faking and response styles are accounted for (Nederhof, 1985).
Finally, students’ extensive experience in ability-sorted age cohorts sharing highly similar educational experiences (Dore, 1997; Iwasaki, 2005; McVeigh, 2001) in all probability means that asking participants to compare themselves to “the average student” without further specification means that they are likely to be accurately assessing themselves, assuming that they are using their classmates as comparison targets. In this case, moderate self-assessments may not be closely associated with self-esteem, if participants derive their sense of self-worth from being better than average students in general or better than students from less prestigious universities in particular, rather than their classmates. Future research should consider more precisely specifying the comparison targets used in such self-assessment tasks.
References
Alicke, M.D., Klotz, M.L., Breitenbecher, D.L., Yurak, T.J., & Vredenburg, D.S. (1995). Personal contact, individuation, and the better-than-average affect. Journal of Personality and Social Psychology, 68, 804-825. Barrett, L. F. (2006). Solving the emotion paradox: Categorization and the experience of emotion. Personality
and Social Psychology Review, 10, 20-46.
Brown, R. A. (2006a). Self-effacement tendency and self-esteem in Japanese college students. Information & Communication Studies, 35, 17-34. Department of Information Sciences, Bunkyo University, Chigasaki, Japan.
Brown, R. A. (2006b). The Relationship between Self-Aggrandizement and Self-Esteem in Japanese and American University Students Information & Communication Studies, 35, 1-16. Department of Information Sciences, Bunkyo University, Chigasaki, Japan.
Dore, R. (1997). Reflections on the diploma disease twenty years later. Assessment in Education: Principles, Policy, & Practice, 4, 189-206.
Dunning, D., Meyerowitz, J. A., & Holzberg, A. D. (1989). Ambiguity and self-evaluation: The role of idiosyncratic trait definitions in self-serving assessments of ability. Journal of Personality and Social Psychology, 57, 1082-1090.
Endo, Y. (1995). A false modesty/other-enhancing bias among Japanese. Psychologia, 38, 59-69.
Hori, K. (堀 啓造). (2003). Rosenberg日本語訳自尊心尺度の検討Retrieved November 12, 2005 from http://www.ec.kagawa-u.ac.jp/~hori/yomimono/sesteem.html
Ito, T. (1999). 社会的比較における自己効用傾向―平均位女効果の検討 [Self-enhancement tendency and other evaluations: An examination of “better-than-average effect”. Japanese Journal of Psychology, 70, 367-374.
Iwasaki, M. (2005). Mental health and counseling in Japan: A path toward societal transformation. Journal of Mental Health Counseling, 27, 129-141.
Kahne, J. (1996). The politics of self-esteem. American Educational Research Journal, 33(1), 3-22.
Kobayashi, C., & Brown, J. D. (2003). Self-esteem and self-enhancement in Japan and America. Journal of Cross-Cultural Psychology, 34, 567-580.
Markus, H.R., & Kitayama, S. (1991). Culture and the self: Implications for cognition, emotion, and motivation. Psychological Review, 98, 224-253.
Markus, H.R., & Kitayama, S. (2003). Culture, self, and the reality of the social. Psychological Inquiry, 14, 277-283.
McViegh, B. J. (2001). Higher education, apathy, and post-meritocracy. The Language Teacher, 25 (10), 29-32. Nederhof, A. J. (1985), Methods of coping with social desirability bias: A review. European Journal of Social
Psychology, 15, 263-280.
Nunnally, J. C. (1978). Psychometric theory (2nd Ed). New York: McGraw-Hill.
Ohashi, M.M., & Yamaguchi, S. (2004). Super-ordinary bias in Japanese self-predictions of future life events. Asian Journal of Social Psychology, 7, 169-186.
Pelham, B.W., & Swann, W. B. Jr. (1989). From self-conceptions to self-worth: On the sources and structure of self-esteem. Journal of Personality and Social Psychology, 57, 672-680.
Rosenberg, M. (1965). Society and the adolescent self image. Princeton, NJ: Princeton University Press. Rosenberg, M. (1968). The Logic of Survey Analysis. New York: Basic Books.
Sternberg, R.J. (1997). Thinking styles. New York: Cambridge University Press.
Yamamoto, M., Matsui, Y., & Yamanari, Y. (1982). 認知された自己の諸側面の構造 Ninchi sareta jiko no shosokumen no kozo. [substructure of self-recognition]. Japanese Journal of Educational Psychology 30(1), 64-68.
Yoshida, A., Ura, M., & Kurokawa, M. (2004). Self-derogative presentation in Japan: An examination from the viewpoint of receivers’ reactions. Japanese Journal of Social Psychology, 20, 144-151.
Author Note
I am indebted to Yoko Kondo, Teruhiro Tomita, and Mami Ueda for assistance with various aspects of the research.
Correspondence concerning this article should by addressed to R.A. Brown, 1-2-22 East Heights # 103, Higashi Kaigan Kita, Chigasaki-shi 253-0053 Japan. Electronic mail may be sent via internet to RABrown_05@hotmail.com