Title
Evaluation of Column Carryover of Phosphorylated Peptides and
Fumonisins by Duplicated Solvent Gradient Method in Liquid
Chromatography/Tandem Mass Spectrometry( 本文(Fulltext) )
Author(s)
SAKAMAKI, Hiroshi; UCHIDA, Takeharu; LIM, Lee Wah;
TAKEUCHI, Toyohide
Citation
[Analytical Sciences] vol.[31] no.[2] p.[91]-[97]
Issue Date
2014
Rights
The Japan Society for Analytical Chemistry (公益社団法人日本
分析化学会)
Version
出版社版 (publisher version) postprint
URL
http://hdl.handle.net/20.500.12099/53575
Introduction
Carryover is a phenomenon in which the sample from a previous injection is observed or detected during the analysis of subsequent injections in high-performance liquid chromatography (HPLC). This is a common problem that can compromise the accuracy of HPLC. Carryover is often observed when injecting highly concentrated samples using liquid chromatography/tandem mass spectrometry (LC/MS/MS). One of the criteria for carryover in bioanalysis is that the peak area of a blank sample that follows an injection of a highest standard sample (i.e., upper limit of quantitation, ULOQ) should be less than 20% of the peak area of the lower limit of quantitation (LLOQ) of the sample.1,2 Researchers often spend a significant amount of time and effort to meet this criterion. Therefore, in order to solve this problem, the ULOQ is set to be lower, while the LLOQ is maintained.3
Carryover is caused by residual material as well as irreversible adsorption in the flow path within the LC/MS/MS system. It primarily occurs within the column4–6 and autosampler.7,8 In the case of carryover caused by the autosampler, a peak of the sample is eluted at the same decided retention time, whereas a
carryover in the column does not elute at the same retention time, and such phenomena as peak tailing or leading are often observed.6 Carryover is often observed with phosphorylated and basic compounds, in which the former is adsorbed on metallic material in the flow path via interactions with metal ions. On the other hand, the latter is adsorbed on residual silanol in the packing material.
Carryover in the autosampler can be improved by changing the sampler needle and valve materials,3,9–12 minimizing the contact area between the needle and the seal, and optimizing the solvents used to wash the needle.9,11–13 In general, needle materials are made of PEEK (polyetheretherketone), stainless-steel, and fused silica. Carryover could be minimized by using modified platinum-coated, stainless-steel needles. Carryover is caused by residual samples between the needle and the seal in the autosampler. The outside of the needle is immersed in the sample in the vial, and the sample adsorbs on the needle. Therefore, the carryover can be improved by using needle materials that do not adsorb the sample, and/or by reducing the contact area between the needle and the seal. In addition, washing the needles with certain solvents, such as 100% organic solvents for hydrophobic compounds and counter ionic solvents for ionic compounds, could be effective.14
Carryover in the column is mainly due to the adsorption of samples on the packing materials.4-6,15 The carryover could be improved by changing the washing time of the column as well 2015 © The Japan Society for Analytical Chemistry
† To whom correspondence should be addressed.
E-mail: [email protected]
Evaluation of Column Carryover of Phosphorylated Peptides and
Fumonisins by Duplicated Solvent Gradient Method in Liquid
Chromatography/Tandem Mass Spectrometry
Hiroshi S
AKAMAKI,*
,**
†Takeharu U
CHIDA,* Lee Wah L
IM,** and Toyohide T
AKEUCHI**
* Chemicals Evaluation and Research Institute, 1600 Shimotakano, Sugito, Kitakatsushika, Saitama 345–0043,
Japan
** Department of Chemistry and Biomolecular Science, Faculty of Engineering, Gifu University, 1-1 Yanagido,
Gifu 501–1193, Japan
Columns made of three different materials were evaluated with regard to the carryover of phosphorylated peptides and fumonisins in liquid chromatography/tandem mass spectrometry (LC/MS/MS). In order to eliminate carryover caused by the injection operation in the autosampler, the column carryover was calculated using the duplicated solvent gradient method. A column made of a glass-lined stainless-steel tube and polyethylene frits (GL-PE column) yielded the most significant improvements in the peak shape and the carryover as compared to the other columns. The carryover of fumonisin B1 (FB1) and HLADLSpK (T19p) in the GL-PE column could be reduced; the lower limit of quantitation of T19p, and the range of the calibration curve were also improved. Since carryover peaks with the GL-PE column were symmetrical peaks of the samples, carryover in the column did not occur. The carryover calculated by the duplicated solvent gradient method corresponded to those in the flow path from the injection port to the inlet frit of the column. The carryover value of FB1 in the column with a stainless-steel tube and stainless-steel frits (S-S column) was 1.70%, and that of the flow path was 0.23%. We found that the majority of the carryover in our system occurred in the S-S column. Keywords Carryover, column hardware, liquid chromatography/tandem mass spectrometry, metal free, duplicated solvent gradient method
as the gradient profile.16 The carryover of fumonisins was improved by using a mobile phase containing 0.3% formic acid.17
On the other hand, in order to eliminate the carryover of peptides, Dolman et al. examined the column washing step in four columns containing different packing materials.4 The carryover was eliminated by using a poly-(styrene-co-divinylbenzene) monolithic column without mesopores.
In HPLC, columns are packed with minute packing materials under high pressure, and in order to avoid the outflow of the packing materials, filters, which are called “frits”, are used at both ends of the column. As for the column hardware materials, stainless-steel, PEEK, glass, fused-silica capillary etc. are typically used. For the frit materials, sintered stainless-steel, mesh stainless-steel, titanium, glass, Teflon, PEEK etc., are used. The samples are adsorbed on the column hardware, and carryover occurs. Mochizuki et al. eliminated the carryover of fumonisins by using a metal-free PEEK column.15
The evaluated samples in this study were fumonisins and phosphorylated peptides. Severe carryover was observed in preliminary studies. Fumonisins produced by Fusarium species are called mycotoxins, which are toxic to both humans and animals, as well as may contaminate food and animal feed. Fumonisins contain four carbonyl groups. Phosphorylated peptides have one or more phosphate groups, which lend a high affinity towards metals. They are adsorbed on the metal parts of the flow pass in HPLC, thus causing poor peak symmetry and carryover. The primary carryover occurs in the column and autosampler, and identifying the carryover in partial HPLC systems is difficult. Conventional carryover was calculated using the ratio of the peak area of the previous sample to that of the blank sample. This method included all carryover, such as in the needle and valves of the autosampler as well as in the column. Therefore, in order to exclude the carryover of the injection valve operation in the autosampler, the duplicated solvent gradient method18 was used. Since the injection carryover in the autosampler was not included in this method, it was possible to limit the carryover in both the column and flow path. This method is ideal for calculating the carryover in only the column. In this paper, the carryover of three columns made of different materials was evaluated using the duplicated solvent gradient method.
Experimental
Reagents and chemicals
A mixture of phosphorylated peptides, Mass PREP phosphorylated peptide Sample Kit–Enolase, was purchased from Nihon Waters (Tokyo, Japan). This kit included four phosphorylated peptides (T18p, T19p, T43p, and T43pp); however, only two phosphorylated peptides (T18p: NVPLYpK and T19p: HLADLSpK) were used in this work. A standard solution containing 50 mg/L of Fumonisin B1 (FB1) and B2 (FB2), and a standard solution containing 50 mg/L Fumonisin B3 (FB3), formic acid, acetonitrile, methanol, and isopropanol were purchased from Kanto Chemicals (Tokyo, Japan). All other reagents were of analytical grade and were used as received without any further purification. Water was purified with a Milli-Q purification system obtained from Millipore (Bedford, MA).
Sample treatment
The mixture of FBs was dissolved in acetonitrile at a concentration of 10 mg/L to prepare the stock solution. The
sample solution containing the 3 FBs at a concentration of 1 mg/L was dissolved in water. A mixture of phosphorylated peptides was dissolved in water at a concentration of 1000 fmol/μL to prepare the stock solution. A sample solution of the mixture of phosphorylated peptides (500 fmol/μL) was dissolved in 10 mM phosphoric acid. All stock solutions were stored at –20°C, and the sample solutions were prepared immediately prior to analysis.
Chromatographic and mass spectrometric conditions
The chromatographic system was a Thermo Scientific Ultimate 3000 BioRS (Bremen, Germany) with a 10 μL mixer. A mixture of methanol/acetonitrile/H2O/isopropanol 1:1:1:1 (v/v/v/v) was used as the needle washing solvent.
Fumonisins: The chromatographic mobile phases A and B were 0.1% formic acid and acetonitrile, respectively. Using a gradient flow, the separation began with 80% A and 20% B, and reached 30% A and 70% B in 10 min, at a flow rate of 0.2 mL/ min. Next, the chromatographic system, including the column, was washed by passing through 5% A and 95% B for 4 min. Next, the system was equilibrated by passing through 80% A and 20% B for 6 min. The second gradient flow of the duplicated solvent gradient method was the same as the first gradient condition without an injection. The injection volume was 3 μL.
Phosphorylated peptides: The chromatographic mobile phases A and B were 0.1% formic acid and acetonitrile, respectively. Using a gradient flow, the separation began with 95% A and 5% B, and reached 50% A and B in 10 min, at a flow rate of 0.2 mL/ min. Next, the chromatographic system, including the column, was washed by passing through 5% A and 95% B for 4 min, and the system was equilibrated by passing through 95% A and 5% B for 6 min. The injection volume was 2 μL.
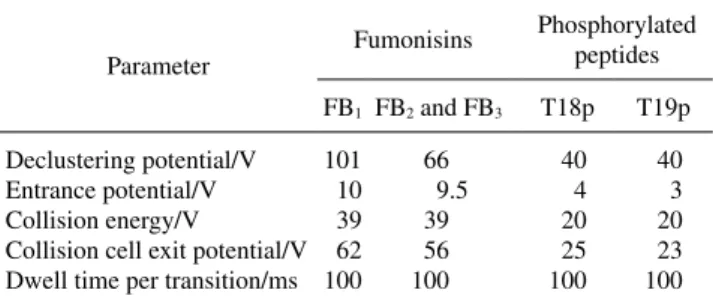
The MS/MS was an AB Sciex 3200QTRAP triple quadrupole ion trap hybrid mass spectrometer equipped with a Turbo V Ionsource. The measurements were performed in positive mode with an ionization voltage of 5500 V at a temperature of 550°C. The curtain gas setting was 30 psi. Gas 1 and Gas 2 were set to 60 psi. The MS/MS detection was carried out in the selected reaction monitoring (SRM) mode at m/z 722.4 → 352.4 for FB1 and at m/z 706.35 → 336.3 for FB2 and FB3. The SRM transition for FB2 and FB3 could not be independent. With regard to the peptides, MS/MS detection was carried out in the SRM mode at m/z 407.2 → 186.2 for T18p and at m/z 432.2 → 383.2 for T19p. The other MS/MS parameters and values are shown in Table 1. The MS/MS conditions were tuned and optimized by infusion of the sample solutions with a syringe pump. Instrument control and data acquisition were carried out using Analyst 1.6.1 Fig. 1 Structure of fumonisin B1 (R1 = OH, R2 = OH), fumonisin B2 (R1 = H, R2 = OH), and fumonisin B3 (R1 = OH, R2 = H).
Software, and the data was processed using MultiQuant 2.1.1 Software.
Column hardware
Chromatographic tubes made of stainless-steel (150 mm × 2.1 mm i.d.) and glass lined stainless-steel tubes (150 mm × 2.0 mm i.d.) were utilized without any deactivation treatments. The sintered frits were made of stainless-steel, PEEK, and polyethylene (PE). The S-S column was composed of a stainless-steel tube and stainless-steel frits. The GL-PEEK column was composed of a glass-lined stainless-steel tube and PEEK frits. The GL-PE column was composed of a glass-lined stainless-steel tube and PE frits. Three columns were packed with L-column2 ODS 3 μm particles (Chemicals Evaluation and Research Institute, Tokyo, Japan) from the same lot.
Carryover by the duplicated solvent gradient method
The carryover values were calculated using the peak area ratio that was eluted by the second gradient to the first gradient in the duplicated solvent gradient method. This peak area ratio was defined as the relative carryover. The use of relative carryover had two advantages in the evaluation. First, the ratio was not directly related to the absolute sample concentration. Second, the amount of the absolute carryover in the analyte could be estimated by the relative carryover and concentration of the preceding sample.19
The average relative carryovers were calculated by 6 repeated injections using the duplicated solvent gradient method. The standard sample solutions contained 1 mg/L fumonisins and 500 fmol/μL phosphorylated peptides. The samples were evaluated in three columns made of different materials, and the carryover values were calculated.
Calibration curve of phosphorylated peptides in bioanalysis The effect of the column hardware on the calibration curve of the standard solution of phosphorylated peptides was investigated. These investigations involved the carryover. The ULOQs of T18p and T19p were set to 500 fmol/μL. First, the standard solutions of the phosphorylated peptides were prepared at concentrations of 5, 10, 25, 50, 100, 250, and 500 fmol/μL. Each standard sample solution was injected 6 times, from low to high concentrations in each column; the calibration curves of the average area were determined, and the weighting was found to be 1/x. Next, the relative carryover of each column was calculated using the blank sample solution and the ULOQ standard sample solution.
Injection carryover
Samples that were eluted by injection operation were not included in the carryover calculated by the duplicated solvent gradient method. The injection carryover could be calculated by
subtracting the carryover values calculated by the duplicated solvent gradient method from the carryover values calculated by the blank injection. Thus, the method might be useful to compare the carryover in autosamplers.
The carryover of the injection operation in the autosampler was investigated. The average relative carryovers were calculated for 6 repeated injections of the standard sample solution and blank sample solution. The standard sample solutions were the same as those described in the previous section. The GL-PE column was used for these experiments.
Results and Discussion
Evaluation of prepared columns
The theoretical plates of the three kinds of columns made from different materials were measured as a quality control measure, before evaluating the column material, using an optimized Shimadzu Prominence 20A series semi-micro LC. Naphthalene was used as the sample to measure the plates and tailing factor (TF), and uracil was used for measuring the void volume. The relative standard deviation of the TF of naphthalene in 6 columns containing the same material ranged from 1.0 to 2.7%, and all columns exhibited a TF ranging from 1.02 to 1.11 with 12400 to 14000 plates. The number of theoretical plates in the S-S column was the greatest among all of the columns. The retention time of uracil in the S-S column was 1.55 min, and that in the GL-PE and GL-PEEK column was 1.45 min. This difference was caused by the column volume, since the retention times in all GL-columns were the same.
Improved adsorption of phosphorylated compounds in the LC/ MS/MS system
When configuring the MS conditions upon flow injection, tailing peaks of the phosphorylated compounds were detected. Since this was considered to affect the interaction between the metal and them, the tubing between the autosampler and the column was replaced with 650 mm × 0.075 mm nanoViper tubing (Thermo Scientific, Bremen, Germany), and the tubing between the column and MS/MS was replaced with 650 mm × 0.075 mm PEEKsil tubing. In addition, the stainless-steel electrode in the Turbo V Ionsource was replaced with a PEEKsil hybrid electrode. The inner surface of the hybrid electrode was made from fused silica capillary, and the peak shape was significantly improved as compared to that of the stainless-steel. The phosphorylated compounds were reported to interact with the stainless-steel commonly used in LC/MS systems, which likely caused the severe peak tailing.20
Carryover by the duplicated solvent gradient method
The carryovers observed from all samples in the duplicated solvent gradient method did not include those of the blank sample injection. These corresponded to the sum of the carryover of the tubing in the flow path and the column, including the packing materials and the hardware.
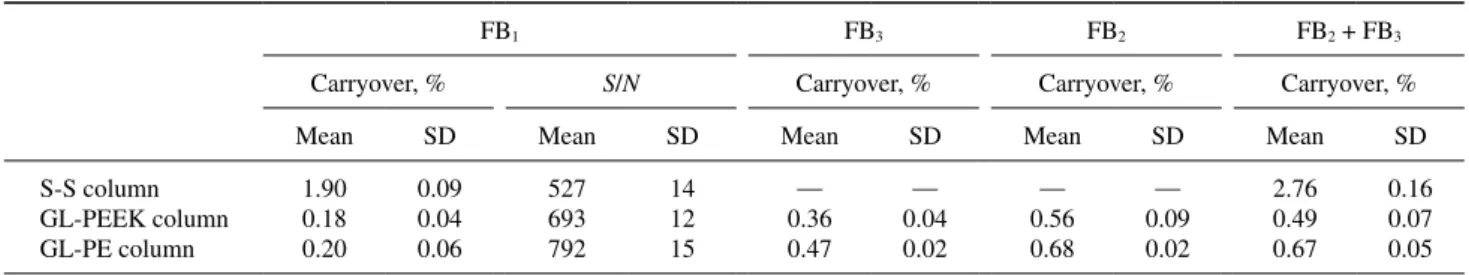
The carryover values of FB1 in the S-S column were about 10-times greater than those in the other columns (Table 2a). If the peak separation was not sufficient, calculating the peak area was difficult due to the identical SRM transition of FB2 and FB3. Figure 2 shows the expanded SRM chromatogram of the FBs. The leading peaks occurred in the carryover peak with the S-S column, and the separation of FB2 and FB3 could not be achieved and the peak areas could not be calculated. Thus, we calculated the carryover values using the sum of the peak areas of FB2 and FB3. Leading peaks were not observed with the other columns. Table 1 MS/MS parameters and values of samples
Parameter Fumonisins Phosphorylated peptides FB1 FB2 and FB3 T18p T19p Declustering potential/V Entrance potential/V Collision energy/V
Collision cell exit potential/V Dwell time per transition/ms
101 10 39 62 100 66 9.5 39 56 100 40 4 20 25 100 40 3 20 23 100
The S-S column showed a tailing peak that eluted in the first solvent gradient, while the other columns showed sharp peaks. These results were mainly due to the difference in metal ions on the inner surface of the column hardware.15 Since metal ions hardly exist on the inner surface of the GL-PEEK and GL-PE columns, the FBs were not adsorbed. The signal-to-noise ratio (S/N) of FB1 in the GL-PE column was highest among all columns. Metal ions hardly exist on the inner surface of the GL-PEEK and GL-PE columns; however, a good performance was obtained when the GL-PE column was used. The polarity of the PEEK and PE frits likely differed. The latter could not entrap FB1, since the difference in the polarity between FB1 and the PE frits was larger than that between FB1 and PEEK frits.21 PE is highly hydrophobic, and powders were used as packing materials in reversed-phase LC.22
The retention times of the carryover peak of FBs were in agreement with those obtained by adding the start time of the second solvent gradient to the retention time of the peak in the first solvent gradient. This indicated that FBs were adsorbed in the tubing and/or in the inlet of the stainless-steel frit.6 In addition, the carryover peaks of FBs showed severe leading, indicating that the samples eluted at shorter retention times. Therefore, the carryover occurred in the column.6 We considered that the carryover in the leading peaks was due to the adsorption of FBs on the packing materials, chromatographic tube, and/or outlet frit of the column made of stainless-steel. However, since the other columns did not show the leading peak, the packing materials could be excluded. The carryover was caused by the chromatographic tube and the inlet frit because sharp peaks were obtained with the GL column.
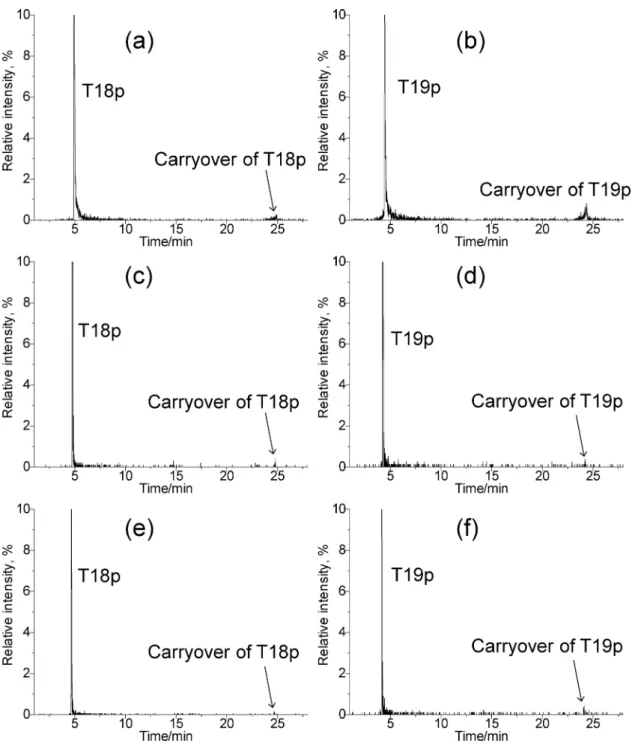
With regard to the carryover observed with phosphorylated peptides, the values and the peak shape of the carryover peaks were similar to those of the FBs. The carryover of T19p with the GL-PE column was reduced to one-tenth compared to that with the S-S column (Table 2b). Figure 3 shows the carryover peaks for T19p, which were more asymmetric than those of T18p in all columns, likely because of stronger interactions between T19p and metal ions in the columns.14,23,24 The carryover peak in the S-S column showed leading. The carryover in the leading peaks was likely due to the adsorption
of T18p and T19p on the chromatographic tube and/or outlet frit of the column made of stainless-steel.
Calibration curve of standard samples in phosphorylated peptides
In bioanalysis, the peak area of a blank sample that follows an injection of ULOQ sample should be less than 20% of the peak area of the LLOQ sample.1,2 Therefore, the carryover should be reduced in order to expand the range of the calibration curve. As such, we investigated whether or not the column affected the calibration curves of the phosphorylated peptides.
When the S/N was less than 10, the concentration was excluded from the range. As a result, the calibration curve of T18p with each column could be prepared in the range of 10 to 500 fmol/μL. The range of T19p in the S-S column was from 50 to 500 fmol/μL, that in the GL-PEEK column was from 25 to 500 fmol/μL, and that of the GL-PE column was from 10 to 500 fmol/μL. Table 3 shows the parameters for each column in the calibration range. The parameters of T18p were slightly different from those of T19p. However, the slope of T19p with the GL-PE column was the greatest among those with all other columns, indicating a high sensitivity. The S/N of 50 fmol T19p in the S-S column was 11, that in the GL-PEEK column was 45; that in the GL-PE column was 82. The differences were likely related to interactions with the metal, as noted for the FBs.
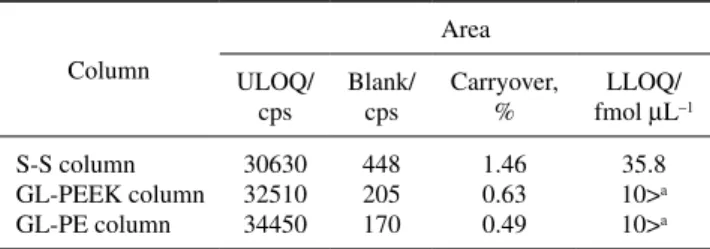
Next, the criteria of the carryover in bioanalysis were added to the results. When the ULOQ was set to 500 fmol, the LLOQ was calculated from the calibration curve of each column using the blank sample peak area. Table 4 shows the results. The carryover of T18p in the S-S column was 1.46%, and the LLOQ was calculated to be 36 fmol/μL. However, the LLOQ of the GL column was less than the value of the S/N. The carryover of T19p in the S-S column was 4.47%, and the LLOQ was calculated to be 126 fmol/μL. The adsorption of T19p by metal ions was estimated to be very high. Therefore, the carryover was high, and the LLOQ also increased. In contrast, the LLOQ of the GL-PE column was one-tenth that of the S-S column; the value was 13.4 fmol/μL. Since the GL-PE column and GL-PEEK hardly contain metal in the flow path, the LLOQ was low, and the range of the calibration curve was expanded. Table 2 Comparison of mean and SD of carryover by duplicated solvent gradient method and S/N using different column hardware Table 2a 1 mg/L fumonisins
FB1 FB3 FB2 FB2 + FB3 Carryover, % S/N Carryover, % Carryover, % Carryover, % Mean SD Mean SD Mean SD Mean SD Mean SD S-S column GL-PEEK column GL-PE column 1.90 0.18 0.20 0.09 0.04 0.06 527 693 792 14 12 15 — 0.36 0.47 — 0.04 0.02 — 0.56 0.68 — 0.09 0.02 2.76 0.49 0.67 0.16 0.07 0.05 Table 2b 500 fmol/μL phosphorylated peptides
Column
T18p T19p
Carryover, % S/N Carryover, % S/N Mean SD Mean SD Mean SD Mean SD S-S column GL-PEEK column GL-PE column 1.31 0.24 0.21 0.06 0.02 0.04 396 392 483 16 52 43 4.28 0.67 0.42 0.44 0.18 0.12 323 370 417 26 33 32
Injection carryover
The duplicated solvent gradient method and the blank injection method were used. The carryover values in the former method were calculated using the value without the blank sample injection, and the latter included the carryover of the blank sample injection. The differences corresponded to the carryover in the injection operation. Table 5 shows the carryover values of the injection operation calculated by these methods using the GL-PE column. The calculated carryover of the injection operation was not dependent on the type of column.
The carryover of FB2 by the blank injection method was 0.79%, and that by the duplicated solvent gradient method was 0.68%. This difference (0.11%) was due to carryover in the injection operation. Therefore, improvements in the flow path, including the inlet frit of the column, were more effective than those in the washing of the autosampler needle. Using the biocompatible-UHPLC and the conventional needle washing step, carryover of FBs hardly occurred. The carryover in the injection operation of T18p and T19p were 0.27 and 0.18%, respectively. The carryover might be improved by washing the Fig. 2 Expanded SRM chromatograms of fumonisins by the duplicated solvent gradient method. (a)
SRM chromatogram of FB1 using S-S column. (b) SRM chromatogram of FB3 and FB2 using S-S column. (c) SRM chromatogram of FB1 using GL-PEEK column. (d) SRM chromatogram of FB3 and FB2 using GL-PEEK column. (e) SRM chromatogram of FB1 using GL-PE column. (f) SRM chromatogram of FB3 and FB2 using GL-PE column.
autosampler.
Even though numerous reports indicated that carryover occurs in the autosampler and column, the percentages were not shown. If the carryover of FB1 and T18p were not caused by the GL-PE and GL-PEEK columns, the carryover was calculated by the duplicated solvent gradient method and corresponded to those of the tubing within the flow path. The carryover value of FB1 with the S-S column was 1.70% and that of the system was 0.23%. The carryover of T18p with the S-S column was 1.10% and that of the system was 0.49%. We found that the majority of the carryover in our system was due to the S-S column and the gradient method.
Table 3 Comparison of calibration curves obtained using different column hardware
Column T18p T19p Slope Intercept R2 Slope Intercept R2 S-S column GL-PEEK column GL-PE column 61.3 66.8 72.3 26 152 119 0.992 0.990 0.991 34.1 51.3 72.9 –167 –3 15 0.995 0.995 0.994
Fig. 3 Expanded SRM chromatograms of phosphorylated peptides by the duplicated solvent gradient method. (a) SRM chromatogram of T18p using S-S column. (b) SRM chromatogram of T19p using S-S column. (c) SRM chromatogram of T18p using GL-PEEK column. (d) SRM chromatogram of T19p using GL-PEEK column. (e) SRM chromatogram of T18p using GL-PE column. (f) SRM chromatogram of T19p using GL-PE column.
Conclusions
The use of a GL-PE column improved the peak shape and carryover more effectively than the other columns. The GL-PEEK and GL-PE columns greatly improved the carryover of fumonisins and phosphorylated peptides, and the carryover of FB1 could be reduced to 1/10. In addition, the duplicated solvent gradient method could be used to evaluate the column carryover. The use of GL-PEEK and GL-PE columns also improved the LLOQ of phosphorylated peptides, and the range of the calibration curve could be expanded. Since carryover peaks in the GL-PE column were symmetrical peak of the samples, carryover did not occur in the column. The carryover calculated using the duplicated solvent gradient method corresponded to that within the tubing within the flow path. The carryover value of FB1 in the S-S column was 1.70% and that of the system was 0.23%. That of T18p in the S-S column was 1.10% and that of the system was 0.49%. We found that the majority of the carryover in our system occurred due to the
S-S column and the method.
References
1. EMA, Guideline on the validation of bioanalytical methods, EMA/CHMP/EWP/192217/2009 Rev.1 Corr., 21 July, 2011.
2. US FDA, Guideline for Industry; Bioanalytical Method Validation, Draft, September, 2013.
3. C. Chassaing, J. Luckwell, P. Macrae, K. Saunders, P. Wright, and R. Venn, Chromatographia, 2000, 53, 122. 4. S. Dolman, S. Eeltink, A. Vaast, and M. Pelzing, J.
Chromatogr. B, 2013, 912, 56.
5. R. ter Heine, C. G. Alderden-Los, H. Rosing, M. J. Hillebrand, E. C. van Gorp, A. D. Huitema, and J. H. Beijnen, Rapid Commun. Mass Spectrom., 2007, 21, 2505. 6. N. C. Hughes, E. Y. Wong, J. Fan, and N. Bajaj, AAPS J.,
2007, 9, 353.
7. J. W. Dolan, LC GC North Am., 2001, 19, 164. 8. J. W. Dolan, LC GC North Am., 2001, 19, 478.
9. P. T. Vallano, S. B. Shugarts, E. J. Woolf, and B. K. Matuszewski, J. Pharm. Biomed. Anal., 2005, 36, 1073. 10. R. P. Grant, C. Cameron, and S. Mackenzie-McMurter,
Rapid Commun. Mass Spectrom., 2002, 16, 1785.
11. K. W. Dunn-Meynell, S. Wainhaus, and W. A. Korfmacher, Rapid Commun. Mass Spectrom., 2005, 19, 2905.
12. A. Schellen, B. Ooms, D. van de Lagematt, R. Vreeken, and W. D. van Dongen, J. Chromatogr. B, 2003, 788, 251. 13. Y. Asakawa, C. Ozawa, K. Osada, S. Kaneko, and N.
Asakawa, J. Pharm. Biomed. Anal., 2007, 43, 683.
14. M. Tamura, K. Matsumoto, J. Watanabe, J. Iida, Y. Nagatomi, and N. Mochizuki, J. Sep. Sci., 2014, 00, 1. 15. Shimadzu Technical Report, Vol. 17, http://www2.
shimadzu.com/applications/lcms/Shimadzu_TechReport_ Vol17_LCMS.pdf.
16. M. Tamura, A. Uyama, and N. Mochizuki, Anal. Sci., 2011, 27, 629.
17. T. Gazzotti, E. Zironi, B. Lugoboni, A. Barbarossa, A. Piva, and G. Pagliuca, Food Chem., 2011, 125, 1379.
18. D. H. Vu, R. A. Koster, A. M. A. Wessels, B. Greijdanus, J. W. C. Alffenaar, and D. R. A. Uges, J. Chromatogr. B, 2013, 917, 1.
19. W. Zeng, D. G. Musson, A. L. Fisher, and A. Q. Wang, Rapid Commun. Mass Spectrom., 2006, 20, 635.
20. A. Wakamatsu, K. Morimoto, M. Shimizu, and S. Kudoh, J. Sep. Sci., 2005, 28, 1823.
21. H. Sakamaki, T. Uchida, L. W. Lim, and T. Takeuchi, J. Chromatogr. A, 2015, in press.
22. Y. Shioi and S. I. Beale, Anal. Biochem., 1987, 162, 493. 23. S. Liu, C. Zhang, J. L. Campbell, H. Zhang, K. K. C.
Yeung, V. K. M. Han, and G. A. Lajoje, Rapid Commun. Mass Spectrom., 2005, 19, 2747.
24. T. De Vijlder, J. Boschmans, E. Witters, and F. Lemiere, Int. J. Mass Spectrom., 2011, 304, 83.
Table 4 Comparison of carryover and LLOQ of T18p (upper) and T19p (bottom) obtained using different column hardware
Column Area ULOQ/ cps Blank/ cps Carryover, % LLOQ/ fmol μL–1 S-S column GL-PEEK column GL-PE column 30630 32510 34450 448 205 170 1.46 0.63 0.49 35.8 10>a 10>a a. Less than the range of the calibration curve.
Column Area ULOQ/ cps Blank/ cps Carryover, % LLOQ/ fmol μL–1 S-S column GL-PEEK column GL-PE column 16940 25250 35080 757 206 211 4.47 0.82 0.60 126.3 25>a 13.4 a. Less than the range of the calibration curve.
Table 5 Comparison of mean of carryover (%) obtained using GL-PE column
Carryover FB1 FB3 FB2 T18p T19p By the blank injection
By the duplicated solvent gradient Injection carryover 0.23 0.20 0.03 0.53 0.47 0.06 0.79 0.68 0.11 0.49 0.21 0.28 0.60 0.42 0.18 These values are the average of the percent carryovers calculated by the blank sample and duplicated solvent gradient method.