Social Inequality among Sama-Bajau Migrants in
Urban Settlements : A Case from Davao City
(<Special Theme>Continuity and Reorganization
of Identities among the Transnational
Communities in East and Southeast Asia)
著者名(英)
Waka Aoyama
journal or
publication title
Hakusan jinruigaku
number
15
page range
7-44
year
2012-03
URL
http://id.nii.ac.jp/1060/00002420/
Creative Commons : 表示 - 非営利 - 改変禁止
http://creativecommons.org/licenses/by-nc-nd/3.0/deed.ja
Hakusan Review ofAnthropology Vol.15. March,2012
Social Inequality among Sama-Bajau Migrants in
Urban Settlements:A Case from Davao City
AOYAMA Waka★
Keywords:Social inequality, Sama-Bajau, migrants, urban settlements, Davao CityI INTRODUCTION
As the literature on the Sama-Bajau in the maritime Southeast Asia has revealed, the Sama Dilaut(the Sama of the sea)abandoned their boat-dwelling practices by the mid 20thcentury. They were said to be amalgamated into other Islamized groups within the
encompassing society, and it was indeed what happened to many former boat-dwellers inSulu Archipelago[Nimmo 2001;Sather 1997]. Armed conflicts in the region and the
fbllowing deterioration of peace and security order and economic hardship caused many Filipino Sinama-speaking groups of people to migrate, legally or not, down south across the border to Sabah, Malaysia [Kassim 2009].There were also other groups who fled Jolo, Siasi and Zamboanga to other places up north in Mindanao, the Visayas and Luzon. These people have cast an image of the“Bajau”as“beggars”in some cities, unlike their counterparts in Malaysia[Nagatsu 2001]. Little has been known about their life in non-maritime urban situations on the side of the Philippines. Although there is at least one documentary film on the Sama・Dilaut in the urban settlements directed by Nannette Matial in 2008, no sociological or anthropological studies have been made to describe their social and ethnic identities and everyday life in the urban market society, out of their sea-based histories. Given the current situation of the Sama-Bajau studies, the ultimate goal of my researchis to write an ethnography of the Sinama-speaking urban migrants in Davao City,
Mindanao, the Philippines, in order to explore how they have(re-)organized their life in “poverty”and become our neighbors, both literally and metaphorically in the urban market society in the globalized world. The present paper will focus the social inequality among★ 青山和佳,北海道大学大学院・メディアコミュニケーション研究院;Faculty of Media and
Communication, Hokkaido University, North-17, West・8, Kita-ku, Sapporo O60・0817, Japan/ e-mail:waka@imc.hokudai.ac.jp 7Hakusan Review ofAnthropology Vol.15, March 2012 them:Iwill speci丘cally study the community social status of households and the criteria that have been identified through their own eyes as members of the community. The analytical framework and method, which are to be detailed in the fbllowing chapters, are based on those originally suggested by Fr. Lynch[1959】to examine social class in a community in the PhilipPines. The bulk of the data fbr the present study had been gathered through a long-term 丘eldwork starting from 1998. This study aims to provide a small but a panoramic view of the Sama・Bajau community in question. It is also meant to search f()r units of observation and analysis more appropriate fbr further research, rather than the“village”or the“ethnic group”as a whole which had been often used as a unit of analysis when the Sama-Bajau still shared a limited number of sea-related livelihood(mostly fishing with boats). Now that the livelihood underlying their social and ethnic identities has clearly disapPeared in the context of Davao City at the turn of the 20th century, we need to find the units more relevant to understanding their way of life and its change. It should be noted here that it was problematic enough fbr me to actually identify who the“Bajau”or the Sama・Dila・ut・are in Davao City1). As you will find out later, the“Bajau”in the present study is actually a mixture of the Sama Dilaut(Sama of the sea), as I have mentioned earlier, and the Sama Deyaq(Sama of the shore), those who have always lived on the land instead of being“Sea Nomads”and who used to clearly segregate themselves from the fbrmer. Both of them, however, are identified as the“Bajau”in the urban milieu. Both call themselves the“Bajau”under many circumstances. So, in this paper, I will use the Sama, the Bajau and the Sama-Bajau interchangeably according to the context, while the identifications they used originally to refer to themselves in any specific context will be retained in case of quoting their own narratives. This research makes three contributions. As a community study of the urban poor, it offers an alternative research method which incorporates the norms and values of the people, rather than purely objective indicators such as daily income or consumption per
head, into the framework to analyze“diversity”as well as“commonality”within the
communityl In Sama Studies, it adds a unique comparison between the Sama-Bajau as non-“唐?=| 垂?盾垂撃?h, who struggle to create a unique subculture in given situations and the Islamized Sama in maritime Southeast Asia[Nimmo 2001;Sather 1997]. As a Philippine )18
It is spelled“Badjao”in Cebuano, a linga franca in the Visayas and Mindanao.AoYAMA:Social lnequality among Sama-Bajau Migrants in Urban Settlements study, it presents stories of marginalized minorities who are rarely seen in official parades of indigenous peoples in the town’s main streets, whose cultural traits are ignored because of having little social value to protect or market, but who are undeniably part of the Philippines as‘‘a singular but a plural place”[Steinberg 2000]. Following this introduction, this paper comprises the five chapters namely Question, Setting, Method, Findings and Conclusions.
II THE QuESTION
1. Literature review:social inequality as a subjective ranking of social status Social class and social stratification have been one of the primary concerns in sociology. Empirical studies in industrialized countries such as the United States and Japan abound. In cases of developing countries including the Philippines, a wide disparity between haves and have-nots has been one of the central issues in social studies. Such researches, whether conducted in developed countries or in developing countries, normally utilize the results of large・scale national survey conducted by public and private institutions. In either case, however, investigations into social status among people in specific sectors of a nation are scarce. Furthermore, when it comes to“disadvantaged”groups such as indigenous peoples and ethnic minorities, the image of an“egalitarian and homogenous”society can often gloss OVer UnCOmfOrtable realitieS. Fr. Frank Lynch was the first anthropologist to conduct a community-based study on social class in the Philippines in 1950s. He chose a lowlander Christian society in a town called Canaman located in the rice・growing Bicol Province of the southern Luzon. He stayed 20months to gather empirical data in the area. Acomm皿ity can be divided into:1)Political,2)Economic occupational and 3)Social classes. Social classes are the most popular and most ambiguous among the three because the value scale is not simple Iike those of political and economic occupational classes. Lynch’s major contribution lies in the丘rst apPlication of a method that produces a composite scale to empirically analyze a social class in the Philippines. In the case of“social classes,”Lynch stresses,“the individual is being rated on many scales simultaneously;he is being considered according to his position in the economic and political power systems, the occupational structure, the community scale of moral behavior, and other related scales” 9Hakusan Review ofAnthropology Vol.15, March 2012 [Lynch 1959:8]. Based on the results, he wrote Socia/Class 1[刀aBiko11わ㎜[Lynch 1959], which revealed that there were two social classes that complement each other in social, ecollomic and political relationship in the community. It also proved that such ranking of individual households was frequently related to the level of their wealth and economic security. The next important research on this type of social inequality in the Philippines was conducted by James F. Eder, who studied Cuyo migrants in a settlement in San Jose, a pioneer farming village located in Palawan lsland, in 1970s. His research resulted in a book entitled 閲o Sha」η Sueceθdタ :∠48打ヒrultui「al develoρment a刀ゴ soeial inequality on a 肪吻ine fi刀]ロtier[Eder 2009(1982)]. In his book he extended the method of analysis developed by Lynch, and recorded the emergence and institutionahzation of social inequality as he ranked social status in the lifetime of the single community. He provided a description of how the residents in the Cuyo settlement, which was initially homogenous both in economic and social aspects, grew unequal as they experienced development on the agricultural frontier over the years. His conclusion stressed the diversity of circumstances and the diversity of human motives and capabilities to explain the emergence of social inequalities. Both Lynch and Eder applied a research method that integrated quantitative data and qualitative data, utilizing sociological survey and anthropological observation』b measure the social status among the people in the communities, each of them carefully selected
members of the community as a rating panel and then took interviews with them
indiVidually. The raters were asked to place the families of the community in order according to their own criteria fbr higher and lower standing. In other words, such placement also used the subjective perceptions of the individual raters as“insiders”of the communities rather than used only objective indicators such as the level of income. Most importantly, the concept of social status in the two studies was presented as a composite scale that integrated various subjective infbrmation each“insider”rater provided about the social status of the rated members;it was not considered as something measurable by a simple and single index such as wealth, income and prestige. In this sense, the measurement of social status suggested in their studies can be called“total status judgment,”or“overall social standing.” This method has two advantages in the measurement of social inequality:(1)Since it emphasizes the subjective judgment of the people in specific milieus, it helps reduce theAOYAMA:Social Inequality among Sama・Bajau Migrants in Urban Settlements possibility fbr the researcher, who comes from a different culture as well as has been trained in a particular academic discipline, to naively choose a priori indices inappropriate fbr the measurement of well-being among the people in the research site;and(2)generating asubjective and composite scale of social status, it enables the researcher to comprehend the sense of social inequality among the people from multiple perspectives including both economic and non-economic ones. This method is of course not problem・free. And its weakness lies in its strength:the subjective and composite scale obtained from data analysis cannot be immediately broken down into single indices in an attempt to“reconstruct”the studied society in a more “objective”description. As Lynch and Eder carried it out, however, this problem could be solved through a careful collection of the criteria the raters used for placement. The diverse criteria suggested by the rater could be aptly reduced to a certain number of categories, each of which is given weight according to the number of the raters who employed the same criterion or those similar in essence. These procedures will reveal the categories behind the ranking of social status among the members in the community. With these categories, the researcher is ready to examine the values and norms embedded in the community and therefore regulate the behavior of its members. Although this method may appear primarily quantitative in data collection, it does require a certain degree of rapport to be established between the researcher and the researched. As the method is meant to explore the subjective evaluations of their well-being in everyday life, integration into the community is essential fbr the researcher throughout the course of the research, which includes design, implementation, data analysis and its interpretation. Both Lynch and Eder demonstrated in their studies that the method will be most applicable when properly combined with other data collected about the community from related aspects. Such data will be also helpful to understand the context in which the subjective scale on social inequality is analyzed and interpreted. Thus, it is fundamental to collect background inf()rmation of the community, including socioeconomic characteristics of households, prior to the implementation of the social inequality survey. 2.Analytical framework:definition of key words and key hypotheses of this study To make it clear, the study reported here is f()cused on the social inequality among the Sama-Bajau in urban settlements in Davao City, the Philippines. As to the definition of the keywords, this study丘)llows those suggested by Lynch[1959]: 11
Hakusan ReView ofAnthropology Vol,15, March 2012 1.“Social status”of individuals means the subjective rating given by the rater. Then individuals may be arranged according to social status in a kind of continuum, or in ‘‘窒≠獅汲奄獅〟D” 2.Systems of“social stratification”should be distinguished from systems of ranking: the former are present only where there are at least two separate strata with a qualitative difference between them. 3.Systems of“social stratification”here are called systems of“social inequality” featuring strata culturally recognized as qualitatively distinct. 4.One kind of stratification is“class,”which“may be de丘ned as a system of social inequality featuring two or more qualitatively distinct orders of people ranked as superior and inferior, with relative ease of mobility between these two.” 5.The“inequality”have three dimensions;namely, the political, economic occupationa1, and the social. Now, to explore the social inequality in the Sama-Bajau community in the research site, 1 wil1 state the matter more concretely, and in the fbrm of hypotheses: 1.The community of the Sama-Bajau in the research site is composed of individual households that can be arranged according to social status in a continuum, or ranking. 2.There is an implicit agreement among the raters that the community has at least a system of status ranking. 3.There are shared criteria among the raters丘)r the placement of the households such as social, economic and political categories.
III THE SETTING
This chapter summarizes the丘ndings from the fieldwork I carried out using separate butrelated approaches over thirteen months from February 1998 to March 1999. This
summary is aimed at providing the reader with background infbrmation about the research site aro皿d the time when I conducted a research on social inequality among them in 1999. Specifically, 1 gathered a baseline data through a household survey in the research site from February 2 to March 6,1999,0f which results will appear in the last part of this chapter. I have used ethnographic present to describe the Iocal contexts the Sama-Bajau in DavaoAOYAMA:Social Inequality among Sama・Bajau Migrants in Urban Settlements City were in during those days. 1.Impoverishlnent of the Sama-Bajau in T()day’s PhilipPines As we mentioned in the introduction, the“Bajau”in the urban contexts in the PhilipPines have been known fbr its impoverishment and marginalization. The name of the“Bajau” may be even used as a synonym of“beggar,”aderogatory term[Nagatsu 2001:226].Unlike the Sama Dilaut in Malaysia, the Sama in the Philippines lacks an official vehicle fbr upward social mobility2). Government policies fbr ethnic minorities in the Philippines are considered rather advanced in Southeast Asia. As a normative framework, the 1987 Constitution stipulates that the rights of indigenous communities and cultural minorities and their diversities should be respected 3). As an institutional framework, the nation is known f()r its “Indigenous Peoples Rights Act of 1997”(Republic Act No.8371), which acknowledges the rights of such communities to their ancestral domains. Moreover, an autonomous region has
been officially created fbr Muslims in the Southern Philippines, aside from an
administrative region in Cordillera inhabited by other ethnic minorities. Despite the establishlnent of these f{)rmal frameworks, most of the ethnic minorities are still tantalizingly out of the reach of the benefits of social integration[UNDP 2004:68]. This is partly because these frameworks implicitly set the prerequisite of community organization befbre they can exercise their rights as individual members of a minority group moving towards social integration. In addition, it requires a considerable amount of documentation to complete the procedures, which people with disadvantage in educational attainment would丘nd it virtually impossible to process by themselves without support from concerned parties such NGOs. In reality, there are quite a few groups of ethnic minorities who find it hard to organize themselves and stand up f()r their rights. One of them is the Sama・Bajau in urban settings.It has been often noted that social organizations among the Sama・Bajau are
comparatively loose and transient with leaders who individually lead only a small number of families. However, recent studies by Nagatsu on the仇晦α(or Bajo)in Indonesia have 2) Conversion to Islam, however, has led to reconfigure their identities as“legitimate Malay”and concomitantly proVided them a strong vehicle to move upward in the local society[Nagatsu 2001]. 3) For reViews on normative and institutional frameworks of the state policies f()r indigenous peoples in the Philippines, see ILO[1993],Eder and McKenna(eds.)[2004]. 13Hakusan ReView ofAnthropology Vol.15, March 2012 reported the emergence of alliances that bring scattered Sama communities in different islands together and form a social movement, in response to changing incentives in local politics and interventions by international NGOs such as WWF4). Such movement cannot be seen among the people called the“Bajau”in the urban areas of the Philippines.
2.The Sama in Davao City
Furthermore, it is difficult丘)r the government to provide protection fbr the“Bajau”in the urban contexts, including the present case in Davao City. Most of them are originally refugees, who且ed their home waters or lands due to the deterioration of peace and order and the subsequent economic predicaments in Sulu and Zamboanga regions. Davao City is we11-known fbr its ethnic diversity, which is considered as a major resource f()r its regional development in tourism. For instance, the city annually celebrates “Kadayawan,”which is a fもstival featuring the diversity of local ethnic and cultural communities with various kinds of presentations such as parades in the streets and handicrafts in trade fairs、 However, it does not seem that the Sama-Bajau in Davao City is fully recognized as such an ethnic minority with such“marketable”cultural resources. People tend to think that the“Bajau”poverty is due to their‘‘laziness”or‘‘apathジ’In fact, people commonly adopt a negative image of the“Bajau”way of life and attitudes and attribute their poverty to‘‘poor”or“bad”culture. In this social milieu, even if the Sama-Bajau were selected as a target group fbr any poverty eradication program of the government, it might be simply treated as part of the urban poor with no specific cultural tralts to apPreclate. Besides, resources f()r the urban poor are not only limited but also unevenly allocated. Because most of the Sama・Bajau still do not vote, they lack connections with politicians and this deprives them of access to various resources. Small in number and politically unimportant, the Sama-Bajau are disadvantaged in competing with more dominant ethnic groups over the distribution of the government budget and resourees that aid agencies from the outside bring in. 4) Apresentation of Dr. Nagatsu Kazufumi(T()yo University)titled“An Incubation Study on Social Dynamics of the Maritime Southeast Asia:Focusing on the Population Flow and the Making of Sea Folks,”at the Annual Report Meeting of FY 2010, lnternational Program of Collaborative Research, Center for Southeast Asian Studies, Kyoto University, March 24,2012.AOYAMA:Social lnequality among Sama・Bajau Migrants in Urban Settlements 3. Research Site Davao City is located on Mindanao lsland in the Southern Philippines(Figure 1). Blessed with natural resources(e.g. minerals, and farm and marine products)and other natural advantages in Mindananao5), the city is known as a center of the development in the region, serving as one of the leading Production bases of agri-industry and also as a major trade-oriented port city in the country. As of May 2000, it was home to a population of approximately 1.15 million people and ranked fburth in size as a single chartered city nationwide and the丘rst in Mindanao. With relatively stable peace and public order, Davao City absorbs migrants and refugees from trouble-plagued areas such as the southwest regions of Mindanao and other inland regiolls, where political stability is yet to be seen. During the 1970s, the armed con且ict between the Philippine government and the Muslim separatists reached a peak;it ravaged local communities, resulting in the evacuation of the people from Zamboanga and Sulu to other cities like Davao. Some of the pioneer migrants to the research site in our study were refUgees at that time. Due to the destabilized political situation and the accordingly deteriorating economics in those areas, people continued to flock to Davao City. The“Bajau”and their Muslim neighbors in the present paper can be equally considered as refugees in this sense. They both f()rm, more or less, the urban poor problem in the local context of the city.
Egure 1 Map
5) Including the Sulu Archipelago.15
Hakusan Review ofAnthropology Vol.15, March 2012 N
w‘L
〈’v・’”SibutY L二__」㌢
The research site is situated in an islet called‘‘Isla Bella6),”which is a squatter area on the eastern shore of the city. The government was planning to release the ownership of the land to the residents at the time of our research. As of 1997, the islet had an area of about nine hectares. The estimated number of households was 1,300 with a population of about 10,000people. By ethno-linguistic grouping, approximately 60%of the total population belonged to major Muslim groups(e.g. Maranao and Tausug). In・other・words, the Muslims were the majority in the“Barangay”(the smallest administrative unit in the Philippines), although in the larger context of Davao City they were extremely small in number against Christian populations(mostly the Cebuano)7). Indeed, the Captain and seven of the Barangay Councilors were the Maranao, and the area was known as a Muslim-dominated area in the city.We attempted complete enumeration of the 184 households in two Sama-Bajau
))
ハ07
Some of the names of indiViduals and places are changed for the protection of privacy. According to“Ethnicity”(self-claimed)in the 2000 population census, Cebuano accounted for 33.32%of the total population of 1,145,033 in Davao City. Meanwhile, of the three major Muslim groups in the Philippines, the Tausug only accounted fc)r O.79%and the Maranao O.66%, and the Maguindanao accounted f()r O.17%. By the way, although the accuracy of the survey is doubtfu1 in comparison to the population of the study site, the Bajau(Sama.Di7aut)accounted for O.08%(928 people)and Sama Dilaya O.0024%(28 people)[NSO 2000】. In the context of Davao City, non-Christian populations are considered as minorities. In terms of indigenicity in Davao, Christians originally from North(the ethnic Cebuanos mostly), lowland Muslims(the Maranao and the Maguindanao),other ethnic groups from Zamboanga and Sulu(the Sama, the Laminusa and the Tausug)are should be categorized all as migrants[Hayase 2007].AoYAMA:Social Inequality among Sama-Bajau Migrants in Urban Settlements setlements(of which 172 households are from the area called Macao8), and 12 households from China Pikas respectively). T()make it a comparative study, we also collected data of
the entire 180 non-Bajau households in non-Bajau dominated communities g). The
Sama-Bajau settelements embrace a population of 981(of which 51.7%were male,47.5% female and O.8%unknown), while the non-Bajau settlements,1,044(48.1%male,51.5% female and O.8%unknown). The non-Bajau consist of f()ur groups, namely, the Cebuano, Tausug, Maranao and Laminusalo). The Cebuano are Christians, whereas the latter three are Muslims. The Sama-Bajau consist both land-based and originally-sea-based Sinama speaking groups from various places, mostly from the region of Zamboanga del Sur with some from that of Sulu. While Table l and Table 2 summarize the key socioeconomic characteristics of the residents in the two settlements, we will f()cus on their livelihood in the next chapter f()r the purpose of this study. The shift of livelihood is one of the major changes they have experienced as they migrated to the city. It also helps us understand their confinement to the marginalized segment of the urban labor market. 4.The Sama-Bajau as the Urban Poor(at the margin of the urban labor market) It is fbund in our 1998/99 household survey that one of the significant differences in socioeconomic characteristics between the Sama-Bajau and non-Sama-Bajau is educational attainment. The data f()r this item was collected only from the respondents of age 7 and over. Among the Sama-Bajau, the average length of schooling is 1.2 years f()r male(with the mode of O year)and O.9 year for female(with the mode of O year). In other words, most of the Sama-Bajau respondents never attended school, while a number of the non-Sama-Bajaurespondents at least丘nished elementary school(6 years). On top this disparity,
improvement in educational attainment over generations, which is common among the
non-Sama・Bajau, could not be seen among the Sama-Bajau. 8) The name of the area inhabited by the Sam in Isla Bella. 9) The data on non-Bajau were collected from all the households in the two areas named“purok”(this Barangay is divided into seven puroks):one is adjacent to Macau;and the other includes China Pikas. 10)The Laminusa also belong to the Sama ethno・1inguistically. They are a subgroup of the land・based Sama from Siasi. In the research site, though, they often tried to explain to us that they were different from the “Bajau”by emphasizing that they practice Islam. Compared to the selfidentified “Bajau”indeed, fewer houses owned by Laminusa were built along the coast. They also had relatively higher educational attainment. 17Hakusan ReView ofAnthropology Vol.15, March 2012 Table 1 Basic Attributes of Sama-Bajau Residents in Isla Bella(Macao and China Pikas) Number ofhouseholds and population Total number ofhouseholds 184 (Macao) (172) (China Pikas) (12) Average number ofhousehold members 5.3 Average number ofchildren per household
35
Total population 981 Gender(ratio to the total population) Male 5L7% Female 47.5%Age
Male Femaleve「age age 22.3years old 22.8years old
Age distribution(ratio to the total population) 0-6years old 2LO% 22.1% 7-15years old 20.4% 16.6% 16-29years old 29.4% 325% 30-49years o[d 20.6% 2L7% 50years old or up 8.6% 7.1% Educational attainment(question intended only fbr
respondents seven years old and up) Male Female
Average L2 years 0.9years
Mean
Oyear OyearSelf二identification(ratio to the total population)
Sama
97.8% (Land-based/5α〃1αDのノαg) (65.1%) (Sea-based/∫α〃20 Dj1αμり (32.7%) Laminusa 1.5% Cebuano 0.5% Ata 0.1% Tausug 一 Marano 一 Others 一 Religions and behefS(rat▲o to the total population) Ancestor worship(mbog) 80.3% Musli 10.8% Christia 8.9% (Pentecosta1 (4.8%) (Roman Catholic and others (4.1%) Place of birth(ratio to the total population) Other than Davao City 68.7% Davao City 31.3% Note:total may not be 100%due to the exclusion ofunknown answers. Source:1998 household survey conducted by the author.A°YAMA:S・・i・I I・・q・・lity・m°ng Sama’Bajau Mig「ants i” U’ban Sgttlements Table 2 Basic Attributes and Migration History of Sama-Bajau Household Heads Tbtal number of households 184
Gender
Male
89.1%Female
10.9%Age
Average
40.Oyears oldMedian
35.5years oldMode
25.Oyears old Place of b輌rth Davao City 5.4% Places other than Davao City 94.6%Migration history (N=170migrants) Number of trans企rs with change of“home”address
Average
.P.4tlmes Place of birth(Province) Zamboanga del Sur 78.7%Sulu
12.6% Bohol/Cebu/Surigao City 3.9% Other provinces in Mindanao 3.5%Others
12%
Place of theprevious residence befbremoving to the present address(Province)
Zamboanga del Sur 74.7%
Sulu
9.2%Davao City and Davao del Sur 8.0%
Other provinces in Mindanao 2.3%
Cebu/Surigao City 2.3%
Metro Manila
and its neighboring areas 2.3%Major reason丘)rtransfbr f士om the place of birth
Deterioration of security situations 66.7% Hardship of lifb 14.4%
Invited by relatives who had already migrated to other places 8.6% Looking丘)r livelihood 3.3%
Marriage
2.9%Looking fbr housing 12%
雄ected by tidal waves 0.6%
Main channel to gather infbrmation about the present address befbre transfbr
Through family and relatives 82.8% Directcontacts(pioneer migrants) 14.9% Through friends and neighbors 2.3% Year of transfbr to the present address 1965・1969 1.1% 1970・1974 9.7% 1975-1979 8.0% 1980-1984 10.2% 1985’1989 14.8% 1990-1994 30.7% 1995・1999 25.6% Note:total may not be 100%due to the exclusion of unknown answers. Source:1998 household survey conducted by the author.
19
Hakusan Review ofAnthropology Vol.15, March 2012 This disadvantage of the Sama-Bajau against the non-Sama-Bajau in educational background may be directly reflected in its inability to gain employment in the local
government, given its comparatively poor human capital and low level of potential
productivity. While the non・Sama-Bajau experience the diversi丘cation of livelihood after he/she migrates to Davao City and are gradually absorbed in the urban Iabor market, the Sama-Bajau goes through only a limited and slow shift of livelihood. Most of the household heads were fishermen in their places of origin(71.4%of the respondents), and even after they came to the city, the ratio decreased rather slowly:51.2%of the Sama・Bajau household heads claim to be still engaged in fishing in our survey. In addition, intergenerationaloccupational mobility is extremely low among the Sama・Bajau compared with the
non-Sama-Bajau. Nevertheless, some of the Sama-Bajau household heads shifted their livelihood from fishing to non-fishing activities、 The Sama-Bajau, working in non-agricultural sectors concentrates on the self-employment sector:33%of the households reportedly run some kind of business of their own(“nigosyo”)、 This relatively high ratio of self・employment can be f()und in the non-Sama-Bajau households as well. It should be noted, however, that the variety of business is extremely limited in the case of the Salna・Bajau. There are practically only two types of business:(1)shell and pearl vending(18.8%)and(2)used-clothing vending or‘‘ukay-ukay”in the local Cebuano language(9.4%). Another typical livelihood the Sama-Bajau engages in is mendicancy, or begging(5.9%). There are many public markets of various sizes in major population areas of Davao City where various kinds of fresh f()od are sold. This affluence in the local markets makes itpossible fbr the Sama-Bajau not only to beg f()r spare change but also fbr
about-to・be・discarded items:vegetables, fruits or fish no longer fresh enough to be marketable. Cassava and rice, their staple fbod, though, have longer shelf lives and cannot be procured from begging. In reality, there are obviously more Sama-Bajau beggars than our questionnaire survey grasped, and most of them roam the markets and streets begging f()rtheir survivaL One of the factors behind this tendency lies in the decline of fishing among the Sama-Bajau. Unless he/she switches to another livelihood quickly, the line of least resistance would be fbr the individual members of the household to beg to make endsmeet somehow.
The disadvantage in the limited type of livelihood among the Sama-Bajau naturally con丘ne them to a lower socioeconomic status than the non-Sama・Bajau as shown in some20
AoYAMA:Social lnequality among Sama-Bajau Migrants in Urban Settlements indicators of economic standards of living. For instance, the average income per day of the household head from his/her main livelihood was 177.7 pesos among the non-Sama-Bajau, whereas it was only 153.9 pesos among the Sama-Bajau11). Other indicators including the level of expenditures, the access to the credit market, housing conditions and the possession of durable goods cのfirm that the Sama’Bajau are generally disadvantaged compared to the other ethnic groups.
IV THE METHOD
1.Characteristics of the SampleThis study follows the method of Lynch I1959]and Eder[2009(1982)]which we have
adapted to丘t the situation in our research site. First, we selected twenty individuals from twenty of the 184 households in the research site to fbrm a panel of raters. The selection rate we set was over ten percent of the total number of the households. Candidates fbr the raters were initially selected through three stratifications, namely:place of birth, livelihood(state of labor)and level of income, based on the results of the basic household survey conducted prior to this research(see theprevious chapter). Recent migrants(within six months)and temporary migrants were
exempted from the sample because of their limited knowledge about their neighbors. Then we talked to each of the candidates to make sure that he or she understood the nature of our interview and was willing to accept us as interviewers. We tried to secure raters from different age and sex categories. Consequently, we narrowed the nulnber of raters down to twenty f()r our interviews. The raters’characteristics are presented in Table 3. 11)As of November in 1999, the exchange rate was US$1=about P40(one peso is about three yen). The legitimate minimum wage in the non・agricultural sector was 158 pesos a day. The poverty line was defined as the level of income required to meet one’s nutrient requirements and other basic needs. As of 1997, the poverty line in the Southern Mindanao Region(including Davao City)was per capita annual income of 10,440 pesos. The date on the household income collected in our questionnaire survey should be considered to be higher than the actual level of income that the respondents were earning. This is partly because the data was gathered by self-assessment of each respondent, and also because we assumed in the quantitative analysis that the respondent could regularly earn the amount of the income they claimed. Through a long-term participatory observation later, we came to learn that the level of monthly household income(with more than one gainfUl earner)could widely vary from the maximum of 20,000 pesos(as an exceptional case) to the minimum of 2,600 pesos, 21Hakusan Review of Anthropology Vol.15, March 2012 The interviews were conducted from January 22 to April 27 in 1999. It had been one year and a half since I entered the research site with my research assistant, a native speaker of Cebuano who lived in an area adjacent to the research site in the same barangay. We already had a baseline data on demographic and socio・economic characteristics of the raters and the households to be rated. We had also been integrated into the community to the extent that we could exchange everyday conversation with the residents. Once the panel of raters was determined, we began to visit the twenty raters individually at their homes and ask them to rank their“Bajau”neighbors according to their Table 3 Socioeconomic Characteristics of the Raters
Frequency
Ratio 皿)tal 20 100.0%Gender
Male
11 55.0%Female
9 45.0%Age
20-29years old 5 25.0% 30-39years old 6 30.0% 40years old and up 9 45.0% Civil statusMarried
20 100.0% Place of birth(stratification fbr random selection 1) Rio Hond 5 25.0% Busbus!Jolo 5 25.0% Sangali 4 20.0% Margos sa Tubig 2 10.0%Taluksangay
1 5.0%Others
3 15.0% Status of laborllivelihood(stratification fbr random selection 2)Homemaker
5 25.0%Fishermen
4 20.0% “Ukay-ukaプ(secondhand clothes)vendors 4 20.0% Pearl and shell vendors 3 15.0%Mendicants
2 10.0% Mat weavers(fbr domestic use) 1 5.0%Unemployed
1 5.0% Level of income in the community・(stratification 長)rrandome selection 3) 50%(below 100 pesos) 8 40.0% 75%(100°200pesos) 5 25.0% 100% (above 200 pesos) 7 35.0% Note a:the quatile category the rater’s household belongs to in the distribution of household income per day in the studied community. Source:1998 household survey conducted by the author.22
AOYAMA:Social Inequality among Sama-Bajau Migrants in Urban Settlements social status. As the interviews were meant to be personally conducted, we tried to secure as much privacy as possible fbr each of our raters at the beginning. We were later to adjust this policy mainly because the one-room structure of most of their houses made it almost impossible to stop other members of the household, and sometimes their neighbors, who were curious to see what was going on, from sharing their own opinions, if not advices, on the ranking of their neighbors with our designated rater.
Consequently, some of the“persona1”judgments made by our individual raters
eventually turned out to be highly“collective”judgments. But as we will see later in this paper, the analysis of the data reveals that there is an implicit agreement among the raters, beyond the boundaries of households, that the community has at least a system of status ranking(our second hypothesis). Then we may presume the influence of the unexpected participation of non・raters in our interviews as minimum. In addition, we also learned through the interviews that the community could be divided into a certain number of groups according to their social status and that within the same group its members share certain criteria fbr social standing. In such a case, involvement of members from the rater’s household or from other households around it should not be taken as a major disturbance in our research. We had also to consider that most of the raters in our interview were illiterate. To make it easier f()r them to identify each household in consideration, we prepared index cards, each representing one of the 184 households in the research site and bearing the names of the members of the household、 Then we read out the cards to the raters so that they could place them in ranking according to their perceived social status. The fbllowing are the introductory questions that we asked each rater in our interview12): 1 Do you think that people are different from each other in any given place? This question is to confirm that each rater perceives the existence of differences among individuals in a particular location. Once the rater says yes, we proceed to the next questlon; 2. Do you think it is possible to rank some people in higher positions and others in lower positions? 12)The three questions below were originally asked in Cebuano, a lingUa franca in the Visayas and Mindanao, including Davao City.23
Hakusan Review ofAnthropology Vol.15, March 2012 This question is to confirm that each rater thinks he!she is able to express the difference among people in a system of status ranking. We also used simple gestures of moving our hands up and down to visualize the concept clearer to the raters. While all of the twenty raters agreed to the procedure, some asked questions about the researcher’s own criteria in status ranking:“What do you mean?Are you asking if some are rich and others are poor?Or any difference other than that?”In response to such questions, we replied that we wanted them to use their own criteria for ranking rather than ours and that we would ask them to explain their own criteria once their placement of the households was finished. 3.Who do you think is in the highest position? This question asks each rater to name the individual whom he or she thinks ranks highest in social status. After the rater answered, we picked the card with the name of the chosen person representing the household and handed it to the rater who placed it on the floor. This household represented the top starting point for the placement of the other households. 4. Is there anybody else who belongs to the same position as this person? If any other individual was chosen, the card of household that he or she belonged to was 丘led with those in the highest position, and they were put together as the highest group. Then we repeated the same procedures until no more names would be called out fbr this category. Thus the households that fbrmed the highest group were determined. After this, we proceeded with the selection of households next to the top using the same procedures repeating the same process to go on to the next group until all the households were divided into a certain皿mber of groups according to their positions in ranking、 Some of the raters fbund the standardized procedures described above rather difficult. So alternatively, we simply read out the names of husband and spouse, or if both or either of them were absent, the name of the person who appeared to be the head of the household, from the index cards、 The cards were numbered in sequence from number one to number 184according to the location of their dwelling in the research site. Thus, neighboring households, most of which were related to each other by blood or marriage, had numbers close to each other. Consequently, the raters who prefbrred the alternative procedure tended to divide the households into a certain number of groups first and then ranked the
24
AOYAMA:Social lnequality among Sama-Bajau Migrants in Urban Settlements households in the groups according to their social status13). Whether the rater preferred the first procedure or the latter, or mixed both in the course of our interview, it was clear that no rater opted to arrange all the 184 individual households from the first to the last places in a clear sequence. Instead, all of them finished the placement of the households in a number of small groups. The number of groups varied from two(high and low categories)to five(highest, high, middle, low and lowest categories). We shall call this number of groups in assessment the“number of placements”or“number of classi丘cations”in the following analysis. The raters were also encouraged to reconsider the grouping and ranking of the households by rearranging the households, sub grouping, or integrating two groups into one, etc. until they became satisfied with the results of their assessment. Households that the rater had too little knowledge about were carefully removed from the assessment.
Once the placement was丘nished, we confirmed the number of the assessment
categories that the rater used, and if the rater mentioned specific terms to refer to any of the categories, we collected those terms as well. Although we were constantly taking notes on the criteria f()r ranking the raters referred to during the placement process, we still f()rmally asked the rater to explain his or her criteria of higher and lower standings befbre closing our interview. We shall call this survey the‘‘social inequality survey”hereafter.V THE FINDINGS
1. Status classifications (1)Number of status classifications Through our interviews, it was clear that the community of the Sama-Bajau in the research site was composed of individual households that could be arranged according to social status in a continuum, or ranking. The total number of ratings possible was 20 raters x 184 households, or 3,680. The total number of ratings actually recorded was 3,365(9工4 percent). Missing ratings arose mostly because the rater did not know the household or had too little knowledge to make a placement(Table 4). 13)For more details, see Chapter V 3.(1)of this paper.25
Hakusan Review ofAnthropology Vbl.15, March 2012
Table 4 Twenty Status Classif]cations Number ofhouseholds placed in Tbtal
Number of Rate of
Rater
category households, モ≠狽?№盾窒撃? 1 2 3 4 5 classi丘ed placementa 1 3 36 43 103 . . 182 98.9% 2 3 20
45
117 . . 182 98.9% 3 3 12 61 104 参 ■ 177 96.2% 4 4 1466
49
55 ■ 184 100.0% 5 3 77 2384
一 一 184 100.0% 6 3 8 73 101 一 一 182 98.9% 7 3 9 82 63 ・ 一 154 83.7% 8 3 8 27 126 ・ 一 161 87.5% 9 347
5948
■ . 154 83.7% 10 4 16 56 75 33 . 180 97.8% 11 3 26 30 107 一 ■ 163 88.6% 12 4 34 6444
22 ◆ 164 89.1% 13 320
57 83 . 一 160 87.0% 14 2 147 37 . 一 ■ 184 100.0% 15 3 20 28 123 . 一 171 92.9% 16 4 11 14 97 95 一 177 96.2% 17 3 52 24 32 . . 108 58.7% 18 5 12 886
60 5 171 92.9% 19 396
30 37 ■ 一 163 88.6% .20
468
26
40
30 一 164 89.1% Ibtalb9L4%
Notes:a. Number of total households classified/total皿mber of households(184)tlOO b.Total number of scores actually recorded/total number of ratings possible de 100. Source:1999 social inequality survey conducted by the author. The rating procedure generated different numbers of status placement fbr each household, reflecting the difference in perception among the raters. However, thirteen out of the 20 raters(65.0%of the total raters)settled on 3 placements, while 5(25.0%)used fbur. The remaining two raters(5%each)reported 2 and 5 placements respectively. Table 4 compares their丘ve classiflcations. It is statistically proven that the rater’s income level was not correlated to the number of classifications he or she produced in the rating procedure. Prior to the selection of the raters, we had stratified the 184 households of the community into three categories by level of daily income(below 100 pesos,100 to 200 pesos and above 200 pesos, see Table 3), considering that one’s relative economic position may affect his or her perception of social status order in the community. Nonetheless, the result shows that regardless of their earning position, most of the raters, or eighteen out of the 20 in our sample, agreed to26
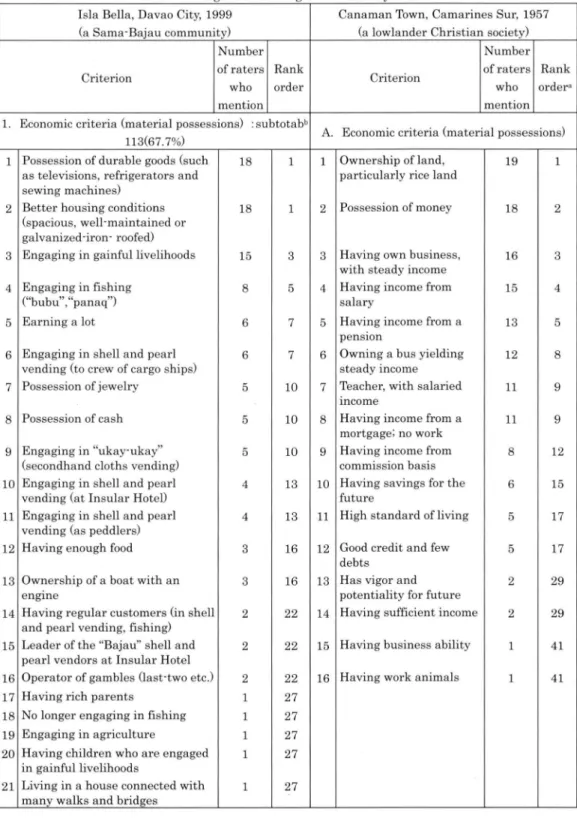
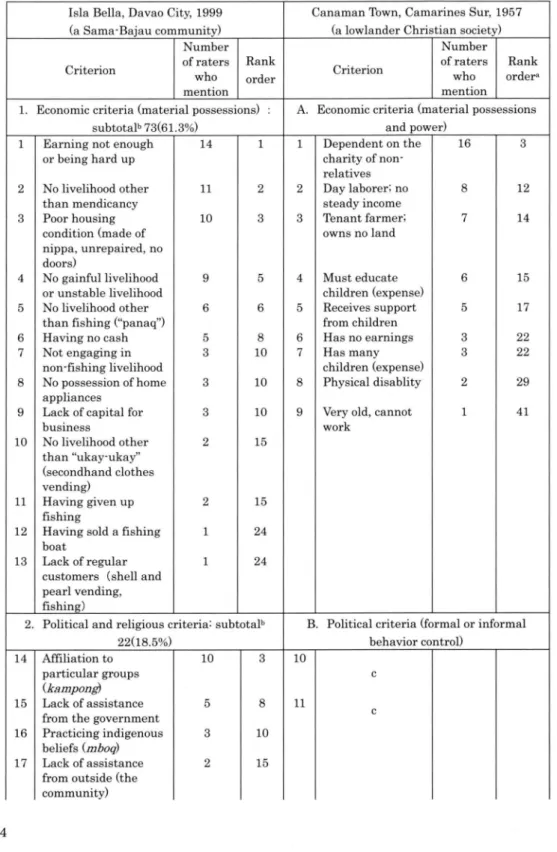
AOYAMA:Social Inequality among Sama-Bajau Migrants in Urban Settlements classify the households in the community into 3 or 4 groups according to their social status. It was also clear that the raters generally had knowledge about lifestyles of their neighbors. There were no correlations between the raters’attributes such as place of birth, 1ivelihood and level of income, and the number of the households they were able to evaluate in our interviews. As Table 4 indicates, nineteen of the 20 raters were able to evaluate the social standing of more than 80 per cent of the households in community. The only rater who had managed to place only 58.7 per cent of the households was a married male relatively old, estimated between late 50s and early 60s, among the raters. Even though he had resided in the research site fbr a decade by the time of our interview, the space and scope of his daily life was so limited that he was unconcerned with others beyond his relatives and neighbors close to his dwelling. (2)Naming of status classifications The descriptions that the raters gave to the social strata they identi丘ed imply that social ranking was perceived to be related to difference in economic status within the community. Sixteen out of the 20 raters used Sinama words such as“daアahan”(rich)and“miskin” (poor)to name the status classifications. Some of them prefbrred to apply more modified expressions such as‘‘sida daアahan”(the richest)to detail the di脆rences in strata they provided, especially if the number of strata they identified was three or more. Others employed slightly different vocabulary reflecting their places of origin. In addition, two of the remaining 4 respondents applied livelihood-related descriptions to name the social strata they recognized. One named the classifications from top to bottom according to livelihood group,(1)‘‘palangre”(line fishing)and‘‘bubu”(丘sh trap)fishing,(2) any kind of“negosyo”(small business),(3)“ukay・ukay”(secondhand clothes)vending, and (4)‘‘panaq”(spear gun)fishing. The other called each classification by the name of a person whom the rater identified as a leader of the group which normally composed of relatives and close neighbors, and engaged in the same type of livelihood. The rest of two referred to characters or personalities of people who belonged to each classification they set, using words meaning“kind”and“not kind.” 2.The composite status distribution The analysis of the data revealed the existence of an implicit agreement among the raters that the community had at Ieast a system of status ranking. This was statistically proven by the fbllowing procedures. 27
Hakusan Review ofAnthropology Vol.15, March 2012 As we have seen in the previous chapter, different raters employed different numbers of strata to assess the social status of the 184 households in the research site. The resulting twenty sets of status ratings were not immediately comparable to each other、 The first analytical task was to integrate these ratings on a“single objective scale”[Eder 2009 (1982):213]. In preparation for the analysis, I needed to test inter-rater agreement on the 20 sets of ratings. To do this 1 applied Kendall’s coefficient of concordance(Kendall’s W)14)to the data. The result showed that the test statistic W was O.82 with p=0.000<significant level O.05:it was proven that there is generally high agreement on the placement of the 184 households among the raters despite the difference in number of status strata identified by each rater and the difference in placement of each household he or she decided in the interview. Next I converted all raw scores to percentile scores and then averaged the twenty percentile scores for each household[Eder 2009(1982):213;Lynch 1959:95].This was done through the procedure described below. First, the percentile score, or the cumulative percentile rating, fbr each household by individual rater was calculated through the丘)llowing steps: (1)Counting the total number of households that a particular rater placed in each level on his or her own scale;(2)dividing the numbers obtained from(1)by the total number of levels that the particular rater employed in order to generate the percentile score f()r each household15);and(3)apPlying these steps to all the sets of the original ratings. Then, the mean status score, out through completing the steps: or the composite rating, f()r each household was figured 14)If the test statistic W is 1, then all the respondents have been unanimous, and each respondent had assigned the same order to the list of objects or concerns. If W is O, then there is no overall trend of agreement among the respondents, and their responses may be regarded as essentially random. Intermediate values of W indicate a greater or lesser degree of unanimity among the various respondents. 15)For example, let us consider a case in which a rater employs a f()ur’1evel classification to make a placement of 10 households. Suppose the rater placed two in the first group, two in the second, one in the third and five in the last. Cumulative number of households at the bottom is five. Likewise , the figures f()r the rest of the three levels from the bottom are 6(5+1),8(6+2)and 10(8+2) respectively. Therefore, the cumulative percentiles{for the f()ur levels are 50 percent(at the bottom), 60percent,80 percent and 100 percent(at the top), which are given to the indiVidual households in each group as its percentile score. This procedure assumes that all intervals on the individual scales had equal significance for the rater who made them[Eder 1982:213].
28
AOyAMA: Social lnequality among Sama-Bajau Migrants in Urban Settlements (4)Adding up the percentile scores of a particular household and divide the result by the number of raters who were able to make a placement on the household;and(5) apPlying the procedure to all the households in the data set. Then I plotted these scores as a fどequency distribution table with O.025 intervals. At a glance, there appears to be two prominent gaps at O.725 and at O.875. Given these two gaps as breaking points in the composite status distribution, the upper group would comprise 12.5percent of the 184 households in the research site, while the middle and the lower groups contain 29.9 percent and 57.6 percent respectively. As we have seen in the previous chapter, more than half of the raters also employed three status classifications in the placements they made. However, the establishment of breaking points in the composite distribution should be consistent with the other data collected through interviews and observations. T()choose the break, our next task is to examine the behaviors the raters showed in the course of rating procedures as well as the criteria of higher and lower social standings they employed. The breaking points should not only be statistically rational but also agreeable with their views and values expressed in their own words. 3.Placement behaviors and criteria (1)Placement behaviors among the raters In contrast to our expectation that the raters would evaluate individual households to make placements[Lynch 1959;Eder 2009(1982)], more than half of the raters in our sample initiated their rating procedures by sorting the households in the community into groups which they called“」kampong.”16)While the word“kampong’re丘rs to a village or hamlet in Malay, it was used in the丘)llowing definition by Bottignolo in his book: The group of persons with whom some kin relationship exists, whether traceable or not. The same term can be used with reference only to the local cluster of kin households [Bottignolo 1995:266]。 In other words, the social status ranking was not particularly made on the basis of the 16)The relevance of this term to refer to the groups in the given context was conf]rmed through interViews with some of the key informants when the author visited the research site in March 2012.The term was explained, though, to basically mean”relatives”in the Sinama language used in the area. 29
![Table 4 Twenty Status Classif]cations Number of households placed in Tbtal](https://thumb-ap.123doks.com/thumbv2/123deta/10041647.1443450/21.751.112.665.136.584/table-twenty-status-classif-cations-number-households-placed.webp)