Title
The Effect of Water Deficit in Typical Soil Types on the Yield
and Water Requirement of Soybean (Glycine max [L.] Merr.) in
Indonesia( 本文(Fulltext) )
Author(s)
ROSADI, Raden Ahmad Bustomi; AFANDI; SENGE, Masateru;
ITO, Kengo; ADOMAKO, John Tawiah
Citation
[Jarq-Japan Agricultural Research Quarterly] vol.[41] no.[1]
p.[47]-[52]
Issue Date
2007-01
Rights
Japan International Research Center for Agricultural Sciences (独
立行政法人国際農林水産業研究センター)
Version
出版社版 (publisher version) postprint
URL
http://hdl.handle.net/20.500.12099/32460
Introduction Soybean production in Indonesia has been fluctuat-ing in relation to the change of cropping area, which from 2000 to 2004 was 825, 679, 545, 527, and 550 × 103 ha respectively, and the total soybean production was 1,018, 827, 673, 627, and 707 × 103 t for the respective areas7. According to an anonymous report in Marwoto et al.7, in the year 2004, national consumption of soybean was 2.02 million t, but national production was just 0.71 million t and the rest 1.31 million t had to be totally imported to meet 65% of national consumption. Lampung, located in southern part of Sumatra Island, has a great chance to increase productivity, cropping area, and production efficiency, since human resources are available (transmigration from Java Island) and irriga-tion systems are highly equipped. Lampung has a humid tropical climate, which is characterized by high rainfall concentrated in the rainy season as well as high humidity and temperature throughout the year. Under this condi-tion, red acid soil is developed and soil organic matter decomposes very rapidly1. Red acid soil in Indonesia has been classified into four soil types, namely; Red-Yellow Mediterranean, Latosol, Red-Yellow Podzolic, and Lateritic. Ultisol (Red-Yellow Podzolic) in Lampung covers around 48.5% of the total area, and the rest con-sists of Latosol, Andisol, and Alluvial. In the province of Lampung, soybean production in 2003 was 3.97 × 10³ t from a cropping area of 3.91 × 10³ ha, or 1.02 t/ha (Indonesia Central Bureau of Statistics4). Usually, soybean is planted in paddy fields after the sec-ond harvest of paddy rice at the end of the rainy season. Therefore, water availability becomes a limiting factor of production; hence the possibility of implementing a defi-cit irrigation method is inevitable.
The Effect of Water Deficit in Typical Soil Types
on the Yield and Water Requirement of Soybean
(Glycine max [L.] Merr.) in Indonesia
Raden Ahmad Bustomi ROSADI1, AFANDI1, Masateru SENGE2
*
,Kengo ITO2 and John Tawiah ADOMAKO2
1 Faculty of Agriculture, University of Lampung (Jalan Prof. Dr. Soemantri Brojonegoro No.1, Bandar Lampung 35145, Indonesia) 2 Faculty of Applied Biological Science, Gifu University (Yanagido, Gifu 501–1193, Japan) Abstract An experiment was conducted with the objective to investigate the influence of available water deficit in typical soil types on the yield and crop water requirement of soybeans in Indonesia. This research was conducted in a plastic greenhouse of the University of Lampung from June to August 2005. A factorial experiment was arranged in randomized block design with three replications. The soil type (S) was the first factor with two different soil types, Ultisol (S1), and Latosol (S2). Water deficit (D) was the second factor with five levels including D1 (0–20%), D2 (20–40%), D3 (40–60%), D4 (60–80%), and D5 (80–100%) of water deficit from the total available water (TAW). For example, D1 (0–20%) meant that water was given to maintain the available water depletion between 0% and 20% of TAW in the root zone. Yield under full irrigation in Ultisol (21.3 g/pot) was 2.3 times as much as in Latosol (9.3 g/pot). Yield efficiency (the ratio of yield to crop water requirement) in Ultisol was the greatest under deficit irrigation of 30% of available water deficit (0.0083 g/g), which was 1.26 times as much as under full irrigation (0.0066 g/g). However, yield efficiency of Latosol was the greatest under full irrigation (0.0049 g/g). Therefore, yield efficiency of soybean in Ultisol was 1.8 times as much as in Latosol. Discipline: Irrigation, drainage and reclamation
Additional key words: deficit irrigation, red acid soil, soybean, yield efficiency, water stress
*Corresponding author: e-mail senge@gifu-u.ac.jp Received 25 October 2005; accepted 17 April 2006.
R. A. B. Rosadi et al. In order to ensure successful deficit irrigation, it is necessary to consider the water retention capacity of the soil. In sandy soil, plants may undergo water stress quickly under deficit irrigation, whereas plants in deep soils of fine texture may have ample time to adjust to low soil water matric potential, and may remain unaffected by low soil water content. Therefore, success with deficit irrigation is more probable in finely textured soils6. According to Doorenboss and Kassam3, in order to quantify the effect of water stress, it is necessary to derive the relationship between relative yield decrease and rela-tive evapotranspiration deficit given by the following equation. 1 - Ya/Ym = Ky (1 - ETa/ETm) (1)
where 1 - Ya/Ym = relative yield decrease, Ya = actual
yield, Ym = maximum yield (under no water stress condi-tion in each soil type), 1 - ETa/ETm
= relative evapotrans-piration decrease, Ky = yield response factor, ETa = actual evapotranspiration, and ETm = maximum evapotranspira-tion (under no water stress condition in each soil type). The Ky of soybean for the whole growing period under water deficit was 0.85 according to Doorenbos and Kassam3 and Moutonnet8. Based on the above description, the research was conducted with the objective to investigate the influence of available water deficit in typical soil types of Indonesia on yield and crop water requirement of soybeans. This research can be used to determine irrigation schedules for the different soil types which ensure optimum growth and production efficiency of soybeans.
Materials and methods
This research was conducted in a plastic greenhouse located in the experimental field of Lampung University from June to August 2005. The soybean cultivar used was Slamet. Soybeans were planted in plastic buckets inside the plastic greenhouse. The size of the plastic greenhouse was 6 × 10 m2. The top roof height was 4.5 m, and the lowest roof height was 3 m. The greenhouse type was a bamboo A-frame. The average temperature is 26.4ºC and the relative humidity (RH) was 83.3%. A factorial experi-ment was arranged in randomized block design with three replications. The soil types (S) was the first factor with two different soil types, Ultisol (S1), and Latosol (S2). Available water deficit (D) was the second factor with five levels including: D1 (0–20%), D2 (20–40%), D3 (40–60%), D4 (60–80%), and D5 (80–100%) of avail-able water deficit. For example, the water deficit level, D2 (20–40%) meant that water was given to maintain the available water depletion between 20% and 40% of the total available water (TAW) in the root zone. TAW is defined as the water content between field capacity (θFC) and permanent wilting point (θPWP). When the maximum allowable depletion of available water got close to 40% of TAW, water was applied to bring back the available water depletion to the deficit level of 20% of TAW. The physical and chemical properties of the soils are shown in Table 1. Agronomic variables evaluated in this research were yield (Y, g/pot) and crop water requirement (CWR, g). CWR was calculated as the total evapotranspiration (ET, g/d) during the whole growing period. Evapotranspiration (ET), which determined crop water requirement, was mea-sured by weighing the container every day. The container served the role of a weighing lysimeter that hydrologically isolates soil surface lateral inflow/outflow. Daily evapo-transpiration was calculated by the following formula: ET = Wdi - Wdi-1 (2) where Wdi (g) = the weight of container at day (i), and Wdi-1 (g) = the weight of the container at day (i - 1). The volume of the container (plastic bucket) was 10 L with a top diameter of 28 cm, bottom diameter of 21.5 cm, and height of 21.5 cm. The soil was taken from top soil (20 cm depth), then air-dried and sieved with a 3 mm mesh screen to make soil homogenous before filling the containers. A small 3 mm diameter hole for drainage was located at the center of the container bottoms. Five seeds were planted in each plastic bucket, and one week later thinned to only 2 seedlings which were maintained until the end of the growth period. Urea fer-tilizer was applied at 75 kg/ha, triple superphosphate at 75 kg/ha, and muriate of potash at 75 kg/ha. All fertil-izer was applied just once, at seedling time. The soybean Table 1. The soil physical and chemical properties
Soil moisture content
(m3/m3) θ TAW
FC - θPWP
Organic
content (HpH 2O) Soil texture (kg/kg)
θFC (34.7 kPa) θPWP (185 kPa) (m3/m3) (kg/kg) Sand Silt Clay
Ultisol 0.21 0.05 0.16 0.0296 5.51 0.80 0.12 0.08
plants were irrigated with a hand-held watering can, and the amount of water applied was the same as the amount of ET of the day before. The soybean plants were sprayed with insecticide to protect them from insect attack at least twice a month. The growth period of the soybean was 85 days. Two weeks before harvesting, irrigation was stopped. Statistical analysis was done using F-test at the 5% significance level, followed by Least Significant Difference (LSD) test at the same level.
Results and discussion
1. Crop water requirement
The influences of available water deficit (D) on crop water requirement (CWR) in the different soil types (S) are shown in Table 2. It can be observed from this table that the effects of available water deficit on CWR in Ultisol and Latosol are quite significant. In Ultisol, the plants experienced water stress starting from available water deficit 20–40% of TAW (D2), but in Latosol the plants experienced water stress beginning from available water deficit 40–60% of TAW (D3). It means that the critical water content (θc), defined as water content when plants begin to experience water stress, corresponded to available water deficit 30% of TAW in Ultisol and avail-able water deficit 50% of TAW in Latosol. The value θc in Ultisol is calculated as 0.21 - 0.3 × (0.21 - 0.05) = 0.16 m3/m3 (49 kPa) and in Latosol is calculated as 0.25 - 0.5 × (0.25 - 0.10) = 0.18m3/m3 (66kPa). There was significant difference in the response of available water deficit of D1, D2, and D3 between Ultisol and Latosol, and there was no significant difference in D4 and D5. It means that the CWR in Ultisol is greater than in Latosol under no stress (D1) and low water deficit of D2 and D3. However, CWR in Ultisol and Latosol are almost the same under high water deficits of D4 and D5. 2. Evapotranspiration
Fig.1 shows the relationship between ETa/ETm and
the fraction of water depletion “p”. The value of ETa/ETm is the ratio of actual evapotranspiration (ETa ) to the maxi-mum evapotranspiration (ETm ). Maximum evapotranspi-ration (ETm) refers to conditions when water is adequate for unrestricted growth and development. The value of ETa/ETm corresponds to the water stress coefficient (Ks) proposed by Allen et al.2, which is defined as the ratio of
ETcadj to ETc. ETcadj is the crop evapotranspiration under
non-standard condition (i.e. water stress condition) and ETc is evapotranspiration under standard condition (i.e. no water stress condition). The value of “p” is the ratio of water depletion to the total available water (TAW) in the root zone, which is an indicator of the water deficit level. For example, the average value of “p” under the water management of D3 (40–60%) treatment is calcu-lated as (0.4 + 0.6)/2 = 0.5. Fig.1 shows that ETa/ETm values decrease with increasing “p”, declining faster in Ultisol than Latosol. It means that the evapotranspiration in Ultisol is more sensitive to water stress than in Latosol. According to Allen et al.2 (1998), the value of “p” is a function of the soil type, for fine textured soils (clay) the p value can be reduced by 5–10%, while for more coarse textured soils (sand), they can be increased by 5–10%. It is easy to understand, because the texture of Ultisol soil consists of 80% sand and 8% clay, whereas Latosol soil consists of 40% sand and 30% clay (Table 1).
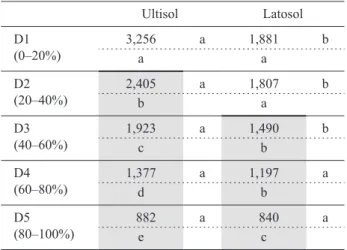
Table 2. The effect of available water deficit at different soil types on the total CWR (g/pot)
Ultisol Latosol D1 (0–20%) 3,256a a 1,881a b D2 (20–40%) 2,405b a 1,807a b D3 (40–60%) 1,923c a 1,490b b D4 (60–80%) 1,377d a 1,197b a D5 (80–100%) 882e a 840c a Numbers followed by the same letter horizontally and verti-cally were not significantly different using LSD-test at 5% significance level. The bold line and or shading are the boundaries for significance levels between the treatments compared to the control/highest value. 0 0.2 0.4 0.6 0.8 1 0 0.2 0.4 0.6 0.8 1
The available water deficit
E Ta /E Tm Ultisol Latosol
Fig. 1. The relation between the available water deficit (p) and ETa/ETm on Ultisol and Latosol
R. A. B. Rosadi et al. 3. Yield The effect of available water deficit (D) in the dif-ferent soil types (S) on yield are shown in Table 3. From Table 3, it could be seen that there were significant dif-ferences between the yields of Ultisol and Latosol under the low water deficit of D1, D2, and D3, but there was no significant difference under high water deficit of D4 and D5. The yields of soybean began to decrease significantly by water stress under available water deficit more than 40–60% of TAW in both the Ultisol and Latosol. The yield in Ultisol was greater than in Latosol under all water deficit levels. Especially the maximum yield in Ultisol (21.3 g/pot) was 2.29 times as much as in Latosol (9.3 g/pot) under full irrigation (D1). Fig. 2 shows the relation between (Ya/Ym) and the available water deficit fraction “p”. The value of Ya/Ym is the ratio of the actual yield (Ya ) gained under avail-able water deficit level of “p” to the maximum yield (Ym) under no water stress condition, which is also an indicator that the plant is in stress condition. The relations between (Ya/Ym) and “p” in Ultisol and Latosol are almost the same. Beyond the water depletion p = 0.3, the values of Ya/Ym for Ultisol and Latosol decrease sharply, indicating a stress condition. Based on Tables 2 and 3, and Fig. 1, and 2, it is appar-ent that the response of Ultisol and Latosol to CWR and yield were different. Those differences happen because of the effect of the different physical and chemical prop-erties of the soil. Based on the laboratory analysis, the chemical properties differed, especially pH (H2O). The pH of the Ultisol was 5.51, and the Latosol was 4.93. According to Tan9, Ultisol and Latosol were classified as having moderate and strong acidity, respectively. Based on the physical properties, the Ultisol soil is classified as loamy sand with 80% sand and 8% clay, and the Latosol as clay loam with 40% sand and 30% clay. According to Ismail and Effendi5, the best pH for soybean growth is 6.8 with yield index of 100%. The effects of pH on the yield are shown by the yield index. The yield index of soybean at pH 4.7, 5.0, 5.7, 6.8, and 7.5 are 65, 79, 80, 100, and 93% respectively. It means that the lower the pH, the lower the yield. Therefore, the yield of Ultisol is greater than Latosol.
4. Yield response factor
The values of the yield response factor (Ky) for water usage of the different soil types that are calculated using equation (1) are shown in Table 4. The Ky values in Ultisol are greater than in Latosol under all water deficit levels. The average Ky values of Ultisol and Latosol are 0.804 and 1.74, respectively.
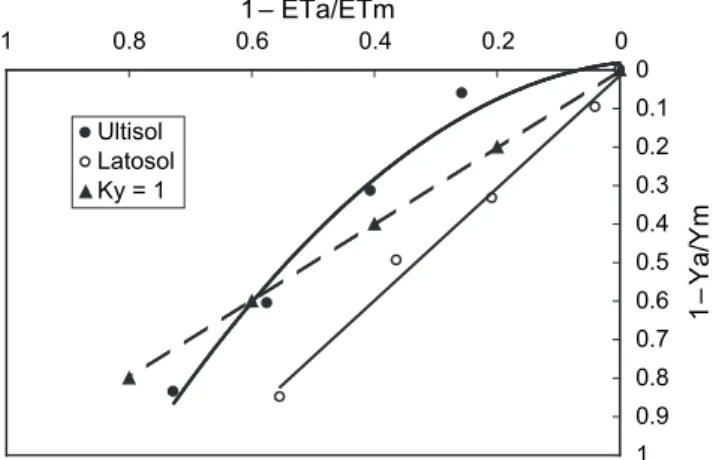
Fig. 3 shows that the relationship between rela-Table 3. The effect of available water deficit at the different
soil types on yield (g/pot)
Ultisol Latosol D1 21.3 a 9.3 B a a D2 20.0 a 8.4 B a ab D3 14.6 a 6.2 B c b D4 8.4 a 4.7 B d c D5 3.5 a 1.4 A e d Numbers followed by the same letter horizontally and verti-cally were not significantly different using LSD-test at 5% significance level. The bold line and or shading are the boundaries for significance levels between the treatments compared to the control/highest value. 0 0.2 0.4 0.6 0.8 1 0.1 0.3 0.5 0.7 0.9
The available water deficit (p) Ya
/Ym
Ultisol Latosol
Fig. 2. The relation between the available water deficit (p) and Ya/Ym 0 0.1 0.2 0.3 0.4 0.5 0.6 0.7 0.8 0.9 1 0 0.2 0.4 0.6 0.8 1 1– ETa/ETm 1– Y a/ Y m Ultisol Latosol Ky = 1
Fig. 3. Yield response to water deficit of soybean in Ultisol and Latosol
tive yield decrease (1 - Ya/Ym) and relative transpiration deficit (1 - Ta/Tm) was linear in Latosol with R2 = 0.99, but nonlinear in Ultisol with R2 = 0.98. The K y values in Ultisol were less than 1 under available water deficit lower than D3, but were greater than 1 under water deficit higher than D4. It means that deficit irrigation was effec-tive for economy of water usage in Ultisol under water stress lower than D3 compared to full irrigation (D1). However, deficit irrigation in Latosol was not effective compared to full irrigation.
5. Yield and water use efficiencies
Table 5 shows the effect of available water deficit (D) on the yield and water use efficiency. Yield efficiency (YE) for water usage is defined as the ratio of yield (g) of soybean to the crop water requirement (mm). Water use efficiency is defined as the ratio of biomass (g) of soybean to the crop water requirement (mm). Water use and yield efficiencies in Ultisol were the greatest under deficit irrigation of available water deficit of D2. YE under deficit level of D2 (0.044 g/mm) was 1.22 times as much as under full irrigation of D1 (0.036 g/mm). The deficit irrigation which maintains soil water deficit at 20–40% of TAW in Ultisol could conserve 18% of irrigated water to produce the same yield of soybean compared to full irrigation. Furthermore, the Ks value of Ultisol at optimal deficit irrigation (D2) was ETa/ETm = 2,405/3,236 = 0.74 (see Table 4). Water use and yield efficiencies in Latosol were the greatest under full irrigation of D1. The maximum yield Table 4. The yield response factor of soybean
Soil types WD Level (%) Yield (g) ET (g) 1 - Ya/Ym 1 - ETa/ETm Ky
Ultisol (S1) D1 ( 0–20%)D2 (20–40%) 21.320.0 3,2362,405 00.061 00.257 00.238 D3 (40–60%) 14.6 1,923 0.314 0.406 0.775 D4 (60–80%) 8.4 1,377 0.606 0.574 1.054 D5 (80–100%) 3.5 882 0.836 0.727 1.149 Average 0.804 Latosol (S2) D1 ( 0–20%)D2 (20–40%) 9.3 8.4 1,8811,807 00.097 00.039 02.460 D3 (40–60%) 6.2 1,490 0.3333 0.208 1.604 D4 (60–80%) 4.7 1,197 0.495 0.364 1.360 D5 (80–100%) 1.4 840 0.849 0.553 1.535 Average 1.740 WD: Water deficit, ET: Evapotranspiration.
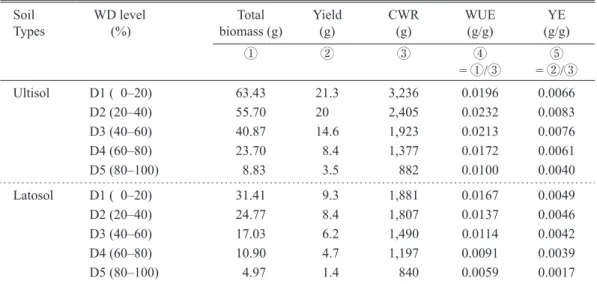
Table 5. The effect of water deficit (WD) on water uses efficiency (WUE), and yield efficiency (YE) Soil
Types WD level (%) biomass (g)Total Yield (g) CWR (g) WUE (g/g) (g/g)YE
① ② ③ ④ = ①/③ = ②/③⑤ Ultisol D1 ( 0–20) 63.43 21.3 3,236 0.0196 0.0066 D2 (20–40) 55.70 20.0 2,405 0.0232 0.0083 D3 (40–60) 40.87 14.6 1,923 0.0213 0.0076 D4 (60–80) 23.70 8.4 1,377 0.0172 0.0061 D5 (80–100) 8.83 3.5 882 0.0100 0.0040 Latosol D1 ( 0–20) 31.41 9.3 1,881 0.0167 0.0049 D2 (20–40) 24.77 8.4 1,807 0.0137 0.0046 D3 (40–60) 17.03 6.2 1,490 0.0114 0.0042 D4 (60–80) 10.90 4.7 1,197 0.0091 0.0039 D5 (80–100) 4.97 1.4 840 0.0059 0.0017 WD: Water deficit, WUE: Water use deficiency, YE: Yield efficiency.
R. A. B. Rosadi et al. efficiency in Ultisol (0.0083 g/g) was 1.8 times as much as in Latosol (0.0046 g/g). 4. Conclusions 1. Evapotranspiration of soybeans in Ultisol with coarse soil texture was more sensitive to water stress than in Latosol with fine soil texture. Soybean began to experience water stress at available water deficits of 20–40% in Ultisol, and in Latosol at available water deficits of 40–60%. Critical water contents of Ultisol and Latosol were 0.16 m3/m3 (49 kPa) and 0.18 m3/m3 (66 kPa), respectively. 2. Soil productivity, yield of soybean per unit area under full irrigation, in Ultisol (21.3 g/pot) was 2.3 times as much as in Latosol (9.3 g/pot). It could be assumed that those differences happened because of the effect of the different chemical properties, especially soil acid-ity. 3. The average values of the yield response factor (Ky) of Ultisol and Latosol were 0.804 and 1.74, respectively. It is concluded from these results that deficit irrigation is effective in Ultisol, but it is not effective in Latosol. 4. Yield efficiency of Ultisol was the greatest under defi-cit irrigation of available water deficit 20–40% or 30% of TAW (0.0083 g/g), which was 1.26 times as much as under full irrigation (0.0066 g/g). However, yield efficiency of Latosol was the greatest under full irri-gation (0.0049 g/mm). Therefore, yield efficiency of soybean in Ultisol (0.0083 g/g) was 1.8 times as much as Latosol (0.0046 g/g). References 1. Afandi (2003) Soil erosion and soil physical properties under coffee tree with various management in hilly humid tropical area of Lampung, South Sumatra, Indonesia. Doctoral thesis, United Graduated School of Agricultural Science, Gifu University, Gifu, Japan, 1–9. 2. Allen, R. G. et al. (1998) Crop evapotranspiration-guide- lines for computing crop water requirements, FAO irriga-tion and drainage paper no. 56. FAO, Rome, 159–181. 3. Doorenbos, J. & Kassam, A. H. (1979) Yield response to water, FAO irrigation and drainage paper no. 33 (part A). FAO, Rome, 1–57. 4. Indonesia Central Bureau of Statistic (2003) Food crops statistics. BPS Statistics, Indonesia, Jakarta. Available online at http://lampung.bps.go.id/lampung/statpro/tabfc9. htm. 5. Ismail, I. G. & Effendi, S. (1985) Soybean on upland area. Food Crops Research Institute, Sukamandi, 103–119. 6. Kirda, C. et al. (1999) Crop yield response to deficit
irri- gation. Kluwer Academic Publisher, Dordrecht, the Neth-erlands, 21–38. 7. Marwoto & Swastika, D. K. S. & Simatupang, P. (2005) Soybean development and research policy in Indonesia. In Proc. of workshop of soybean development on sub-optimal land, Balitkabi Malang, July 26, 2005,1–9. 8. Moutonnet, P. (2000) Yield response factors of field crops to deficit irrigation. In Deficit irrigation practices, water reports no. 22, FAO, Rome, 11–15.
9. Tan, Kim H. (1998) Principles of soil chemistry. Marcel