18
DOI: http://dx.doi.org/10.14246/irspsd.2.3_18
Copyright@SPSD Press from 2010, SPSD Press, Kanazawa
How Eco are China’s Eco-Cities? An International Perspective
Xiaolong Zou
1and Yan Li
1*1 Graduate School of Asia Pacific Studies, Ritsumeikan Asia Pacific University
* Corresponding Author, Email: [email protected] Received 5 November, 2013; Accepted 10 April 2014
Key words: Eco-city, China, Urban Sustainability, Indicator
Abstract: To tackle the problems and challenges posed by the rapid urbanization processes and to purse urban development in sustainable manners, the Chinese government has taken vigorous efforts in developing eco-cities across the nation. After reviewing the studies on concepts, frameworks and indicator systems of eco-city, we have observed a large amount of literature on the selection of indicators under a singular framework in China rather than having a quantity comparison from a broader scope. To obtain a quantitative sense of how well China’s eco-cities are doing compared to the best practices in the international arena, we have selected two cases from Japan and Germany. By examining their indicator quantities under the national eco-city framework of China, we have identified the gap between economic related indicator values, suggesting lower averaged economic values and energy efficiencies of Chinese eco-cities. Targets concerning the waste sector are also lower in China than in the other two cases. The environmental indicator values show lower quality than in the other two cases as well, and the social indicators manifest a specific methodological approach for measurements in China. Discussions and suggestions are made based on the outcomes of comparisons, hopefully to provide reference for the future development of eco-cities in China.
1 INTRODUCTION
The world has witnessed the phenomenal economic achievements in China during the past few decades, at the same time, testifying to the rapid urbanization process and the negative impacts to the urban living environment. In 1978, the urbanization rate in China was merely 17.9%, but in 2011, the urban population had surpassed the rural population, and is expected to reach 77.3% by 2050 (United Nations, 2012). Serious challenges and problems occurred during the rapid urbanization process, such as shortage of housing, traffic congestion, environmental pollution, soil and food securities, public health crisis etc., which have been studied by scholars from different aspects (Shen, 1999; Chen, 2007, Gong et al., 2012).
To tackle these challenges, the Chinese government has been vigorously promoting a series of projects to pursue ecological and sustainable urban development. Several concepts have been proposed like “Green City”,
“Garden City”, “Eco-City”, “Low-Carbon City”, and frameworks of national
levels have been established to promote these projects, such as “the Eco-
Garden City Framework” from the Ministry of Housing, Urban-Rural
Development (MHURD), “the Eco-County, Eco-City and Eco-Province
Framework” from the Ministry of Environment Protection (MEP), and “the Low Carbon City Framework (in trial period)” from the National Development and Reform Committee (NDRC). Besides this, many studies are conducted to define the concepts of eco-cities and their indicator systems, which will be further elaborated in the literature review section.
According to a national survey conducted by the Chinese Society for Urban Studies (2011), 230 prefectural level cities in China have had eco-city projects or made related plans, accounting for approximately 80% of the main cities by 2011. This booming of eco-cities projects has manifested prosperities for the urban sustainable development in China.
Besides an array of concepts or features for what “eco-cities” should embrace or integrate, many studies are conducted on analyzing the quality of the indicators or their necessities in China (an in-depth review of those studies is conducted in the literature review section). However we find that few discuss how well Chinese eco-cities perform compared with those in other countries. In this paper, we compare the Chinese eco-city indicators with best practices in Japan and Germany in quantitative terms. Based on the outcomes, we wish to obtain useful insights and suggestions that would help to improve China’s eco-city developments in the future.
2 LITERATURE REVIEW 2.1 Eco-city origin and concepts
The efforts to curb the negative impact of urbanization are neither new for people nor confined to particular countries. Concepts like “Garden City”,
“New Town” and “Techno-City” that occurred in the 19
thand 20
thCentury are some of the major representatives (Joss et al., 2011). Later concepts or terms like “Climate-Neutral City”, “Low-Carbon City”, “Smart City”, and
“Sustainable City” can also be considered as sister terms of “Eco-City”
concept that “covers various notions of, and approaches to, sustainable urbanism, rather than a conceptually coherent and practically uniform phenomenon”(Joss, 2012).
Despite the lack of a universally agreed concept or development guide for an eco-city, many scholars have offered their interpretations of how an eco-city should perform. Yanisky (1981) articulates that “an eco-city is an ideal habitat with a benign ecological circulation...and energy, material, and information are efficiently used.” Register (1987, 1994) defines that eco- cities are ecologically healthy cities. Engwicht (1993) perceives of eco-city as “an invention for maximizing exchange and minimizing travel” and “in eco-city people can move via foot, bicycles and mass transit and interact feely without fear of traffic and toxins”. An in-depth discussion of eco-city origin and its dimensions is reviewed in Roseland (1997), where he connects the dots of eco-city developments by exploring its conceptual evolutions from an array of sustainable development contexts.
In China, many scholars have also offered their own perceptions, such as
Wang (2000) considers an eco-city to be an administrative unit that consists
of high economic productions, high ecological efficiency, responsive and
harmonious social cultures. Huang (1989) proposes that eco-cities should
build upon ecological principles, integrate social-economical-natural
systems, and apply inter-disciplinary concepts to develop sustainable,
efficient and recycling human residential areas. Others scholars like Shen
(1998) consider an eco-city to be an integrated system of highly developed
economy, prosperous society where technology and nature are fully
converged, human creativity and productivity fully extended. Huang and Yang (2001) state that eco-city is a subsystem under the global regional eco- system, which is based on principles like natural harmony, social justice and high economic efficiency (Qiu, 2012).
2.2 Eco-city frameworks and indicator systems
“Framework” often entails principles, standards, and indicators for guiding the implementation of eco-city development. Numerous frameworks are established by various parties to fulfil the objectives for eco-cities globally. A recent study by Joss and Tomozeiu (2013) has reviewed a total of 43 eco-city frameworks based on their replicability, applicability and scope, excluding the ones that are designed for a particular case or region, such as Vancouver’s Greenest City 2020, Copenhagen’s Eco-Metropolis 2015 and the Curitiba Sustainability Indicators 2010, et cetera.
Similar abundance also manifests in the eco-city indicator systems; for instance, Li and Gang (2012) have reviewed nine major urban sustainability indicators from international organizations like Siemens (European Green City Index) to national government frameworks like the UK’s Eco-town Standards. The International Eco-Cities Initiative (2012) have enlisted 28 sets of eco-city indicators as a “brief summary” of the “internationally most prominent schemes” from municipal, national and international levels.
In China, there are three major types of “eco-city” frameworks in practice according to the composing bodies and targeted projects. National frameworks are established by ministry level government entities, which apply to most of the domestic cities with different focuses. The second type is composed of international joint venture eco-city projects; they often employ cooperation from international partners and target a particular area or project with higher standards for indicators, such as Sino-Singapore Tianjin Eco-City and Sino-Sweden Caofeidian Eco-City projects.
Under the national frameworks from MHURD, MEP and NDRC, specific indicators are set up to assess the performance of these eco-city programmes.
For MHURD’s “Eco-Garden Cities”, they set up an indicator system with 19 primary indicators under three categories: “urban ecological environment”,
“urban living environment” and “urban infrastructures”. MEP’s indicator system entails three levels for eco-county (22 indicators), eco-city (19 indicators) and eco-province (16 indicators) under three categories of
“economic development”, “environmental protection” and “social progress”.
The specific indicator system is still undergoing pilot research for the NDRC’s “Low Carbon Cities”, and the cities or regions that participated in this programme are required to come up with their own set of indicators before the official ones are released.
Besides the indicator systems within the package of the international eco- city projects of Tianjin or Caofeidian, several sets of indicator systems are proposed to address different needs or specific goals. An in-depth review of ten domestic eco-city indicator systems from the local and institutional levels (including two sets of national indicator systems) is conducted by Zhou et al. (2012) to analyse and compare their individual categories and key elements. Research Method
2.3 Method and rationale
In this study, we aim to analyse the quality of Chinese Eco-cities in
comparison with those in other counties. An effective means to have
observable evaluating results is to have quantitative analysis of the selected subjects. In our case, we design to choose one best-practiced Chinese eco- city to compare with eco-cities from international communities. However, due to the lack of consensus on the currently available best case example of Chinese eco-cities, and the potential workload to evaluate and select one with public creditability, after consideration, we have decided to select a hypothetical eco-city under the assumption that it meets all the eco-city standards (thresholds) set up by MEP. For the international comparison, we have chosen two regional leaders in terms of green and sustainable developments, namely, Japan in Asia and Germany in Europe. Another reason for choosing these two countries is due to the authors’ geographical location and past experiences. In the future, we intend to include case studies of best practices from other regions.
2.4 Selection of case studies and data collection
For the hypothetical Chinese eco-city case, we assume it meets all the requirements of the MEP’s eco-city framework, which consists of 19 sub- level indicators under three categories. The population of this case is set between 1 to 2 million meeting the normal size of a Chinese prefectural level city. What needs to be pointed out is that MEP’s eco-city framework applies to all the cities that meet the administrative definition of a city, regardless of the actual population size.
For Japan’s case, we have chosen Kitakyushu city, located in Fukuoka Prefecture, with a population of 1 million, which is famous for its cooperative environmental engagement from the local government, business sectors and residents. This former notoriously heavily polluted industrial centre has now been transformed into a recycling oriented, resource efficient industrial zone with high quality of life standards. It has been awarded or selected as a model city by the national government and international organizations including the UN and OECD (OECD, 2013).
For Germany’s case, we have chosen Hamburg city, with a population of 1.8 million, which is considered to be one of the greenest cities in Europe. It was awarded the 2011 European Green Capital Award for its comprehensive approaches, policies, funding for solving the environmental and ecological challenges with integrated and participative planning and strong commitment towards a “green vision” (European Commission, 2011).
We intended to compare all the 19 indicators, but due to lack of universal methodology and credible data, some of the indicators are not compared for the time being. Two of the environmental indicators, namely, “Air quality”
and “Water quality (surface water)” are compared separately with some selected indicators of measurement.
The data for Kitakyushu and Hamburg case studies are acquired or
obtained from official government database or entrusted institutions that
publish those data. Conversions or recalculations are conducted to unify the
units for easier comparisons without considering the inflation factor. In case
of the data from another language, the authors’ own translations are applied
where the official translations are absent.
3 ECO-CITY COMPARISON BETWEEN CHINA, JAPAN AND GERMANY
3.1 Economic aspect
For the economic aspect, the MEP framework has five indicators under the economic category and we use them as the baseline for comparison with Kitakyushu in Japan and Hamburg in Germany as is shown in Table 1.
Table 1. Comparisons of economic indicators for ‘eco-cities’
Economic Development
NO. Indicators Unit Eco-City
(China)
Kitakyushu (Japan)
Hamburg (Germany) 1 Annul net income of
farmers
Yuan/person
≥8,000
≥6,000
223,790a) 225,488b) Developed area
Less developed area 2 Tertiary industry
share in GDP
% ≥40 67%c) 72%d)
3
Energy consumption per unit of GDP
Tons of standard coal /10k Yuan
≤0.9 0.5e) 0.4f)
4
Water consumption per unit of industrial
added value
m3/10k Yuan
≤20 n.a. n.a
Water efficiency of agricultural irrigation
≥0.55 n.a. n.a.
5
Compliance rate of enterprises should
carry out Cleaner production
% 100 n.a. n.a.
Sources and Notes:
Conversion rate used: 1euro = 8 Yuan, 1 US dollar = 6 Yuan, 1 Yen = 0.07 Yuan All the web sources are last accessed on March 25, 2014.
a) Converted from 3,197,000 Yen of Fukuoka farmer income in 2011 (e-Stat Japan Official Database)
b) Converted from 28,186 Euro of Hamburg farmers net income in 2009 (European Commission FADN Database)
c) Calculated from Table 2 of the GDP Brief Results 2010 (Fukuoka Prefecture Website) d) Calculated by service industry value divided by gross development value in Hamburg in 2011 (German Federal Statistical Office)
e) Final energy consumption per unit of GDP in 2010 of Fukuoka Prefecture (RIETI database)
f) Calculated from 2.27 MJ/euro energy consumption per unit of GDP in Hamburg (German Green City Index, 2012)
GDP is a universally recognized indicator for the economic development
within given geographic boundaries. In the trial version of the MEP eco-city
framework, indicators like “GDP per capita” and “Annual income per
capita” were listed, but the final version only keeps the “Annual farmers’ net
income” as civil economic measurement. From this change, we can observe
a shift from the heavy pursuit of economic prosperity to the genuine concern
of a rather economically weak group – the farmers. Despite China’s being
the 2
ndlargest economy worldwide, big gaps are still seen between Chinese
farmers’ net annual income (8,000 Yuan for the developed areas) to those of
Kitakyushu (223,790 Yuan) and Hamburg (225,488 Yuan). And the later
two cases’ values come close, suggesting a similar developed stage for civil economy of farmers in Japan and Germany.
If we take a look at one of the causes for unsustainable development, the blindfolded pursuit of economic development, in another word, GDP growth is definitely on the top list. Thusly, having attainable goals for hard-core economic development, in our opinion, deserves some credits. On the other hand, it also reflects that China’s economic development is still out-matched by developed countries like Japan and Germany, despite of its overall economic performance worldwide.
The ratio of the tertiary industries to GDP is rather lower for Chinese eco-cities. The tertiary industry is also known as service industries, which does not rely on raw material or material processing industries. The lower the tertiary industry ratio is, the more share for the first and the secondary industries, which can barely contribute to the overall urban sustainability.
The most relevant two indicators under this category are “energy consumption per unit of GDP” and “unit of industrial added value”. The “0.9 ton/10,000 Yuan” energy consumption is also higher than Kitakyushu’s
“0.5” in Japan and Hamburg’s “0.4” in Germany. Water consumption for industrial added value and water efficiency of agricultural irrigations are not compared due to lack of clear definition and data.
From these key indicators, it can be easily observed that for the Chinese eco-city, it still falls behind of the developed countries when it comes to per capita economic performances, industrial structural ratio, and resource efficiencies. How to develop the urban economy in a sustainable manner is of vital importance in China, but the current standards have yet to be competitive to the developed world.
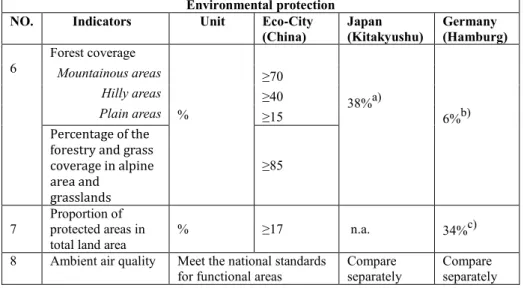
3.2 Environmental aspect
Environmental protection is one of the core elements for urban sustainable development; as a result, the related indicators can be seen as the most relevant measurement of the “eco” attainment level for eco-cities. We presented all the 11 indicators under this category for comparison (see Table 2). What needs to be pointed out is that for air, water, noise and waste categories, each of them needs to comply with the Chinese national standards with dozens of specific indicator measurements. So we have taken the most common ones for separate comparisons, instead of listing all of the items.
Table 2.Comparisons of environmental indicators for ‘eco-cities’
Environmental protection
NO. Indicators Unit Eco-City
(China) Japan
(Kitakyushu) Germany (Hamburg) 6
Forest coverage
% 38%a)
6%b)
Mountainous areas ≥70
Hilly areas ≥40
Plain areas ≥15
Percentage of the forestry and grass coverage in alpine area and
grasslands
≥85
7
Proportion of protected areas in
total land area % ≥17 n.a. 34%c)
8 Ambient air quality Meet the national standards for functional areas
Compare separately
Compare separately
9 Water quality Reach the standard of functional area and exceeds Class V of water quality
Compare separately
Compare separately Coastal water
quality
10 Emission density of
key pollutants kg/10k Yuan
(GDP)
n.a. n.a.
Chemical oxygen demand (COD)
<4.0 SO2 <5.0 Within national limits 11
Water quality compliance rate of centralized drinking water source
% 100
n.a. n.a.
12
Centralized municipal waste
water treatment % ≥85 100%d) 100%e)
Industrial water
reuse rate ≥80 n.a. n.a
13 Environmental
quality of noise Reach the standard of
functional area n.a. n.a.
14
Waste
Urban garbage treatment rate (%)
≥90 100f) 100g)
Industrial solid waste treatment &
utilization rate. (%)
≥90 n.a. n.a.
15 Urban public green
area per capita m2/person ≥11 12h) 17i)
16 Environmental protection investment share in GDP
% ≥3.5 2.9%j) 0.4%k)
Sources and Notes:
All the web sources are last accessed on March 25, 2014.
a) Forest statistics of Kitakyushu City in 2012 b) German Federal Statistics Office 2012
c) Calculated based on data from protected area in Hamburg from Parks.it Database and German Federal Statistics Office
d) Year Book of Fukuoka Prefecture, 2010, p.227,
e) Water Management in Germany, Federal Ministry for the Environment, Nature Conservation and Nuclear Safety, 2011
f) National law in Japan mandates to have 100% waste treatment and it is considered to have been achieved
g) National law in Germany mandates to have 100% waste treatment, Federal Ministry for the Environment, Nature Conservation and Nuclear Safety, 2013
h) Kitakyushu Environment White Book, 2010, p.91 i) European Commission Webpage
j) City budget published at Kitakyushu city official website k) Calculated based on Hamburg environmental investment in 2011
China’s “green area” consciousness is more practiced especially under the influence of “garden city” initiatives, which have been undertaken nationwide since the early 1990s, which is indicated by the “Forest coverage rate” of 40 % (Hilly area) compared to Kitakyushu’s 38.3% and 15% (Plain area) to Hamburg’s 6%. 11m
2/person in “Urban public green area per capita”
is very close to Kitakyushu’s 12 m
2/person, a bit less than Hamburg’s 17m
2/person, which is rather satisfactory given the population in most Chinese cities.
Categories of “Air” “Water” and “Waste” are the most important aspects
to any city, which is universally acknowledged and accredited as the major
components of an urban environment. By comparing these indicators, we can obtain the most direct impression of a city’s ecological level. Air pollution in many Chinese cities is already in a crucial condition for urban environmental development. Beijing for example, among many other mega- cities has been tortured for its air related problems, causing severe public health concerns and indirect economic damages, besides the environmental impacts.
It is worth noting is that, the “eco-cities” standards set by MEP do not bring out new sets of indicators nor thresholds, all their standards comply to the “Ambient air quality standards” (GB3095-1996). This set of standards was renewed in 2012 (GB3095-2012), so the figures that were included for comparison were taken from the 2012 standards instead of the 1996 ones.
Moreover, the eco-city standards trial version requires the number of days in a year to meet the Class 2 standards (of “Ambient air quality standards”), for north of China – no less than 280 days, south of China – no less than 330 days. This might lead to the suspicion more “loosened requirements” for the northern cities than for the southern ones due to industrial development needs and population growth patterns. What is worse, it allows a time window (85 out of 365 days, 35 out of 365 days) for the eco-cities not to meet the air quality standards, causing possible ill implementation of air pollution on a macro-level. However, during the revision version, the number of days is removed, eliminating the loop holes mentioned, indicating the government has been gradually improving their requirements for air quality.
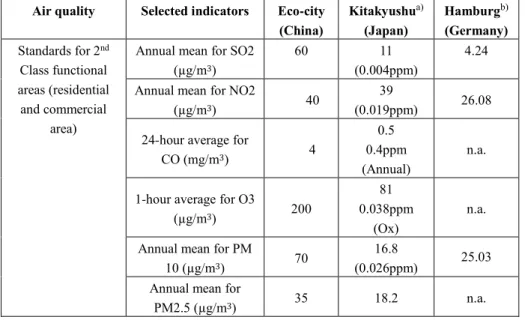
To compare the air quality for the three cases, four major indicators for measuring air quality are chosen among several dozens of measurements, namely, the daily mean for annual nitrogen dioxide, ozone, particle matters (such as PM10, PM2.5), and sulphur dioxide. The results reveal that the thresholds are several times more than that of Kitakyushu and Hamburg (refer to Table 3). This suggests a huge gap between the Chinese eco-cities and developed nations for air quality.
Table 3. Selected indicators for air quality comparisons Air quality Selected indicators Eco-city
(China)
Kitakyushua) (Japan)
Hamburgb) (Germany) Standards for 2nd
Class functional areas (residential and commercial
area)
Annual mean for SO2 (µg/m3)
60 11
(0.004ppm)
4.24 Annual mean for NO2
(µg/m3) 40 39
(0.019ppm) 26.08 24-hour average for
CO (mg/m3) 4
0.5 0.4ppm (Annual)
n.a.
1-hour average for O3
(µg/m3) 200
81 0.038ppm
(Ox)
n.a.
Annual mean for PM
10 (µg/m3) 70 16.8
(0.026ppm) 25.03 Annual mean for
PM2.5 (µg/m3) 35 18.2 n.a.
Sources and Notes:
All the web sources are last accessed on March 25, 2014.
Conversions of ppm to µg/m3 formulate (mg/m3=M/22.4*ppm) are employed to unify the units
a) Observed values in 2011 from Fukuoka Prefecture Web Site b) German Green City Index, 2012
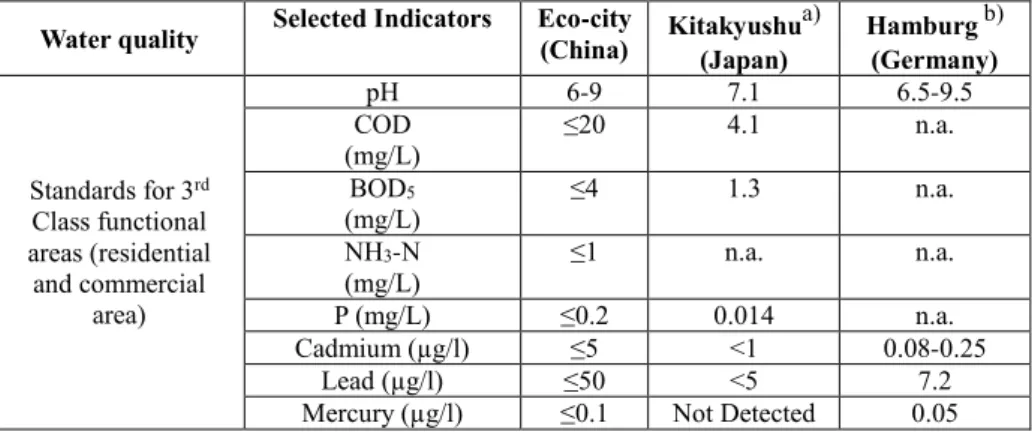
Water is also an essential resource for human survival and development, and a huge challenge in China due to its severe shortage and pollution. It is also regarded as one of the key factors that affect the ecological development of cities, which is reflected by the quantity of indicators. From Table 4, we can observe that the pH range is rather similar and natural in terms of acidity and alkalinity. The COD value is 5 times higher than Kitakyushu, suggesting more pollution contents in Chinese water bodies than in Japan. The other thresholds of BOD5, Nitrogen (NH3-N) and Phosphorus (P) are all higher than in Kitakyushu, indicating the overall quality of water is out-performed by Japan. A more subjective comparison is that the tap water in both Japan and Germany is directly drinkable, while few people in China would drink water straight from a water tap. Most people in China, if not all, at least boil tap water before drinking, just to avoid unnecessary health risks.
Table 4. Selected indicators for water quality comparisons Water quality Selected Indicators Eco-city
(China) Kitakyushua) (Japan)
Hamburgb) (Germany)
Standards for 3rd Class functional areas (residential and commercial
area)
pH 6-9 7.1 6.5-9.5
COD
(mg/L) ≤20 4.1 n.a.
BOD5
(mg/L) ≤4 1.3 n.a.
NH3-N (mg/L)
≤1 n.a. n.a.
P (mg/L) ≤0.2 0.014 n.a.
Cadmium (µg/l) ≤5 <1 0.08-0.25
Lead (µg/l) ≤50 <5 7.2
Mercury (µg/l) ≤0.1 Not Detected 0.05 Sources and Notes:
All the web sources are last accessed on March 25, 2014.
a) Observed values in 2011 in a point near the center of Kitakyushu City, from Fukuoka Prefecture Web Site
b) Germany average surface water value
China’s “urban waste water treatment percentage” target is 85%, which is considerably less than that of Kitakyushu and Hamburg. Moreover, law and regulations pertaining to wastewater treatments mandates no discharge of untreated wastewater in both countries, which would offer a good reference for the future related legal frameworks in China.
Waste is a serious problem in many developing countries and China is no exception. On the other hand, “waste” has become a booming industry to produce “added-value” products rather than “value-consuming” waste to be rid of. There is only one category with two indicators from MEP’s standards – “Urban Garbage Harmless Treatment Rate” (≥90%) and “Industrial Solid Waste Treatment & Utilization Rate” (≥90%). Both of the laws in Germany and Japan mandate that all the urban wastes must be treated before disposal in landfills. Industrial wastes are not compared due to differences in definitions and calculation method.
There are several major approaches for urban garbage or waste treatment,
for example, recycling, landfilling, incineration, MBT (mechanical and
biological treatment), et cetera. 100% of treatment by landfilling is far from
100% treatment by incineration and MBT in terms of environmental
soundness. In many developed countries, landfilling is getting less and less
popular given its eco-and-environmental threats (landfill gas emission and
leakage to soil and underground water body among others). In this sense, a
better approach would be for MEP to come up with specific indicators for
waste recycling, treatment mechanisms and so forth. The gross amount of
Chinese waste generation is astonishing, but if properly dealt with, this also embeds huge potential for eco-performance improvements and business opportunities.
3.3 Social aspect
As one of the three pillars for human development, “social aspect” is the most commonly included but yet least commonly standardized and reached consensus upon, for the vast diversity in geographical, cultural, political and institutional features worldwide. Even for the same category, due to the methodology adopted, the results can be quite different sometimes. It should be noted that the ‘central heating rate’ indicator applies only to the many cities in the northern part of China, thusly not applicable in either Japan or Germany.
Table 5.Comparisons of social indicators for ‘eco-cities’
Social progress
NO. Indicators Eco-city
(China)
Kitakyushu (Japan)
Hamburg (Germany)
17 Urbanization rate ≥55% 89.9% a) 73.9%b)
18 Centralized heating supply rate
in heating region c) ≥65% n.a. n.a.
19 Public satisfaction rate on the
environment ≥90% 61.6%d) 88%e)
Sources and Notes:
All the web sources are last accessed on March 25, 2014.
a) Calculated based on Population Census 2010, at e-stat database b) Germany average, World Bank Online Database, retrieved in 2013
c) This item is unique for only Chinese northern cities, not applicable to neither Japan nor Germany
d) According to a survey conducted by the Green Master Plan for Kitakyushu e) Converted from a rated score of 8.8 by a scale of 1-10, OECD Better Life Index,
retrieved in 2013.
According to the World Population Prospect (2011), China’s urban population exceeded 50% in 2011. Over half of the world’s population is currently living in urban areas, and more than two thirds of the population in the developed countries lives in urban areas. However, for many developing countries, pursuing urbanization is still a major driving force for social development. The effort of maintaining a stable urbanization pace in China can be detected by this 55% urbanization target, which is much lower compared to Kitakyushu’s 89.9 % and 73.9 % average in Germany. This obvious gap in percentage indicates that China has still a long way to catch up with the urbanization levels of the developed world. Just by setting up an
“urbanization rate” target, however, does not guarantee its development in a sustainable manner. It is the “means” – the path we adapt for realizing the development goal, rather than the “end” – the goal itself that really contribute to sustainability.
Now, one of the most ambiguous indicators occurs during this study -
“Public satisfaction rate for the environment”. China’s MEP has a high
target of more than 90%, which completely outperforms the 61.6 % in
Kitakyushu and 88% in Hamburg. The methodology provided by MEP states
this value is determined through conducting “on-site questionnaire survey”, but so far we could not find if they have specified the details about the sampling method and questions to include. Undeniably, the result can be as high as 90% or more, based on the questions for such subjective opinions.
More investigations are needed to see why the Chinese standard has to be set this high.
Having a high threshold should contribute to overall achievement of making eco-cities truly ecological, but sometimes this unrealistic goal could play no part or even have a negative effect in realizing the original intentions.
4 CONCLUSIONS
Based on the quantitative comparisons between the indicators for eco- cities from China’s MPE standard and the two selected case-studies of Kitakyushu in Japan and Hamburg in Germany, we can come up to the following conclusions tentatively:
i. Averaged economic level is still lower than in Japan and Germany.
Especially from the “Annual net income for farmers” indicator, we can observe that considerable significance is given to ensure the welfare of farmers in the cities. But to what extent should this level be elevated is yet to be determined.
ii. Efficiency target like Energy Consumption is still lower than in the other two countries, indicating a higher waste of resources when creating the same unit of value.
iii. Green area/space related indicator thresholds are nearly the same as in the other two countries.
iv. Environmental related standards for “water” and “air” are behind those of Japan and Germany, indicating Chinese eco-city environmental standards are slightly worse than those in the developed countries. However, these “slightly worse” standards would make no difference if not met properly in reality.
v. Too little content is given to the “waste” sector, which could have helped more to urban sustainability if proper mechanism is included.
vi. Social aspect related indicators like “urbanization rate” is rather reasonable in terms of China’s current development stage, which should have taken a steady not rapid approach.
vii.
A subjective indicator like “Public satisfaction rate for the
environment” is considerably high, indicating possibly ambiguous methodology for conducting such samplings.
When it comes to answer the research question of “How ‘eco’ are
China’s eco-cities”, the answer is not a straight “Yes” or “No”. Compared to
the two leading countries in eco-city development, China’s eco-cities seem
less “eco”, and many aspects could be improved and revised to better suit the
sustainable urban development. It is less convincing to reach a definite
superior or inferior conclusion for the Chinese model compared to the
developed world, however, by setting up loosened standards or thresholds,
unrealistically high targets could not efficiently help develop “eco-cities” in
essence but in name. What can be definitely opined is that China’s eco-cities
have a long way to go, much room for improvement in terms of their
framework, indicator systems among others. And urban sustainability is a
process that makes the cities more ecological and more liveable.
There are some limits concerning the key indicators selected for comparison due to data availabilities and the different measuring systems.
Some data values we used are recalculated and need to be further confirmed with the authoritative bodies of the case study cities. The lack of case study for Chinese eco-city leads to a substitute of “ideal” eco-city in theory. We intend to tackle these difficulties in our future studies.
ACKNOWLEDGEMENTS
The authors are grateful to the referees who gave constructive comments and suggestions in improving the manuscript.
This work was supported by grants from Japan Society for the Promotion of Science (KAKENHI No.26420634) and the subsidy from Ritsumeikan Asia Pacific University.
REFERENCES
Chen, J. (2007). “Rapid Urbanization in China: A real challenge to soil protection and food security”, Catena, 69 (1), 1-15.
Chinese Society for Urban Studies. (2011). China Low-Carbon Eco-city Development Report 2011, China Building Industry Press, Beijing, in Chinese.
Commission, E. (2011). European Green Capital Award. Online: European Commission Retrieved from http://ec.europa.eu/environment/europeangreencapital/index_en.html Engwicht, D. (1993). Reclaiming Out Cities and Towns: Better Living With Less Traffic, New
Society Publishers, Gabriola Island, BC.
Gong, P., Liang, S., Cariton, L.E., Jiang, Q., MD, Wu, J., Wang, L., Remais, V.J. (2012).
“Urbanization and Health in China”, The Lancet, 389 (9818), 843-852.
Huang, G. (1989). Garden Cities, Green Cities, Eco-Cities, Institute of Urban Planning, Construction University of Construction Engineering. Chongqing, in Chinese.
Huang, Q., Yang, D. (2001). Study Reviews on Eco-city Theories Domestic and Abroad, Urban Planning, 25 (1): 59-66. in Chinese.
Joss, S. (2011). Eco-Cities: The Mainstreaming of Urban Sustainability: Key Characteristics and Driving Factors, International Journal of Sustainable Development and Planning, vol 6 (3), 268-269.
Joss, S. and Tomozeiu, D. (2013). ‘Eco-City’ Frameworks – A Global Review, University of Westminster, UK.
Joss, S., (ed.). (2012). Tomorrow’s City Today, Eco-city Indicators, Standards and Frameworks, Bellagio Conference Report, University of Westminster, London.
Joss, S., Tomozeiu, D., Cowley, R. (2011). Eco Cities – A Global Survey 2011, University of Westminster International Eco-Cities Initiatives, London.
Li, Y., Gang, X. (2012). A Report on Some Sustainability Indicators Practices in the World, Reports of the City Planning Institute of Japan, No. 11.
Ministry of Environment Protection, (MEP), “Eco-County, Eco-City, Eco-Province Index”, official website, in Chinese.
http://www.zhb.gov.cn/gkml/zj/wj/200910/t20091022_172492.htm
Ministry of Housing, Urban and Rural Development, (MHURD). “Eco-Garden City Standards and Selection Criteria”, official website, in Chinese.
http://www.MHURD.gov.cn/zcfg/jsbwj_0/jsbwjcsjs/201212/t20121207_212220.html National Development and Reform Commission, (NDRC), “Low Carbon City Initiatives”,
official website, in Chinese.
http://www.ndrc.gov.cn/zcfb/zcfbtz/2010tz/t20100810_365264.htm
OECD (2013), Green Growth in Kitakyushu, Japan, OECD Green Growth Studies, OECD Publishing. http://dx.doi.org/10.1787/9789264195134-en
Qiu, Baoxing. (2010). Ideals and Realities – Initial Investigation on Chinese Low-Carbon Cities Indicator System Development and Practice, China Industrial Development Press, Beijing, 20-29, in Chinese.
Register, R. (1987). Ecocity Berkeley: Building Cities for a Healthy Future. North Atlantic Books, Berkeley.
Register, R. (1994). Eco-cities: Rebuilding Civilization, Restoring Nature, Futures by Design:
The Practice of Ecological Planning, Aberley, D. (ed.). New Society Publishers, Gabriola Island, BC.
Roseland, M. (1997). Dimensions of Eco-cities, Cities, 14 (4), 197-198.
Shen, J. (1999). “Urbanization and Sustainable Human Settlement”, Journal of Zhengjiang University (Science), 1(1), 233-238.
Shen, Q. (1998). Urban Ecology and Urban Environment, Tongji University Publication, Shanghai. 52-55, in Chinese.
Su, M., Xu, L., Chen, B., and Yang, Z. (ed.) (2013). Eco-City Planning Theories and Thoughts. Eco-Cities: A Planning Guide. CRC Press, FL, 5-6.
United Nations. (2012). World Urbanization Prospects, the 2012 Revision, official website.
http://esa.un.org/unpd/wpp/index.htm
Wang, R. (2000). Progress of the Urban Ecology Studies in the Transformation Age, Journal of Ecology, vol. 20 (5): 830-840, in Chinese.
World Bank. (2009). “Sino-Singapore Tianjin Eco-city: A Case Study of an Emerging Eco- City in China”, Technical Assistance (TA) Report.
Xie, P.F., Zhou, L.L., Liu, Y., Zhang, A.H., Pang, T., Song, X.F. (2010). Eco-city Indicator System Construction and Eco-city Demonstration Evaluation, Urban Studies, 17(7): 12.
Yanitsky, O. (1981). Cities and Human Ecology. Social Problems of Man’s Environment:
Where We Live and Work. Moscow: Progress Publishers.
Zhou, N., He G., Williams, C. (2012). “China’s Development of Low-Carbon Eco-Cities and Associated Indicator System”, Ernest Orlando Lawrence Berkeley National Laboratory.