Fig.1. Three points loading and geometry of artificial notch in cross section of specimen center; (a) STNSCB specimen, (b) CCNSCB specimen.
(a) (b) (c)
Fig.2 A finite element mesh and geometry of chevron notch: (a) 3D FEM model, (b) crack front with corners (Red circles), (c) modified crack front (Ayarollahi et al. 2016).
(b) CCNSCB specimen θ (a) STNSCB specimen
Fig.3 Typical linear traction-separation response.
STNSCB specimen Straight
CCNSCB specimen (90) Angle 90 degrees
CCNSCB specimen (75) Angle 75 degrees
(a) on the y-z plane (b) in the x-y plane (c) 3D view Fig.4 XFEM model: (a) cross section on the y-z plane, (b) perspective view of the crack front geometry in the x-y plane, (c) three dimensional view.
Tmax
δ max
Crack opening δ n
x y
x y
x y z
y
z y
z y
Table 1. Geometric and mechanical parameters.
Geometric parameter value Mechanical parameter value
Radius of specimen R 37.5mm Young’s modulus E 7.7GPa
Thickness of specimen t 30.0mm t/R = 0.8 Poisson’s ratio ν 0.22 Support distance 2s 60.0mm s/R = 0.8
Initial crack length a0 11.25, 18.75mm a0/R= 0.3, 0.5 Chevron angle θ Straight, 90, 75 degrees
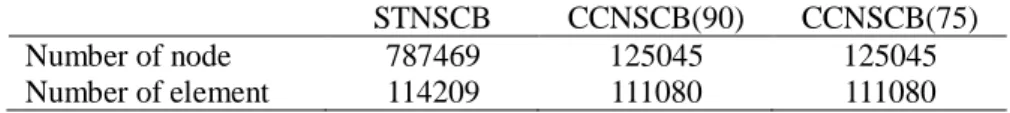
Table 2. Number of node and element of each model.
STNSCB CCNSCB(90) CCNSCB(75)
Number of node 787469 125045 125045
Number of element 114209 111080 111080
Fig.5 Comparison of load-displacement curve obtained from STNSCB test for sandstone with that by the XFEM analysis using model of STNSCB.
0 200 400 600 800 1000
0 0.05 0.1 0.15 0.2
Load , N
Displacement , mm
Experiment XFEM analysis
1
2 3
1 2 3
x y
Fig.6 State of crack propagation at a moment of the numbers in Fig.5.
Fig.7 Cross sectional geometry of crack front during crack propagation of STNSCB test.
Fig.8 Load-crack length curve of STNSCB test.
0 200 400 600 800
0.5 0.52 0.54 0.56
Pmax=764N
Load , N
Normalized crack length 16
18 20 22 24
0 5 10 15 20 25 30
x, mm
y, mm
a/R=0.50 0.51
a/R=0.53 0.54
Fig.9 Load-displacement curve and states of crack propagation of CCNSCB specimen with a chevron angle of 90 degrees. Right figures represent the state of crack propagation at a moment of 1: Pmax= 90kN, 2: 500kN and 3: 633kN.
Fig.10 Load-displacement curve and states of crack propagation of CCNSCB specimen with a
0 100 200 300 400 500 600 700
0 0.02 0.04 0.06 0.08 0.1
Load , N
Displacement , mm Pmax= 633N
1
2 3
1
2
3
1
2
3 0
100 200 300 400 500 600
0 0.02 0.04 0.06 0.08 0.1
Load , N
Displacement , mm Pmax= 574N
3 2
1
x y
x y
chevron angle of 75 degrees. Right figures represent the state of crack propagation at a moment of 1: Pmax= 90kN, 2: 310kN and 3: 574kN.
Fug. 11 Relationship between load and normalized crack length a/R of CCNSCB models in the XFEM analysis.
Fig.12 An example of FEM model of CCNSCB specimen with a crack length of a/R=0.38 of chevron angle of 90 degrees.
0 200 400 600 800
0.3 0.35 0.4 0.45 0.5
Load, N
Normalized crack length Pmax= 633N
0 200 400 600 800
0.3 0.35 0.4 0.45 0.5
Load, N
Normalized crack length Pmax= 574N
0 1 2 3 4 5 6 7 8
0 5 10 15 20 25 30
Normlized stress intensity factor ,Y I
x , mm
a/R=0.5 0.51 0.53 0.54
(a) cross section (b) bird eye view of half of the model
(c) longitudinal section of the crack front geometry (a) chevron angle 90 degrees (b) chevron angle 75 degrees
Fig.13 Distribution of normalized stress intensity factor along crack front shown in Fig.7 with increasing crack length in the STNSCB test.
Fig.14 Relation between normalized stress intensity factor and normalized crack length in STNSCB test.
Fig.15 Cross-sectional geometry of the crack front for each crack length of the CCNSCB specimen with a chevron angle of 90 degrees obtained from the XFEM analysis.
0 2 4 6 8 10
0.49 0.5 0.51 0.52 0.53 0.54 0.55 Normaized stress intensity factor , Y I
Normalized crack length , a/R
Initial crack length of artificail chevron notch
10 15 20 25 30
0 5 10 15 20 25 30
x , mm
y , mm
a/R=0.36 a/R=0.39
a/R=0.50 0.55
0.38
0.43
Fig. 16 Distributions of stress intensity factor in the range of 0.3 to 0.55.
Fig.17 Relationship between normalized stress intensity factor with respect to a/R in the CCNSCB 0
2 4 6 8 10
0 5 10 15 20 25 30
x , mm
Normalized stress intensity factor,Y*
a/R=0.30 a/R=0.50 0.38
0.43
0.55
0.36
0 2 4 6 8 10
0.25 0.3 0.35 0.4 0.45 0.5 0.55 0.6 Nomalized crack length, a/R
Normalized stress intensity factor, Y*
Initial crack length of artificail chevron notch
Equation (3)
specimen with a chevron angle of 90 degrees.
Fig.18 Cross-sectional geometry of the crack front for each crack length of the CCNSCB specimen with a chevron angle of 75 degrees obtained from the XFEM analysis.
Fig. 19 Distributions of stress intensity factor in the range of 0.3 to 0.55.
10 15 20 25 30
x , mm
y , mm
a/R=0.36 a/R=0.50 0.55
0.38
0.43
0 5 10 15 20 25 30
0 2 4 6 8 10
0 5 10 15 20 25 30
x , mm
Normalized stress intensity factor,Y*
0.36
0.38 a/R=0.50
0.43
0.55
a/R=0.3
Fig.20 Relationship between normalized stress intensity factor with respect to a/R in the CCNSCB specimen with a chevron angle of 75 degrees.
0 2 4 6 8 10
0.25 0.3 0.35 0.4 0.45 0.5 0.55 0.6 Nomalized crack length, a/R
Normalized stress intensity factor, Y*
Initial crack length of artificail chevron notch
Equation (4)
Table 3 Material properties of Kimachi sandstone.
Material property Values Uniaxial compressive strength 59.3 MPa
Young’s modulus 7.7 GPa
Poisson’s ratio 0.22
Tensile strength 6.17 MPa Elastic wave velocity 2.6–2.9 km/s
Fig.21 Examples of fractured surface of STNSCB and CCNSCB specimens after test: (a) CSNSCB specimen, (b) CCNSCB specimen with a chevron angle of 90 degrees, (c) 75 degrees, (d) photo from an oblique direction.
Specimen
AE sensor
(a) (b)
(c) (d)
Fig.22 Loaded specimen attached an AE sensor.
Fig.23 Load and AE event rate – displacement curves: (a) STNSCB test (b) CCNSCB test with a chevron angle of 90 degrees during the test.
Fig.24 Load-displacements curves obtained SCB test: (a) STNSCB specimen, (b) CCNSCB specimen with a chevron angle of 90 degrees and (c) 75 degrees.
0 200 400 600 800 1000 1200
0 0.05 0.1 0.15 0.2 0.25
Load, N
Displacement, mm
0 200 400 600 800 1000 1200
0 0.05 0.1 0.15 0.2 0.25
Load, N
Displacement, mm
0 200 400 600 800 1000 1200
0 0.05 0.1 0.15 0.2 0.25
Load, N
Displacement, mm
(a) (b) (c)
(a) (b)
0.0 0.2 0.4 0.6 0.8 1.0 1.2
0 50 100 150 200 250 300
0.0 0.2 0.4 0.6 0.8 1.0 1.2
Normalized load
Normaized displacecment Load
AE
Cumulative AE event
0 0.2 0.4 0.6 0.8 1 1.2
0 50 100 150 200 250 300
0 0.2 0.4 0.6 0.8 1 1.2
Normalized load Cumulative AE event
Normaized displacecment Load
AE
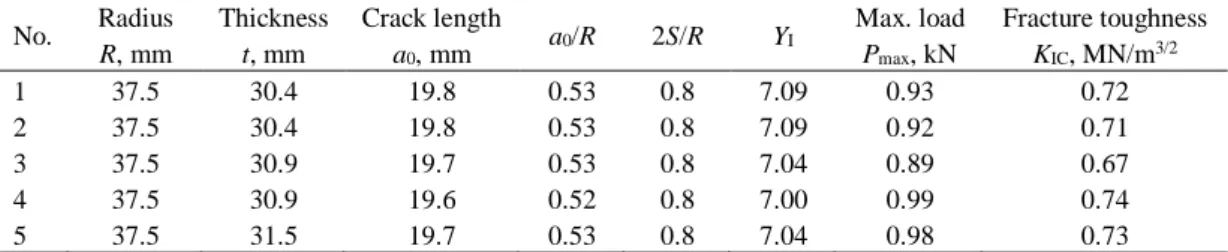
Table 4 Results of STNSCB test.
No. Radius R, mm
Thickness t, mm
Crack length
a0, mm a0/R 2S/R YI
Max. load Pmax, kN
Fracture toughness KIC, MN/m3/2
1 37.5 30.4 19.8 0.53 0.8 7.09 0.93 0.72
2 37.5 30.4 19.8 0.53 0.8 7.09 0.92 0.71
3 37.5 30.9 19.7 0.53 0.8 7.04 0.89 0.67
4 37.5 30.9 19.6 0.52 0.8 7.00 0.99 0.74
5 37.5 31.5 19.7 0.53 0.8 7.04 0.98 0.73
Remarks: YI was calculated by the original formulation of ISRM (Kuruppu, Obara et al. 2014).
Table 5 Results of CCNSCB(90) test.
No. Radius R, mm
Thickness t, mm
Crack length
a0, mm a0/R 2S/R YI
Max. load Pmax, kN
Fracture toughness KIC, MN/m3/2
1 36.4 30.6 10.7 0.29 0.8 5.26 0.77 0.69
2 36.3 31.6 10.0 0.28 0.8 5.26 0.79 0.69
3 36.6 31.2 11.1 0.30 0.8 5.26 0.89 0.78
4 36.2 30.9 10.1 0.28 0.8 5.26 0.78 0.70
5 37.1 30.0 11.1 0.30 0.8 5.26 0.79 0.72
Table 6 Results of CCNSCB(75) test.
No. Radius R, mm
Thickness t, mm
Crack length
a0, mm a0/R 2S/R YI
Max. load Pmax, kN
Fracture toughness KIC, MN/m3/2
1 35.7 30.1 10.7 0.30 0.8 6.58 0.58 0.67
2 36.0 30.4 10.8 0.30 0.8 6.58 0.72 0.82
3 36.8 30.4 11.4 0.31 0.8 6.58 0.74 0.83
4 36.3 30.9 11.3 0.31 0.8 6.58 0.70 0.78
0.0 0.2 0.4 0.6 0.8 1.0
STNSCB CCNSCB(90) CCNSCB(75)
Fracture toughness,MN/m3/2
Fig 25 Fracture toughness of Kimachi sandstone estimated by the specimen with different artificial notch shape.