Using R to analyze task effects on language production
journal or
publication title
言語教育研究
number 30
page range 33‑48
year 2019‑11
URL http://id.nii.ac.jp/1092/00001648/
asKUIS 著作権ポリシーを参照のこと
Using R to analyze task effects on language production
Daniel O. Jackson
Abstract
This tutorial article describes how to analyze task effects on language using R software. As an example, it draws on a RILS-funded project. One goal of this project was to seek validation of the pedagogic tasks used in terms of their influence on language production. It was assumed that more complex direction-giving map gap tasks would yield more complex motion expression. In the study, 16 participants gave directions based on four map tasks in counterbalanced order. These included two complex tasks (museum, shops) and two simple tasks (campus, station). The outcome investigated here was the motion verb tokens per turn (MVT/T) produced by participants in each of the four tasks. This tutorial demonstrates the use of R to test the hypothesis that the tasks differed in terms of MVT/T. Based on this example, it covers how to use R to: (1) import data and install packages, (2) generate descriptive statistics, (3) check normality, (4) reshape and trim data (5) perform analyses (including the Friedman’s ANOVA and Wilcoxon test), and (6) compute effect sizes with bootstrapped confidence intervals. The main test indicated that MVT/T significantly differed across the four tasks. Post hoc tests revealed that there were more MVT/T in the museum task than in the campus task. Some advantages of R include its free cost and the availability of additional packages, though it may pose a steep learning curve for beginners.
The tutorial concludes by recommending resources for those interested in expanding their methodological toolkit to include R.
Author Bio
Daniel O. Jackson (MS Ed., University of Pennsylvania and PhD, University of Hawai‘i at
Mānoa) is Associate Professor in the Department of English at KUIS, where he teaches
undergraduate courses and graduate courses for the MA TESOL program. His research
interests include individual differences, language teacher noticing, and task-based interaction.
Introduction
Primary research on second languages (L2s) uses qualitative, quantitative, and mixed methods to probe data in order to facilitate linguistic analysis, explore the learning and use of L2s, and enhance pedagogy. If the data are to be quantified, then statistical methods are appropriate. Importantly, such methods are not static; recent years have brought significant advances in the accessibility of tools and in the variety of techniques. This brief paper reports on the use of such tools and techniques to analyze task effects on language production. This area of L2 research has evolved from earlier, observational studies (e.g., Tarone, 1985) into an empirical research agenda shaped by concerns over how understanding variability in performance, often measured in terms of the complexity, accuracy, and fluency of learner production, might guide the use of tasks in language pedagogy (e.g., Robinson, 2015; Skehan, 2018). Quantitative L2 research plays a major role in addressing these theoretical and practical concerns.
The data presented here come from a RILS-funded project on pre-service language teacher noticing (Jackson, 2017; Jackson, in preparation). One goal of this project was to seek validation of the tasks used in terms of their influence on language production. It was assumed that more complex direction-giving map gap tasks would yield more complex motion expression, based on Cadierno and Robinson (2009), whose results were suggestive of such an effect with L1 Japanese speakers of L2 English (p. 268). However, the example used in this brief report also differs from Cadierno and Robinson’s study in at least three ways.
Here, the task type was dialogic, rather than monologic. Also, while an impressive range of
measures were used in their study, the present tutorial focused on one specific, ratio-based
measure, namely the number of motion verbs per turn (as described below). Finally, the
participants here were pre-service language teachers, whose proficiency level was above a certain benchmark, owing to program requirements. This paper attempts to examine the effect of task design on this outcome measure, in order to expand the research base, and also, to illustrate the use of R.
Method
R version 3.5.0 is a free software program developed by the R core team (2018) that computes statistics and produces graphics, which is available for MacOS and Windows (see https://www.r-project.org/). It is a flexible tool because, in addition to its core functions, it offers numerous, downloadable packages that are customized to perform a range of advanced statistics. An increasing number of textbooks that introduce statistical research methods use R.
These books are aimed at general audiences (e.g., Crawley, 2013; Field, Miles, & Field, 2012) as well as specialist language researchers (e.g., Baayen, 2008; Gries, 2009; Johnson, 2008; Larson-Hall, 2016). There is also extensive documentation of R available on the Internet (e.g., https://rseek.org/). However, R may pose a steep learning curve for beginners.
This tutorial focuses on one specific example—understanding task effects—which can be extended to other studies on language education in a variety of settings.
Participants, Tasks, Measure, and Design
In the study, 16 participants (assigned to the teacher role) gave directions to another 16 participants (assigned to the student role) based on four map tasks in counterbalanced order.
All participants were undergraduates enrolled in a teacher certificate program and had
attained scores equivalent to TOEFL ITP 550, or greater. The tasks included two complex
tasks (museum, shops) and two simple tasks (campus, station). The complex tasks allowed no
planning time, whereas three minutes of pre-task planning time was allocated prior to the
simple tasks. The complex tasks also used generic locations, while the simple ones used familiar locations. Finally, the number of elements and use of perspective drawings differentiated the complex and simple maps (see Robinson, 2015 for a detailed account of these design factors). To operationalize reference to motion, a specific, task-relevant measure was employed.
1Namely, transcriptions of the task performance were coded and used to calculate the number of motion verb tokens per turn (MVT/T) produced by each teacher participant in each of the four tasks. The following example illustrates how this measure was computed:
T: you will see three doors so please go into building one from the most right side door S: okay
T: and walk straight go through the passage and enter building four
The participant in the teacher role used four motion verbs (underlined) across two turns (MVT/T = 2). To be clear, only data from the participant in the teacher role were analyzed here. The study used a within-participants, or repeated-measures, design.
Preliminaries
A database was initially prepared in Excel with three columns for: (1) the participant ID, (2) the task performed, and (3) the value of MVT/T. This setup is referred to as the long format in contrast to the wide format, which would instead be arranged to display participants’ scores for each task in a single row with four columns (both formats will appear in this example).
The primary way of working with the R language illustrated here is to enter code that enables one to perform certain functions. This code consists of a function along with its
1 For a synthetic review of measures, see Jackson and Suethanapornkul (2013).
arguments. For example, the square root function takes a numeric argument as in:
> sqrt(100)
This line of R code returns the square root (that is, 10) once entered in the console. To view R documentation about any function, enter its name preceded by a question mark:
> ?sqrt
The following subsections demonstrate the use of R (v. 3.5.0) to test the hypothesis that the tasks differed in terms of MVT/T. This involved: (1) importing data and install packages, (2) generating descriptive statistics, (3) checking normality, (4) reshaping and trimming data (5) performing analyses (including the Friedman’s ANOVA and Wilcoxon test), and (6) computing effect sizes with bootstrapped confidence intervals.
Importing Data
Data from Excel can be used in R by converting the .xlsx file to a .csv file and then importing. The following shows how to import the .csv database using the finder in MacOS 10.12. By attaching the data, one can refer more easily to its contents.
> data <- read.csv(file.choose(), header = T)
> attach(data)
To view the data in the R console, simply enter the name assigned to it (e.g., data), which will display the entire database. Alternately, the function head returns the header and the first six rows of data.
> head(data)
This is what is returned:
ID Task MVTT 1 1 Station 0.6666667 2 1 Museum 0.7941176 3 1 Campus 0.6666667 4 1 Shops 1.1250000 5 2 Station 0.7058824 6 2 Museum 0.9583333
Generating Descriptive Statistics
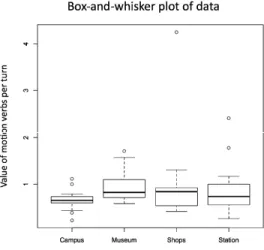
The box-and-whiskers plot is a helpful tool to visually inspect the data. To generate this plot one can use:
> boxplot(MVTT ~ Task, data = data)
This tells R to make a boxplot from the data file labeled data. The argument consists of the
formula MVTT ~ Task. This directs R to use the values in the column for motion verb
tokens per turn and group them according to the categories in the column for task. The box-
and-whiskers plot, which opens in a separate window, is provided here in Figure 1.
Figure 1. Box-and-whisker plot of MVTT in the four tasks.
The plot in Figure 1 displays the range of values for MVT/T separately for each task, indicating the median score and dispersion. It furthermore shows that there were outliers, indicated by the dots, in each task. At this stage, one can consider removing outliers. In this tutorial, all data were included, as removal of outlying data points did not appear to influence the results reported later.
Checking Normality
The histogram is another visualization that is commonly used to check the distribution of the data. This plots all of the values for MVT/T according to their frequency:
> hist(MVTT)
By looking at the histogram, we can already see that the distribution is not symmetrical but
instead positively skewed. The normality of the distribution can also be checked using the Shapiro-Wilk test:
> shapiro.test(MVTT)
The p-value is returned in scientific notation because it is very small. The following code converts this value to non-scientific format.
> format (4.144e-11, scientific = F)
When the value of p is less than .05, as it is here, one can conclude that the data are not normal.
Reshaping and Trimming Data
Because the assumption of normality was not met, non-parametric tests were used. To carry out the appropriate tests, it is necessary to convert the data from long to wide format.
These functions allow one to reshape the data:
> library(reshape)
> reshaped.data <- cast(data, ID ~ Task, value = "MVTT")
To remove the column labeled ‘ID’, use the following code:
> trimmed.data <- subset(reshaped.data, select = -c(ID))
The descriptive statistics for each task can now easily be viewed by using the summary function, which gives the median, mean, and other values for each column:
> summary(trimmed.data)
Performing Analyses
Following analyses presented in Field, Miles, and Field (2012), the non-parametric Friedman’s ANOVA can be computed in R using the code below:
> friedman.test(as.matrix(trimmed.data))
These are the results as shown in the R console:
Friedman rank sum test
data: as.matrix(trimmed.data)
Friedman chi-squared = 11.642, df = 3, p-value = 0.008718
This returns the test statistic, degrees of freedom, and p-value. To perform post hoc tests of the mean differences across tasks, using the Wilcoxon signed rank test, enter the following.
Note that this sample code is based on the contrast between the museum and campus task:
> wilcox.test(trimmed.data$Campus, trimmed.data$Museum, paired
= T)
The test statistic and p-value, which is significant in this case, are returned. These are the results:
Wilcoxon signed rank test
data: trimmed.data$Campus and trimmed.data$Museum V = 7, p-value = 0.0005798
Computing Effect Sizes
L2 researchers have recently emphasized the use of effect sizes and bootstrapped
confidence intervals, especially with small samples, as an alternative to focusing solely on
statistical significance testing (LaFlair, Egbert, & Plonsky, 2015). The following analysis uses the Bootstrap Effect Sizes package (Kirby & Gerlanc, 2013) to compute Cohen’s d and bootstrap confidence intervals. Once installed, this package is called up using:
> library(bootES)
The code below adds another column to the data containing the difference between MVT/T on the museum and campus tasks for each participant:
> trimmed.data$MuseumCampusDiff = trimmed.data$Museum - trimmed.data$Campus
The mean difference between the two tasks can then be computed:
> mean(trimmed.data$MuseumCampusDiff)
Finally, to compute the effect size and estimate the lower and upper bounds of the confidence interval, use:
> bootES(trimmed.data$MuseumCampusDiff, effect.type = "cohens.d")
The results provide the effect size and the confidence interval:
95.00% bca Confidence Interval, 2000 replicates Stat CI (Low) CI (High) bias SE 1.028 0.496 1.550 0.076 0.283
Results
This section considers the main findings of interest from the previous section. These
include highlights of the analyses that are useful to include when writing up the results, as
well as their interpretation. The non-parametric Friedman’s ANOVA indicated that MVT/T significantly differed across the four tasks, X
2(3) = 11.64, p = 0.01. The post hoc test revealed that, as expected, there were more MVT/T in the complex museum task than in the simple campus task (p = 0.00). Based on the mean difference across these tasks, the effect size (d) and bootstrapped confidence interval (BCa 95% CI, where BCa means “bias corrected and accelerated”) were also calculated (see Table 1). Using L2 field-specific benchmarks for within-participant designs, this d indicates a medium effect size (Plonsky, 2015).
Table 1
Analysis of MVT/T Across the Museum Versus Campus Tasks
BCa 95% CI Complex Simple Mean diff. p-value Effect size (d) Lower Upper
Museum Campus 0.31 0.00 1.03 0.50 1.55
Discussion and Conclusion
The finding reported here provides some support for Cadierno and Robinson’s (2009)
assertion that complex tasks may influence motion expression. These data suggest that their
claim may be generalizable to dialogic interaction using a measure of the number of motion
verbs per turn. This ratio-based measure is informative because it focused on the density of
specific, task-relevant linguistic items across the entire discourse, rather than their sheer
quantity. However, certain limitations should also be noted. This analysis of motion verbs
focused on tokens, not types, it excluded consideration of the constructions in which these
verbs were used, and additional post hoc tests revealed no significant difference between the
museum versus the station task, nor the complex shops tasks versus either simple task. More
research is therefore needed. It is hoped that this tutorial might support future studies in this,
and other, areas of task-based research.
This paper has described the application of R software to one area of L2 research, namely the effects of task design on language production. It was noted that R is free and accompanied by a wide range of published and online resources. Published examples of analyses using R for L2 research can also be found. Of course, access to these resources is not guaranteed and, even if it were, there is a need to illustrate further how R can be applied to a wider variety of analyses in research on language pedagogy. This paper offered one such example. For those interested in learning more about R, the asterisked references below are especially recommended. Ideally these can be augmented by teacher-researcher development groups, which build on common interests established through language programs, graduate schools, and professional organizations.
References
*Baayen, R. H. (2008). Analyzing linguistic data: A practical introduction to statistics using R. Cambridge, UK: Cambridge.
Cadierno, T., & Robinson, P. (2009). Language typology, task complexity and the development of L2 lexicalization patterns for describing motion events. Annual Review of Cognitive Linguistics, 7, 245-276.
*Field, A., Miles, J., & Field, Z. (2012). Discovering statistics using R. Thousand Oaks, CA:
Sage.
*Gries, S. T. (2009). Statistics for linguistics with R: A practical introduction. Berlin, Germany: Mouton de Gruyter.
Jackson, D. O. (in preparation). Language teacher noticing in tasks. Book under contract with
Multilingual Matters.
Jackson, D. O. (2017). Perspective and task complexity in language teacher noticing research.
言語教育研究