m
edi al or bi t of r ont al c or t ex
著者
Yam
ada H
i r os hi , Loui e Kenw
ay, Tym
ul a
Agni es z ka, G
l i m
c her Paul W
.
j our nal or
publ i c at i on t i t l e
N
at ur e c om
m
uni c at i ons
vol um
e
9
page r ange
162
year
2018- 01
権利
( C) The Aut hor ( s ) 2018
Thi s ar t i c l e i s l i c ens ed under a Cr eat i ve
Com
m
ons At t r i but i on 4. 0 I nt er nat i onal Li c ens e,
w
hi c h per m
i t s us e, s har i ng, adapt at i on,
di s t r i but i on and r epr oduc t i on i n any m
edi um
or
f or m
at , as l ong as you gi ve appr opr i at e c r edi t
t o t he or i gi nal aut hor ( s ) and t he s our c e,
pr ovi de a l i nk t o t he Cr eat i ve Com
m
ons
l i c ens e, and i ndi c at e i f c hanges w
er e m
ade.
The i m
ages or ot her t hi r d par t y m
at er i al i n
t hi s ar t i c l e ar e i nc l uded i n t he ar t i c l e’
s
Cr eat i ve Com
m
ons l i c ens e, unl es s i ndi c at ed
ot her w
i s e i n a c r edi t l i ne t o t he m
at er i al . I f
m
at er i al i s not i nc l uded i n t he ar t i c l e’
s
Cr eat i ve Com
m
ons l i c ens e and your i nt ended us e
i s not per m
i t t ed by s t at ut or y r egul at i on or
exc eeds t he per m
i t t ed us e, you w
i l l need t o
obt ai n per m
i s s i on di r ec t l y f r om
t he c opyr i ght
hol der . To vi ew
a c opy of t hi s l i c ens e, vi s i t
ht t p: / / c r eat i vec om
m
ons . or g/ l i c ens es / by/ 4. 0/ .
U
RL
ht t p: / / hdl . handl e. net / 2241/ 00150895
doi: 10.1038/s41467-017-02614-w
Cr eat i ve Com
m
ons : 表示
Free choice shapes normalized value signals in
medial orbitofrontal cortex
Hiroshi Yamada
1,2,3,4
, Kenway Louie
1
, Agnieszka Tymula
1,5
& Paul W. Glimcher
1,6
Normalization is a common cortical computation widely observed in sensory perception, but
its importance in perception of reward value and decision making remains largely unknown.
We examined (1) whether normalized value signals occur in the orbitofrontal cortex (OFC)
and (2) whether changes in behavioral task context in
fl
uence the normalized representation
of value. We record medial OFC (mOFC) single neuron activity in awake-behaving monkeys
during a reward-guided lottery task. mOFC neurons signal the relative values of options via a
divisive normalization function when animals freely choose between alternatives. The
normalization model, however, performed poorly in a variant of the task where only one of
the two possible choice options yields a reward and the other was certain not to yield a
reward (so called:
“
forced choice
”
). The existence of such context-speci
fi
c value
normal-ization may suggest that the mOFC contributes valuation signals critical for economic
decision making when meaningful alternative options are available.
DOI: 10.1038/s41467-017-02614-w
OPEN
1Center for Neural Science, New York University, 4 Washington Place, Room 809, New York, New York 10003, USA.2Division of Biomedical Science,
Faculty of Medicine, University of Tsukuba, 1-1-1 Tenno-dai, Tsukuba, Ibaraki 305-8577, Japan.3Graduate School of Comprehensive Human Sciences,
University of Tsukuba, 1-1-1 Tenno-dai, Tsukuba, Ibaraki 305-8577, Japan.4Transborder Medical Research Center, University of Tsukuba, 1-1-1 Tenno-dai,
Tsukuba, Ibaraki 305-8577, Japan.5School of Economics, University of Sydney, Room 370, Merewether Building (H04), Sydney, New South Wales 2006,
Australia.6Institute for the Interdisciplinary Study of Decision Making, New York University, 300 Cadman Plaza West, Suite 702, Brooklyn, New York 11201,
USA. Correspondence and requests for materials should be addressed to H.Y. (email:h-yamada@md.tsukuba.ac.jp)
123456789
A
growing body of evidence indicates that value signals
distributed
in
the
brain
shape
decision-making
behavior
1–3. Such value signals are especially prominent
in the orbital and medial areas of prefrontal cortex
4and the
parietal cortex
5,6where neural activity represents value
infor-mation in a diverse array of paradigms
7. Notably, these value
signals do not simply re
fl
ect the
fi
xed values assumed by many
models of choice
8–10, but instead the magnitudes of these value
signals have been shown to depend on present or past
alter-natives
11–15. For example, a pioneering
fi
nding in orbitofrontal
cortex (OFC) indicates that OFC neurons signal the relative
values of food items among the alternatives monkeys have
recently encountered in a block of trials
16. This
fi
nding implies
that value signals identi
fi
ed in the OFC may re
fl
ect comparative
computations such as
“
divisive normalization
”
, a common cortical
computation for relative information coding proposed to explain
nonlinear response properties in sensory cortices
17. However, it
remains unclear how or if the value signals in these prefrontal
areas are normalized and incorporated into the process of
choosing among alternatives.
To investigate the direct link between normalized values signals
and choice behavior, we focused on the medial orbitofrontal
cortex (mOFC, see Rudebeck and Murray)[
4
,
7
]. mOFC is a
subdivision of the OFC medial to the medial orbital sulcus
(Brodmann
’
s area 14, 13a, 13b, and 11m), and reciprocally
con-nected to both medial and orbital prefrontal network areas.
Although previous studies have identi
fi
ed neural signals related to
reward values in the OFC, they have not speci
fi
cally searched for
normalized value representations in prefrontal areas. For
example, human ventromedial prefrontal cortex (vmPFC), mostly
along the medial wall, has been shown to represent a diverse set of
reward values in various behavioral tasks, including both active
value-guided decision making
18–22and passive item
valua-tion
23,24when no choice is made. Single neuron activity in
monkey vmPFC carries value signals that re
fl
ect offer values of
gambles
25, motivational level
26,27and a possibility of reward
28. In
the lateral subdivision of OFC (lOFC, a subdivision of OFC lateral
to medial orbital sulcus), neurons have been shown to signal the
relative values of items when monkeys perform behavioral tasks
both with and without choices
11,12. Value signals are evident
across all of these prefrontal network areas; however, none
of the areas has been examined to determine whether these value
signals employ a computational process, divisive normalization,
when animals choose freely among items of different reward
values.
We thus speci
fi
cally targeted the mOFC to test whether single
mOFC neurons signal the normalized values of rewards when
monkeys made
“
free choices
”
: choices between two available
rewarding items. We found that a common cortical computation,
divisive normalization, is implemented in the activity of mOFC
neurons representing reward values under these conditions.
These normalized value signals were prominent when monkeys
made free choices, but surprisingly were attenuated when
mon-keys were
“
forced
”
to choose one of the options: when one of the
two possible rewards was signaled to have zero value or impact
with certainty and the other was potentially rewarding, a situation
colloquially referred to in the neuroscience literature as a
“
forced
choices
”
(a nomenclature we adopt in this paper)
29.
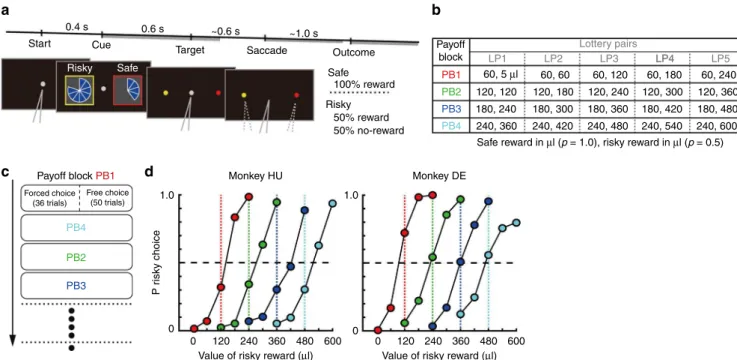
Start Cue
0.4 s 0.6 s ~0.6 s ~1.0 s
Risky Safe
Target Saccade Outcome Payoffblock
LP1 LP2
Safe reward in µl (p = 1.0), risky reward in µl (p = 0.5)
LP3 LP4 LP5
60, 240 120, 360 180, 480 240, 600
LP4 Lottery pairs
60, 180 120, 300 180, 420 240, 540 60, 120
120, 240 180, 360 240, 480 60, 60
120, 180 180, 300 240, 420 60, 5 µl
120, 120 180, 240 240, 360
PB1
PB2
PB3
PB4
Safe
Risky 50% reward 50% no-reward
Monkey DE Monkey HU
1.0
0
1.0
0
0 120 240 360 480 600 0 120 240 360 480 600
Value of risky reward (µl) Value of risky reward (µl)
Forced choice (36 trials)
Free choice (50 trials)
P r
isky choice
PB4
PB2
PB3 Payoff block PB1
100% reward
b
a
d
c
Results
Cued-lottery task in monkeys
. To examine value coding during
economic choice behavior, we trained two monkeys to perform a
cued-lottery task with varying reward payouts and probabilities
(Fig.
1
). During the task, visually displayed pie charts indicated
reward magnitudes to the monkeys, while risky (50% reward,
otherwise nothing) and safe (100% reward) options were
pre-sented on the left and right side of
fi
xation in each block of trials
(Fig.
1
a). Monkeys made choices between the risky and safe
options among 20 lottery pairs (Fig.
1
b); these pairs were divided
into four separate groups of lottery pairs (
fi
ve risky options
against one safe option) and presented to the monkeys as blocks
of trials (Fig.
1
c, payoff block (PB)). In each block 36
“
forced
choice
”
trials were followed by 50
“
free choice
”
trials. A gray
central
fi
xation stimulus indicated free choice trials, while a red or
yellow central
fi
xation stimulus indicated forced choice trials in
which only a choice of the color-matched target would yield a
reward. In each PB, the
fi
ve lottery pairs were systematically
matched in terms of their relative values with the expected value
of risky option (Fig.
1
b, LP1
–
5): considerably larger than the safe
option (LP5); slightly larger (LP4); equal (LP3); slightly smaller
(LP2); or considerably smaller (LP1). Together, these four blocks
allowed us to examine the extent of relative value coding in
mOFC neurons.
Details of the behavioral training, learning progress and
behavioral performance of the animals in the lottery task have
been reported previously
30. Brie
fl
y, after completing the training,
monkeys learned the expected values of risky and safe options,
and chose risky options more frequently if the expected values of
risky options were higher than those of safe options and vice
versa (Fig.
1
d). Behavioral measures, such as percent correct trials
and saccade reaction time, were not consistently related to
expected value between monkeys (Supplementary Fig.
1
),
sug-gesting that potential confounding factors such as motivation or
attention did not vary between conditions. To examine the
mechanism by which mOFC neurons signal values, we sampled
182 mOFC neurons (Supplementary Fig.
2
). Of these sampled
units, 101 neurons (50 and 51 neurons from monkey DE and HU,
respectively) were recorded and analyzed during all or almost all
of the four PBs while monkeys were engaged in the lottery task
(minimum 200 trials).
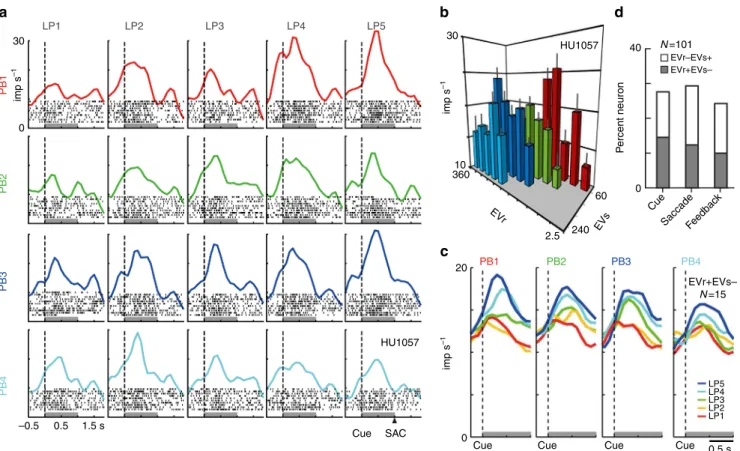
Relative value coding in mOFC neurons
. We
fi
rst examined
whether the activity of mOFC neurons represents relative value
information in a general way (without utilizing normalization
equations speci
fi
cally in our analysis; see Methods), as has been
seen in an adjacent area, the lOFC
16, where neurons have been
shown to signal the relative values of items among possible
alternatives in a block of trials. Cue period activity from an
example relative value coding neuron from our dataset is shown
in Fig.
2
a. In each payoff block differentiated by color, the neuron
Cue
Cue Cue Cue 0.5 s
LP5
EVr+EVs– N=15
LP4 LP3 LP2 LP1 LP1
30
0
imp s
–1
PB1
PB2
PB3
PB4
LP2 LP3 LP4 LP5
–0.5 0.5 1.5 s
Cue SAC HU1057
N=101
EVr–EVs+ EVr+EVs–
40
0
Cue SaccadeFeed
back
P
e
rcent neuron
imp s
–1
PB1 PB2 PB3 PB4
20
0
imp s
–1
HU1057
36010 30
2.5 EVr
240 60
EVs
a
b
d
c
Fig. 2Relative value signals in the activity of mOFC neurons.aRasters and histograms of an example mOFC neuron modulated by the relative value of options. The activity aligned at cue onset during free choice trials was shown for 20 lottery pairs (four PBs timesfive LPs, 200 trials). Black dots in the histograms indicate raster of spikes. Gray bars indicate the cue period to estimate the neuronalfiring rates shown inb. SAC indicate approximate time of saccade onset.bActivity plot of the mOFC neuron inaagainst the expected values of risky (EVr) and safe option (EVs). Error bars indicate s.e.m. The neuron showed positive and negative regression coefficients for EVr and EVs (EVr+EVs−type, EVr, 0.042, EVs,−0.048, AIC=1283), respectively.
showed increasing activity as the relative value of risky options
increased (LP1 to 5): the larger the expected value of the risky
option compared to the safe option, the higher the neural activity.
This activity modulation diminished as the expected value of the
safe option increased from PB1 to PB4. Consistent with a relative
value representation, the activity of this neuron was modulated by
the expected value of both the risky (EVr) and safe (EVs) options,
with opposite modulation effects (Fig.
2
b,
n
=
200, Akaike
’
s
information criterion (AIC)
=
1283, regression coef
fi
cient; EVr,
0.042,
P
<
0.001; EVs,
−
0.048,
P
<
0.001; intercept, 19.6,
P
<
0.001). This relative value coding was found in 28% of mOFC
neurons during the cue period. Of the mOFC neurons, 15% (15/
101) showed increasing activity as the expected values of risky
option increased and of safe options decreased (Fig.
2
c, EVr+EVs
type), while 13% of neurons (13/101) showed increasing activity
as the expected values of risky options decreased and of safe
options increased (EVr
−
EVs+ type). Relative value signals of this
kind were evident across the entire decision-making interval
(Fig.
2
d): when monkeys made decisions based on cue
informa-tion (cue period, 28%), after saccadic decisions and prior to
outcome feedback (saccade period, 29/101, 29%), and during
outcome feedback (feedback period, 24/101, 24%); see gray lines
in Fig.
1
a for three task periods: cue period (1.0 s window after
cue onset), saccade period (1.0 s window after saccade onset) and
feedback period (1.0 s window after feedback onset). There was
no signi
fi
cant difference in the proportion of modulated neurons
among the task periods (
χ
2test,
n
=
303,
P
=
0.584,
χ
2=
1.075, df
=
2). In total, 27% (81/303) of the task periods showed activity
modulation by the relative value of options, and 48 neurons
exhibited relative value coding in at least one of the three task
epochs. These 81 relative value signals were used in further
analyses to test in greater detail how the value signals are
nor-malized. Note that only a small percentage of neurons exclusively
encoded choice location (7/101, 7/101 and, 5/101 during cue,
saccade and feedback periods), consistent with previous
fi
ndings
in lOFC
16,31.
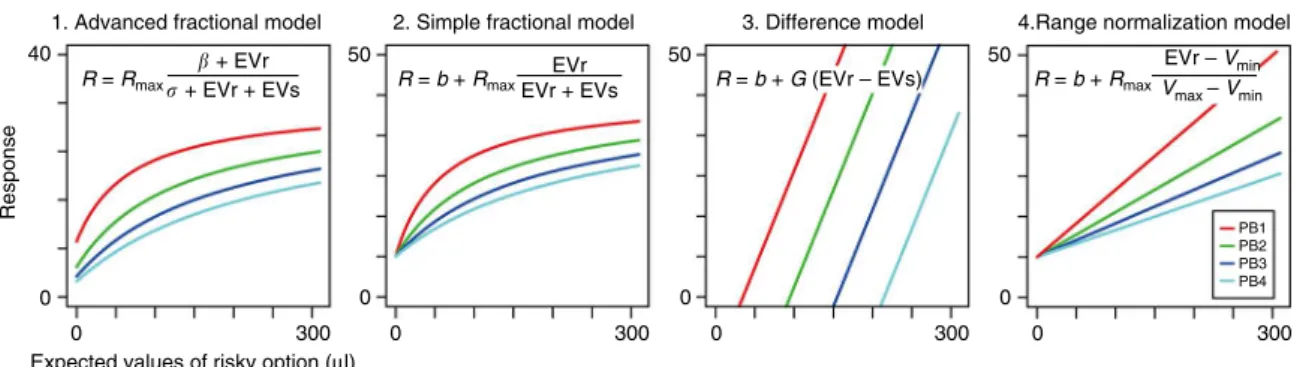
Normalized value coding in mOFC neurons
. A common
cor-tical computation underlying relative information coding in both
sensory and decision-making brain regions is divisive
normal-ization
13,17. To examine the role of divisive normalization in
mOFC relative value coding, we
fi
t the observed mOFC data to a
standard normalization equation:
R
¼
R
maxβ
þ
EV
1σ
þ
EV
1þ
EV
2where the
fi
ring rate
R
depends on the expected values of both
alternatives. For a given neuron, EV
1and EV
2were the expected
values of the two options. If a neuron increased
fi
ring rate as the
value of the risky option increased, then EV
1was de
fi
ned as the
risky option and EV
2as the safe option. If a neuron increased
fi
ring rate as the safe option increased in value, then EV
1was
de
fi
ned as the safe option and EV
2as the risky option.
R
max,
β
and
σ
were free parameters, with
R
maxcharacterizing the maximal
level of neural activity.
β
and
σ
determine the contribution of the
expected values to neuronal responses, with
β
governing the level
of activity at
“
baseline
”
(when both EV
1and EV
2are zero) and
σ
determining the sensitivity of neuronal responses to the expected
values (large
σ
means low sensitivity). We refer to this common
normalization equation as the
“
advanced fractional model
”
, and
note that it yields non-linear responses to changes in the expected
values as shown in the output response visualized in Fig.
3
(left
panel, advanced fractional model).
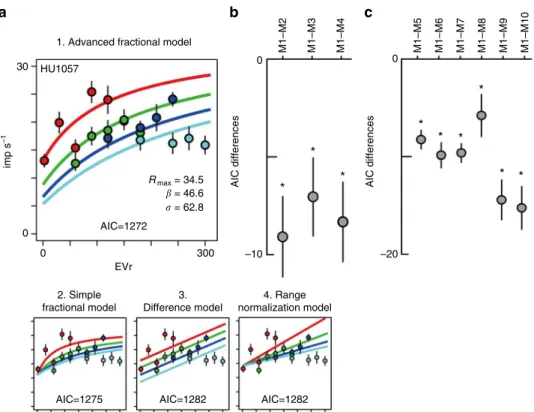
We
fi
rst
fi
t the advanced fractional model to the activity of
mOFC neurons during
“
free choice
”
trials (trials on which both
the risky and safe options offered non-zero expected values), and
compared this advanced fractional model (M1) with other
possible functional forms of normalization: a
“
simple
”
fractional
model (M2), a difference model (M3) that has been argued for in
some cortical
32and subcortical structures
33and a range
normal-ization model (M4) previously used in studies conducted in the
lOFC
11,12(see Fig.
3
and Methods for details). To determine
which model best describes observed mOFC activity, we
compared the AIC term for each model. AIC measures the
goodness of model
fi
t with a penalty for the number of free
parameters employed by the model. As demonstrated for an
example neuron (Fig.
4
a; same neuron as Fig.
2
a), the advanced
fractional model was the best-
fi
tting model among the four
alternatives we explored (
n
=
200, see AIC values in Fig.
4
a,
percent variance explained: trial-based, 13.5%; mean
responses-based, 46%). For each neuron and task epoch with relative coding
activity, we quanti
fi
ed AIC differences between alternative models
and determined which model showed the smallest AIC values
across the population. These AIC differences indicated that the
advanced fractional model best for described mOFC activity at
the population level (Fig.
4
b,
n
=
81, one-sample
t
-test, df
=
80;
M1
–
M2,
P
<
0.001,
t
=
−
4.35; M1
–
M3,
P
<
0.001
t
=
−
3.53;
M1
–
M4,
P
<
0.001,
t
=
−
4.10). We also con
fi
rmed that the
advanced fractional model was better than other potential
alternative models, including ones representing the expected
values of risky options, expected values of safe options, expected
values of chosen options and the choice of risky options, as well
40
Response
0
50
0
50
0
50
0
0 300 0 300 0 300 0 300
PB1 PB2 PB3 PB4
Expected values of risky option (µl)
1. Advanced fractional model 2. Simple fractional model 3. Difference model 4.Range normalization model
R = b + Rmax
EVr
EVr + EVs R = b + G (EVr – EVs) R = b + Rmax
EVr – Vmin
Vmax – Vmin
R = Rmax
+ EVr + EVr + EVs
Fig. 3Potential normalized value coding models. Schematic depiction of predicted neuronal responses in the four alternative normalized value coding models. In each panel, four colored lines indicated the model output (y-axis) in each of payoff block (PB1–4) plotted against the expected values of risky option (x-axis). Expected values of safe option were 60, 120, 180 and 240μl in PB1 to 4, respectively. Model equations are shown in each plot.Rmax,β,σ,b
andGwere free parameters. For this schematic drawing, the following values for free parameters were used; 1. Advanced fractional model,Rmax,βandσ
were 40 spk s−1, 20 and 10μl, respectively; 2. Simple fractional model,Rmaxandbwere 40 and 10 spk s−1, respectively; 3. Difference model,Gandbwere
as a null model and an arti
fi
cial model (Fig.
4
c,
n
=
81,
one-sample
t
-test, df
=
80; M1
–
M5,
P
<
0.001,
t
=
−
8.71; M1
–
M6,
P
<
0.001,
t
=
−
7.76; M1
–
M7,
P
<
0.001,
t
=
−
10.2; M1
–
M8,
P
=
0.009,
t
=
−
2.68; M1
–
M9,
P
<
0.001,
t
=
−
7.09; M1
–
M10,
P
<
0.001,
t
=
−
6.96). In summary, of the models tested, relative
value coding in the activity of mOFC neurons was most
consistent with a divisive normalization computation.
To evaluate the performance of the model, we estimated
percentages of variance explained (see Methods). The divisive
normalization model performed well compared to the other three
relative value models (Fig.
5
), as 40% of the variance was
explained by the advanced fractional model in the mean
response-based estimation in 20 lottery pairs (Fig.
5
a,
n
=
81,
paired
t-
test, df
=
80; M1 vs. M2,
P
<
0.001,
t
=
8.38; M1 vs. M3
EVs,
P
<
0.001,
t
=
6.54; M1 vs. M4,
P
<
0.001,
t
=
7.65). Similar
results were obtained when the percent variance explained was
estimated based on single trial data (Fig.
5
b,
n
=
81, paired
t
-test, df
=
80; M1 vs. M2,
P
<
0.001,
t
=
5.87; M1 vs. M3 EVs,
P
<
0.001,
t
=
4.94; M1 vs. M4,
P
<
0.001,
t
=
5.55), though as expected the single
trial-based percent variance explained was lower than the mean
response-based measure due to trial by trial variability in the neural
activity. Furthermore, cross-validation demonstrated model
expla-natory power in test data as well as training data, with the
advanced fractional model remaining the best model (Fig.
5
c, test
data:
n
=
81, paired
t
-test, df
=
80; M1 vs. M2,
P
<
0.001,
t
=
5.39;
M1 vs. M3 EVs,
P
<
0.001,
t
=
4.55; M1 vs. M4,
P
<
0.001,
t
=
5.45).
Note that percent variance explained decreased even in the training
data since the data size was half the size of the full data set.
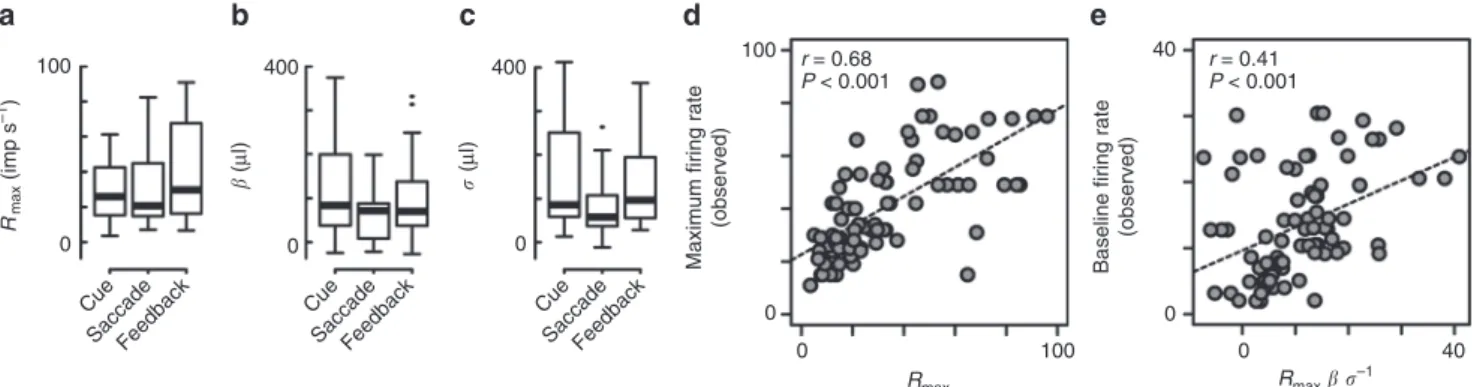
To examine the descriptive ability of the advanced fractional
model, we veri
fi
ed whether the estimated normalization
parameters appropriately described all aspects of neural activity.
Across our population, estimated parameters were stable and
within reasonable ranges, with an
R
maxof ~20 imp s
−1(Fig.
6
a,
n
=
81, Kruskal
–
Wallis test,
P
=
0.44,
H
=
1.62, df
=
2), a
β
of ~80
μ
l (Fig.
6
b,
P
=
0.16,
H
=
3.72, df
=
2) and
σ
of ~90
μ
l
(Fig.
6
c,
P
=
0.07,
H
=
5.38, df
=
2). Notably, estimated
R
maxvalues
were strongly correlated with observed maximal
fi
ring rates
(Fig.
6
d,
n
=
81,
r
=
0.68,
P
<
0.001,
t
=
8.18, df
=
79). Estimated
β
and
σ
parameters were also reliable as follows. We quanti
fi
ed
R
maxβ σ
−1, a term equivalent to output of the normalization
equation when EV
1=
EV
2=
0; this quantity can be thought of as
30
0
AIC differences
AIC differences
imp s
–1
0
–10 Rmax = 34.5
= 46.6
= 62.8
0
–20 HU1057
*
*
*
*
*
*
*
*
*
AIC=1272
AIC=1275 AIC=1282 AIC=1282
0 300
EVr
2. Simple fractional model
1. Advanced fractional model
M1–M2 M1–M3 M1–M4 M1–M5 M1–M6 M1–M7 M1–M8 M1–M9 M1–M10
3. Difference model
4. Range normalization model
a
b
c
Fig. 4The advanced fractional normalization model best explained mOFC relative value coding.aFour model outputsfit to the example neuronal activity encoding relative value (same neuron as shown in Fig.2a). Averagefiring rates and s.e.m. in 20 lottery pairs are plotted in each panel. Colored lines indicate the best-fit lines segregated by payoff block.bPlots of the AIC differences between models estimated across the population. Mean and s.e.m. were estimated for 81 activities that showed relative value coding. AIC differences between model 1 and the other three relative expected value models are shown.cSame asb, but for AIC differences between model 1 and alternative models 5–10. See Methods for details of the models. Asterisk indicates statistical significance of the AIC differences from zero atP<0.01 using one samplet-test
0.4
0
0.3
0
Training
Test 0.15
0
Percent variance explained
(single trial-based)
Percent variance explained (mean response-based) Percent variance explained (mean response-based)
M1 M2 M3 M4 M1 M2 M3 M4
M1 M2 M3 M4
b
c
a
Fig. 5Comparisons of the model performances for relative value coding.a
representing baseline
fi
ring rates in the normalization model
34.
Across our population,
R
maxβ σ
−1values were signi
fi
cantly
correlated with observed baseline
fi
ring rates before the cue
stimuli appeared (Fig.
6
e,
n
=
81,
r
=
0.41,
P
<
0.001,
t
=
4.00, df
=
79). Thus, the estimated parameters of the normalization model
appear to appropriately capture aspects of the observed neural
activity, suggesting that the advanced fractional model may
underlie relative value signals in mOFC neurons.
Decision context and normalized value signals in mOFC
. To
further test whether a normalized value code is speci
fi
cally related
Rmax
(imp s
–1)
(
µ
l)
(
µ
l)
Maximum firing rate
(observed)
Baseline firing rate
(observed)
400
0
100
0
40
0
0 Cue
SaccadeFeedback
Cue
SaccadeFeedback
Cue
SaccadeFeedback
0 100 40
Rmax –1
P < 0.001 P < 0.001
r = 0.41 r = 0.68
Rmax
400
0 100
0
a
b
c
d
e
Fig. 6Comparison of the estimated normalization parameters and observedfiring rates.a–cBox plots of the estimated parameters in the advanced fractional model. TheRmax,β, andσwere plotted separately during three task periods.dPlots of the maximalfiring rate observed in each mOFC
neurons against the estimatedRmax.ePlots of the baselinefiring rate observed in each mOFC neurons against the model output with no value information
(Rmaxβ σ−1). Dashed lines ind,eindicate regression slopes. Correlation coefficients and statistical significance are shown
EVs EVr
0.15
0
Regression coefficient
(forced choice)
Regression coefficient
imp s
–1
0
–150
*
*
AIC differences
Probability density
0.004
0 0.006
0 0.03
0
–100 300
Rmax
–1000 1500
–1000 2000
Forced choice
Free choice 1st-half Free choice 2nd-half
0.05
0
30
0
HU1057
Rmax = 46.8
Forced choice trials
= 243
= 629 Free
choice
1–12 13–2425–3637–4849–6061–7273–84
Forced choice
Regression coefficient (free choice)
0 0.15
Trials from payoff block start
EV of risky option
0 300
M11–M13 M11–M12
a
b
c
d
e
f
g
Fig. 7Attenuated value coding of mOFC neurons during forced choice trials.aPlots of the absolute value of regression coefficients for EVr (gray) and EVs (white) during free and forced choice trials. Mean±s.e.m. during free and forced choice trials: EVr, 0.031±0.002, free choice, 0.017±0.002, forced choice; EVs, 0.042±0.003, free choice, 0.027±0.003, forced choice.bAverage of the absolute value of regression coefficients for EVr and EVs across the trial block. Regression coefficients were estimated every 12 trials from the start of the payoff block. Error bars indicate s.e.m.cActivity plots of the same neuron in Fig.4during the forced choice trials. Color lines indicated the best-fit lines during the forced choice trials. Gray lines indicated the best-fit lines during the free choice trials as shown in Fig.4a.d–fProbability density of the estimated parameters of the models during forced choice trials (brown), the 1st half of the free choice trials (green), and 2nd half of the free choice trials (blue). Ind–f, triangles in thefigures indicate the median.gPlots of the AIC differences between models estimated across the population. AIC differences between model 11 and models 12–13 are shown. Error bars indicate s.e.m. In
to decision making during free choice, we examined neural
activity during the
“
forced choice
”
trials presented to the monkeys
at the beginning of each payoff block. These forced choice trials
presented identical task timing, cue displays and reward
con-tingencies as the previously described free choice trials; however,
in the forced choice trials, the
fi
xation target color (red or yellow)
instructed the monkeys that only the color-matched target would
yield a reward (and that the other target was certain not to
provide a reward).
When the monkeys were instructed by the computer to
“
choose,
”
the relative value signals evident in the regression
coef
fi
cients for the expected values of risky and safe options were
weak when compared to those observed on free choice trials in
the activity of the same neurons (Fig.
7
a,
n
=
81, paired
t
-test;
EVr,
P
<
0.001,
t
=
7.67, df
=
80; EVs,
P
<
0.001,
t
=
4.98 df
=
80;
see also Supplementary Fig.
3
for activity histogram). While the
forced choice trials were presented to the monkeys at the
beginning of PBs, weak modulation in the forced choice trials was
not due to an adaptation process, as might be postulated to occur
in adjacent area lOFC
11,12. The weak modulation in the forced
choice trials were maintained throughout forced choice trials
(Fig.
7
b, one-way analysis of variance (ANOVA): forced choice
trials,
n
=
486 (81 × 3 × 2),
P
=
0.75,
F
=
0.29, df
=
(2, 483)).
Stronger modulation appeared only after the start of free choice
trials (paired
t-
test,
P
<
0.001,
t
=
3.66, df
=
161, the last 12 forced
choice trials vs. the
fi
rst 12 free choice trials) and was maintained
through a payoff block (one-way ANOVA: free choice trials,
n
=
648 (81 × 4 × 2),
P
=
0.35,
F
=
1.09, df
=
(3, 644)). Thus,
relative value coding in mOFC neurons was apparently weaker
when monkeys were forced to choose one option.
Next, we examined the computational basis of these effects by
fi
tting the advanced fractional model to neuronal activity during
forced choice trials. Note that mOFC neurons could encode the
expected values of risky and safe option in two possible ways:
their activity could re
fl
ect the non-selectable option having the
value indicated by the pie chart stimulus (as in the free choice
trials) or the non-selectable option having a value of zero (we
tested both of these possibilities, see Methods). The model
fi
t to
forced choice data in an example neuron (same neuron as in
Fig.
4
a) showed an attenuation of the activity modulation by
relative value, evident as increases in both
β
and
σ
(Fig.
7
c,
β
increased from 47 to 243
μ
l;
σ
increased from 63 to 629
μ
l), with
a slight increase of
R
maxfrom 35 to 47 Hz. The increase in
β
and
σ
parameters produces a decreased sensitivity to relative value
information, which is evident as a shallower slope of model
responses during forced choice trials (color lines) compared to
free choice trials (gray dashed lines). Across our population, we
found increases in estimated
β
and
σ
parameters in forced choice
trials in several cases (Fig.
7
e, f, see brown line indicated by gray
arrows), but also occasional negative values (indicated by black
arrows). In contrast to the similar distribution between early
(green) and late (blue) free choice trials, the parameter
distributions became wider and the density of the peak values
decreased during forced choice trials (brown) (
n
=
243 (81 × 3),
Brown
–
Forsythe test:
β
,
P
=
0.022,
F
=
3.89, df
=
241;
σ
,
P
<
0.001,
F
=
22.4, df
=
241). The distribution of
R
maxparameters during
forced choice trials was also changed (Fig.
7
d,
P
<
0.001,
F
=
16.15, df
=
241). Negative values in estimated
β
and
σ
indicated
that the advanced fractional model was no longer well
fi
t to the
weak value modulations observed in some neuronal activity.
Indeed, performance of the model in describing neuronal activity
was worse in forced choice trials than in the free choice trials
(Supplementary Fig.
4
). Among the four tested models,
however, the advanced fractional model remained the model
that best characterized mOFC activity in the forced choice trials
(Supplementary Fig.
5
). In addition, the activity difference
between free and forced choice trials was not better explained
by behavioral measures, such as percent correct trials or saccadic
reaction times (Fig.
7
g,
n
=
81, one-sample
t-
test, df
=
80;
M11
–
M12,
P
=
0.004,
t
=
−
2.94; M11
–
M13,
P
<
0.001,
t
=
−
3.87).
Thus, the task context for value-based decision making
—
free
versus forced choice
—
changes the normalization computation in
mOFC neurons.
mOFC normalized value signals and risk attitudes of monkeys
.
Lastly, we examined whether the divisively normalized value
signals observed in mOFC activity were related to other aspects of
the decision-making process, in particular the risk attitudes of the
monkeys. We estimated the correlation coef
fi
cient between
behavioral risk attitudes (percentages of risky choice when a
neuron was recorded) and neuronal activity, examined in trials
where the expected values of safe and risky option were identical.
Speci
fi
cally, we examined whether
fi
ring rates in the equal
expected values trials were consistently deviated from the mean
fi
ring rates of the neuron according to the monkey
’
s risk attitude;
under a subjective value code, neural activity would be
system-atically deviated from a linear function as a function of risk
preference of monkeys. We found a slight correlation between
neuronal activity and percentages of risky choices with opposite
signs of the effects among EVr+EVs
−
and EVr
−
EVs+ types
(Supplementary Fig.
6
). Thus, divisively normalized value signals
in mOFC were somewhat related to the risk attitude of monkeys.
Discussion
Normalization is a canonical computational process widely
observed in the domain of sensory processing
35–38, from early
sensory representation to higher-order phenomena such as
multisensory integration
38. Here, we found that mOFC neurons
employ divisively normalized value coding during an economic
decision-making task. This is the
fi
rst demonstration of the
common normalization computation in frontal decision circuits.
This normalization depended on task context: the response
sen-sitivity of mOFC neurons to reward values was stronger when
animals made choices in a free choice task. The normalization
model outperformed other models in the free choice task (Fig.
4
b)
and performed equally well in the forced choice task compared to
other models (Supplementary Fig.
5
a); however, the
normal-ization model better explained relative value coding in free versus
forced choice contexts (Fig.
7
and Supplementary Fig.
4
). These
results suggest that the mOFC is critical for economic decision
making when comparing alternative rewarding options.
In terms of relative value coding, the signals observed in mOFC
(Fig.
2
) are similar in principle to those in lOFC
11,12,16,40. They
represent relative value signals among the set of possible
out-comes in a block of trials. Although it is not known what type of
normalization is employed in lOFC neurons, one possible
dis-tinction between mOFC and lOFC in terms of relative value
coding is the dependency on the behavioral context. The free
choice-speci
fi
c relative value coding in mOFC (Fig.
7
) may
represent a key difference from lOFC neurons, where relative
value signals are observed even in non-choice situations during
classical conditioning
12. The enhancement of value signals during
free choices is consistent with the
fi
nding in human mOFC that
value signals are speci
fi
cally observed when subjects evaluate
economic options
41. Enhanced value signals during free choice
have also been found in the activity of monkey amygdala
neu-rons
42,43, which is connected to the orbitofrontal cortex. Thus,
mOFC could regulate behavioral sensitivity to reward values
44(i.e., gain) depending on behavioral context.
Many normative models of choice assume that values are
repre-sented in an absolute manner
8–10. Under absolute value coding, the
neuronal discharge rate does not depend on what other values might
have been encountered. In contrast, under normalized coding, the
neuronal discharge rates re
fl
ecting a given value will depend on
factors such as other present and past values. Relative value signals
have been examined in single neuron activity in regions including
prefrontal
11,12,16and parietal cortex
34, and striatum
45with relatively
few examples of studies using human neuroimaging
14,46. This
dis-crepancy in the literature may arise from multiple differences in
species and methodologies. Blood oxygenation level dependent
(BOLD) activity is often examined using a linear regression
approach which would be unable to identify nonlinear normalized
signals, but instead would tend to identify such signals as mixtures or
positive and negative regression coef
fi
cients
47,48. Indeed, there have
been only a couple efforts to search speci
fi
cally for nonlinear
normalization-type representations in the BOLD signal
49and these
efforts have been successful to some degree.
How are divisively normalized value signals related to the
mon-key
’
s choice behavior? This still remains an open question, but one
possible explanation is that divisive normalization, which yields
decreased neural value sensitivity with increases in total values, would
yield decreased sensitivity to increase in values in behavior, known as
the subjective value or utility. Recent works in economic
decision-making studies hypothesized that neuronal activity is linearly
cor-related with subjective value functions, an approach successfully
examined in human imaging
21,50and monkey electrophysiology
51,52experiments. Our results suggest that the divisively normalized value
signals in mOFC were at least related to the risk attitudes observed in
corresponding monkey behavior. However, the precise relationship
between normalized value coding in mOFC and behaviorally derived
subjective values remain unknown, and further experimental and
theoretical work will be required to link behavioral and neural
observations for relative value coding.
The ef
fi
cient coding hypothesis assumes that the neural code
adapts ef
fi
ciently to the present behavioral context, and that
neurons change their
fi
ring rates in order to utilize their entire
dynamic range during encoding
13. Ef
fi
cient coding requires
input
–
output functions to use the entire response range to
represent the stimulus distribution
53. In the domain of sensory
systems for perception, a large literature supports the hypothesis
that normalization is employed to achieve ef
fi
cient coding
17.
Moreover, a recent
fi
nding by Coen-Cagli et al.
54shows that
normalization processes in primary visual cortex can be
fl
exibly
gated depending on the sensory context. In contrast to the
sen-sory domain, only a couple of direct and indirect tests have been
conducted to examine the implementation of ef
fi
cient coding in
decision making
11,12,14,34. Our current study highlights that
value-based divisive normalization occurs in frontal decision
circuits; furthermore, the modulation of this normalization by the
behavioral choice context suggests that the
fl
exible gating of
contextual information occurs in both sensory and
decision-related computations. The existence of such context-speci
fi
c value
normalization suggests that the mOFC contributes to the
con-struction of value critical for economic decision making.
Methods
Subjects and experimental procedures. Two rhesus monkeys were used (DE, 7.5 kg, 6 years; HU, 8.0 kg, 6 years). All experimental procedures were approved by the New York University Institutional Animal Care and Use Committee and performed in compliance with the US Public Health Service’s Guide for the Care and Use of Laboratory Animals. Each animal was implanted with a head-restraint prosthesis and a scleral eye coil55. Eye movements were measured using a scleral coil at 500 Hz. Visual stimuli were generated by cathode ray tube (CRT) 30 cm away from the monkey’s face when they were seated. After subjects practiced the lottery task for 6 months, they were proficient at making choices of risky and safe options30.
Electrophysiological recording. We used conventional techniques for recording single neuron activity from mOFC. Monkeys were implanted with recording chambers (Crist Instrument) targeting the medial part of the prefrontal cortex, centered midline and 30 mm anterior in stereotaxic coordinates. Chamber location was verified using anatomical magnetic resonance imaging (Siemens). In each recording session, a stainless steel guide tube was placed within a 1 mm spacing grid (Crist Instrument), and a tungsten microelectrode (1–2 MΩ, FHC) was passed through the guide tube. The electrode was lowered until reaching close to the bottom of the brain after passing through the cingulate cortex. Electrophysiological signals were amplified, band passfiltered and monitored and single neuron activity was isolated based on spike waveform. We recorded 182 mOFC neurons from four hemispheres of two monkeys (Supplementary Fig.2). All single neuron activity was sampled when the activity of an isolated neuron showed a good signal-to-noise ratio (>3). No blinding was made. Sample size to detect the effect size (number of the recorded neurons, number of the recorded trials in a single neuron and number of the monkey used) was in estimated reference to the previous study34.
Cued-Lottery task. Animals performed one of two visually cued saccadic choice tasks: forced choice and free choice trials. The color of the central target indicated forced choice (red or yellow, indicating which of the two options was rewarded) or free choice (gray) trials.
Forced choice trials: If the centralfixation target was red or yellow, monkeys were required to choose the color-matched target in order to receive any reward. Each trial started with a 0.3 s 500 Hz tone, after which the monkey had 1.0 s to align gaze to within 2° of a 1° diam centralfixation target. Afterfixating for 0.4 s, two peripheral 8° pie charts providing information about reward magnitude for each of the two options were presented for 0.5 s, 8° to the left and right offixation. Red and yellow 1° choice targets appeared at these same locations 0.1 s after cue offset. At 0.3 s later, thefixation point disappeared, cueing saccade initiation. A correct saccade that shifted gaze to within 3.5° of the choice target matching the color of thefixation target could yield a water reward. Red and yellow colors were randomly assigned to fixation and peripheral targets on each trial. When the centralfixation target cued a “safe”reward, animals received the reward indicated by the pie chart if they shifted gaze to the associated target. When thefixation color cued a choice to the risky target, animals received the reward indicated by the pie chart with a probability of 0.5, otherwise no reward. A 1 and 0.1 kHz 0.3 s tone indicated reward and no-reward outcomes, respectively. A high tone preceded a no-reward by 0.2 s. A low tone indicated that no reward would be delivered, but that the task had been performed correctly. If animals chose a non-match target, the trial was aborted. A 2.0 s inter-trial interval followed. Aborted and error inter-trials were presented again.
Free choice trials: Trials began with the onset of a gray centralfixation target. As in the forced choice trials, pie charts indicated the magnitude of safe and risky rewards. After offset of thefixation target, animals were free to choose by shifting gaze to either target. The locations of the risky and safe targets werefixed during a block of trials.
Pay-off and block structure. Pie-charts indicated reward magnitudes from 60 to 600 μl in 60μl increments (Fig.1a). A 5μl reward was signaled by a blank pie chart. During data collection, blocks of 86 trials were presented, in random order, built from one of the 4 payoff blocks (Fig.1c). Thefirst 36 trials (6 repeats times 6 conditions,five risky and one safe choices) in a block were forced choice trials. Then, 50 free choice trials (10 of each 5 type) followed. During a block the safe option wasfixed and the magnitude of the risky option varied randomly across its 5 possible values (Fig.1b). The middle-valued risky target always offered a reward of the same expected value as the safe target in that block. A new block with a new payoff was then presented.
tube (0.9 mm inner diameter) was attached to the tip of the delivery tube to reduce the trial-by-trial variability of reward supply. The amount of reward in each payoff block was calibrated by measuring the weight of water to 0.002 g precision (hence 2µl) in single trial basis. Note that if we used bigger diameter tubes attached to the tip (4 mm inner diameter), the variability of reward sizes increased dramatically.
Statistical analysis. For statistical analysis, we used the statistical software package R (http://www.r-project.org/). All the statistical tests we used were two tailed.
Behavioral analysis. We examined whether monkey's choice behavior depended on the relative value of risky and safe options. In each payoff block,five risky options were paired with one safe option asfive types of lottery pairs (LP) in terms of their relative values; expected values of risky options were either considerably larger than the safe option (LP5), slightly larger (LP4), equal (LP3), slightly smaller (LP2) or considerably smaller (LP1). We examined whether the percentage of risky choices in each payoff block changed in parallel with the relative values of risky option against safe options by plotting the percentage of risky choices in each of the four PBs (Fig.1d). The behavioral results have been previously reported in Yamada et al.30In addition, we quantified the percentages of correct trials (i.e., non-aborted trials) in each of the 20 lottery pairs and saccadic reaction times (latency of responses after thefixation point disappeared).
Neuronal analysis. We analyzed neuronal activity during three task periods: cue period (1.0 s window after cue onset), saccade period (1.0 s window after saccade onset) and feedback period (1.0 s after feedback onset). The maximumfiring rate of a neuron was defined as the maximalfiring rate in a trial during the three task periods. The baselinefiring rate of a neuron was defined as the averagefiring rate in the 600 ms window just before cue onset. To display peri-stimulus time histograms of neural activity (Fig.2a, c), the average activity curves were smoothed using a 100 ms Gaussian kernel (σ=100 ms).
Relative value signals. To prescreen relative value signals in the activity of mOFC neurons without normalization equations, wefirst determined whether mOFC neurons signal relative value by using a variable selection approach. Neuronal discharge rates (F) werefitted by a linear combination of the following variables:
F¼b0þb1EVrþb2EVsþb3Fb ð1Þ
where EVr and EVs were the expected values of risky and safe options, respectively. The Fb, feedback type, took scalar values (1, 0) in reward and no-reward trials and was included only during the feedback period.b0was the intercept. Among many possible combinations of these variables (b0, EVr, EVs, Fb), we selected one model that contained the combination of variables showing minimal AIC:
AIC Modelð Þ ¼ 2logð Þ þL 2k ð2Þ
whereLis the maximum likelihood of the model andkis the number of free parameters in the model. If the selected model contained EVr and EVs and their coefficients showed opposite signs (i.e., positiveb1and negativeb2or negativeb1and positiveb2), the discharge rates were regarded as being modulated by the relative value of risky and safe options. Two types of relative value modulation (positiveb1 and negativeb2: EVr+EVs−, or negativeb1and positiveb2: EVr−EVs+) were
iden-tified. Neuronal activity during free choice trials was used for this classification.
Choice signals. To examine whether the mOFC neurons signal the spatial choice of monkeys, we also analyzed neuronal discharge rates by using a variable selection. The model used for this approach included an additional parameter for spatial choice location:
F¼b0þb1EVrþb2EVsþb3Fbþb4Cho ð3Þ
where Cho took scalar values (1, 0) in the trials if the monkey chose the left and right targets, respectively. Fb was included only during the feedback period. Among all possible combinations of these variables, we selected one model that contained one combination of variables showing minimal AIC. If the selected model hadb4 withoutb1–b3, the discharge rates were regarded as being exclusively modulated by the left–right target choice. Note that the percentage of the activity modulated by the relative values of options was not different than that estimated using Eq.1.
Normalization models. 1. Advanced fractional model: The normalization equation was originally proposed to describe nonlinear response properties in early visual cortex, and later discovered to characterize neural activity in other sensory pro-cessing areas and modalities17; recent work showed that normalization extends to reward coding in parietal cortex13. Under the condition where a subject chooses one option from two alternatives, the neuronal response to option 1,R1, depends on the expected value of the two options:
R1¼Rmax
βþEV1 σþEV1þEV2
ð4Þ
where EV1and EV2are the expected values of option 1 and 2, respectively.Rmax,β andσare free parameters.Rmaxdetermines the maximal level of neural activity.β andσdetermine the relative contribution of the expected values to neuronal response, withβgoverning the theoretical level of activity when no cue stimulus appeared andσdetermining the sensitivity of neuronal responses to the expected values (largeσmeans low sensitivity).
In the lottery task, the two options were defined as risky and safe options, respectively, as follows. If the activity of the relative value coding neuron showed positive and negative regression coefficients to the expected values of the risky (EVr) and safe (EVs) options, respectively (i.e., EVr+EVs−type), EV1and EV2 were the EVr and EVs, respectively. If the neuronal activity showed negative and positive regression coefficients to EVr and EVs, respectively (i.e., EVr−EVs+ type),
EV1and EV2were the EVs and EVr, respectively.
2. Simple fractional model: The simple fractional model is a simplified form of the normalization equation presented above. In the model, neuronal response to option 1,R1, is given by:
R1¼Rmax EV1 EV1þEV2
þb ð5Þ
As above, EV1and EV2are the expected values of options 1 and 2, respectively.
Rmaxdetermines the maximal level of neural activity andbis the baselinefiring rate when no cue stimulus appears.Rmaxandbare free parameters. In the lottery task, if the activity of the relative value coding neuron showed positive and negative regression coefficients for EVr and EVs, respectively (i.e., EVr+EVs−type), EV1 and EV2were EVr and EVs, respectively. If the neuronal activity showed negative and positive regression coefficient to EVr and EVs, respectively (i.e., EVr−EVs+
type), EV1and EV2were the EVs and EVr, respectively.
3. Difference model: In the difference model, neuronal response,R1, is a simple linear function of the value difference between the two options:
R1¼GðEV1 EV2Þ þb ð6Þ
Gdetermines the magnitude of neural response to value difference (i.e., gain), andbis the baselinefiring rate when the expected values of options are equal or no cue stimulus appeared.Gandbwere free parameters. This model is often used in reinforcement learning models33and race-to-threshold models32.
4. Range normalization model: A phenomena called range adaptation has been observed in the activity of lateral OFC neurons11,12. The normalization equation has not been clearly established to describe this type of neuronal activity, but we assume the following equation as a range normalization model; this formulation has been found to describe the activity modulation in lOFC neurons observed previously (Fig.3, right panel). In range adaptation, the relative value of an option depends on the range of reward values of all options available in a block of trials. In the model, neuronal response to option 1,R1, depends on the relative position in the distribution of values:
R1¼RmaxEV1 Vmin
Vmax Vmin
þb ð7Þ
Where EV1was the expected value of option 1.VmaxandVminare the largest and smallest reward values in a block of trials, respectively. The denominator defines the range of the reward values in a block of trials, while the numerator indicates relative position of the expected values of option 1 according to the minimal value in the distribution of values, and thus, they represents the relative position of the expected values of option 1 as a percentage in the distribution of values in a block of trials.Rmaxdetermines the semi-saturatingfiring rate andbis the baselinefiring rate when no cue stimulus appears.Rmaxandbare free parameters. Note that in this assumed model, the value is not normalized by the values of other options, but rather by the range of reward values available in a block of trials.
In the lottery task,VmaxandVmininfirst payoff block were 240 and 0μl (no reward), respectively, and hence the value range was 240μl. In the second payoff block they were 360 and 0μl, and the value range was 360μl. In the third and fourth payoff blocks, value ranges were 480 and 600μl, respectively. As seen in Fig.3(“Range normalization model”), this model formulation predicts a block-dependent range adaptation in neuralfiring rate: the predicted sensitivity of neuronalfiring rate to risky values decreases as value range increases according to payoff block. Indeed, the output of the model was very similar to previously published results (Figs. 5B and 6B in Padoa-Schioppa, 2009)11.
Other possible alternative models. 5. Expected values of risky options: In the model, neuronal response,R1, is a simple linear function of the expected values of risky options:
R1¼aEVrþb ð8Þ
6. Expected values of safe options: In the model, neuronal response,R1, is a simple linear function of the expected values of safe options:
R1¼aEVsþb ð9Þ
adetermines the magnitude of neural response to the expected values of safe options andbis the baselinefiring rate.aandbare free parameters.
7. Expected values of chosen options: In the model, neuronal response,R1, is a simple linear function of the expected values of options monkeys chosen in the current trials:
R1¼aEVchosenþb ð10Þ
adetermines the magnitude of neural response to the expected values of chosen options (EV chosen) andbis the baselinefiring rate.aandbare free parameters.
8. Choice of risky options: In the model, neuronal response,R1, is a simple function of whether monkeys chose risky option or not in the current trials (RiskyCho):
R1¼aRiskyChoþb ð11Þ
Where RiskyCho took scalar values (1, 0) in the trials if monkey chose risky and safe options, respectively;adetermines the magnitude of neural response to the choice of risky option andbis the baselinefiring rate.aandbare free parameters.
9. Null model: In the model, neuronal response,R1, is only a function of the meanfiring rate:
R1¼b ð12Þ
bdetermines the meanfiring rate.bis a free parameter.
10. An artificial model: In the model, neuronal response,R1, is a function of the expected values of risky options in each payoff block:
R1¼a1EVrþb1þa2EVrþb2þa3EVrþb3þa4EVrþb4 ð13Þ
a1–a4determine the magnitude of neural response to the expected values of risky options in the payoff block number 1 to 4, respectively.b1-b4are the baselinefiring rate in the payoff block number 1 to 4, respectively.a1-a4andb1-b4are free parameters.
To evaluate the relationship between our primary relative value models and other known characteristics of OFC value representations, we calculated correlation coefficients between the relative expected values (derived from the fractional model, difference model and range model) and other possible known explanatory variables51, such as the expected values of risky options, expected values of safe options, expected values of chosen options and choice of risky options (Supplementary Table1). Note that these relative expected values were defined with no-free parameters, since the estimated free parameters mentioned above were different neuron by neuron.
Fitting and selection of normalization models. To identify the best structural model to describe the activity of mOFC neurons, we examined the four relative expected value models as well as six other alternative models. Wefitted the 10 alternative models to the activity of each single neuron that demonstrated relative value coding as defined by our regression analyses. In each of the models, we estimated a combination of the best-fit parameters to explain neuronal discharge rates by using the statistical software package R. Best-fit parameters were estimated in each epoch of the activity of the neuron based on single trialfiring rates. We used the nls() function with random initial values (repeated 100 times). In this function, a set of parameters that minimize non-linear least squared values were estimated. Across the population, the best-fit model showing minimal AIC was selected by comparing AIC differences among models. If the AIC differences against the nine other models was significantly different from zero atP<0.05 by one-samplet-test, the model was defined as the best model. The estimated para-meters in the best-fit model were compared by using parametric and non-parametric tests, respectively, with a statistical significance atP<0.05. Note that models were separatelyfitted to the free choice and forced choice trial data.
Evaluation of model performance. To evaluate model performance, we estimated the percentages of variance explained, which is defined as one minus percentage of the residual variances out of total variances. The percent variance explained in each neuron was estimated based on either single trial data or mean responses data (segregated by the 20 lottery pair conditions). The mean response-based percent variance explained is similar in principle to explainable variance56. To validate the accuracy of estimation and model selection, we performed two-fold cross-validation (i.e., half split) in each of the modelfits as follows. First, we prepared training data and test data, by randomly dividing the data in half in each of 20 lottery pairs. Models werefitted to the training data and best-fit parameters were estimated. By using these estimated parameters, percentages of variance explained were estimated for the test data.
Modelfit during forced choice trials. During the forced choice trials, monkeys were required to choose the color-matched targets. If they selected the other target, the trial was aborted and no reward was received. There are two alternative ways in
which mOFC neurons could encode the expected values of the risky and safe options in such a situation and we tested both of them.
One possibility is that in the forced choice trials, mOFC neurons encode the expected values of both risky and safe option in the same manner as in the free choice trials (assumption 1). To examine this possibility, wefitted all four models using the same assumptions as in free choice trials. The other possibility is that mOFC neurons only encode the expected value of options that are available to the chooser. In this case, they would encode the value of the color-matched target, but they would encode the value of non-selectable option as 0 independent of the reward size cued for non-matched target (assumption 2). This is because no matter what reward size is associated with the non-selectable cue, choosing it gives no reward since a trial is aborted after the choice of a non-matched target. To examine this possibility, wefitted the models with a slight modification—the value of non-selectable options was set to zero. For the option forced to choose, those values were defined as those in the free choice trials (i.e., the values cued by pie chart).
Wefitted the four alternative relative value coding models to the data under both of these two assumptions and compared AIC values (Supplementary Fig.5). Percentage of the variance explained by the models was compared using the paired
t-test with a statistical significance atP<0.05 (Supplementary Fig.4).
Modelfit including behavioral measures. To examine whether the activity dif-ference between free and forced choice trials could be explained by difdif-ferences in state (i.e., motivation or attention) rather than differences in context, wefitted the following three modified versions of advanced fractional models. The models were simultaneouslyfitted to both free and forced choice trial data.
11: R1¼Rmax
βþEV1 σþEV1þEV2
þaContext ð14Þ
12: R1¼Rmax
βþEV1 σþEV1þEV2
þaPercent correct ð15Þ
13: R1¼Rmax
βþEV1 σþEV1þEV2
þaRT ð16Þ
Where Context took scalar values (1, 0) in the free and forced choice trials, respectively. Percent correct was the percentages of the correct trials estimated in each of 20 lottery pairs in a given neuronal recording period. RT was the saccadic reaction time after the centralfixation target disappeared.Rmax,β,σandaare free parameters. We compared AIC to define which model best explained the activity difference between free and forced choice trials.
Data availability. All relevant data are available from the authors.
Received: 9 March 2017 Accepted: 13 December 2017
References
1. Camerer, C. F. Neuroeconomics: opening the gray box.Neuron60, 416–419 (2008).
2. Glimcher, P. W. & Rustichini, A. Neuroeconomics: the consilience of brain and decision.Science306, 447–452 (2004).
3. Montague, P. R. & Berns, G. S. Neural economics and the biological substrates of valuation.Neuron36, 265–284 (2002).
4. Ongur, D. & Price, J. L. The organization of networks within the orbital and medial prefrontal cortex of rats, monkeys and humans.Cereb. Cortex10, 206–219 (2000).
5. Sugrue, L. P., Corrado, G. S. & Newsome, W. T. Matching behavior and the representation of value in the parietal cortex.Science304, 1782–1787 (2004). 6. Platt, M. L. & Glimcher, P. W. Neural correlates of decision variables in parietal
cortex.Nature400, 233–238 (1999).
7. Rudebeck, P. H. & Murray, E. A. The orbitofrontal oracle: cortical mechanisms for the prediction and evaluation of specific behavioral outcomes.Neuron84, 1143–1156 (2014).
8. Von Neumann, J. & Morgenstern, O.Theory of Games and Economic Behavior. (Princeton Univ. Press, New Jersey, 1944).
9. Stephens, D. & Krebs, J.Foraging Theory(Princeton Univ. Press, New Jersey, 1986).
10. Kahneman, D. & Tversky, A. Prospect theory: an analysis of decisions under risk.Econometrica47, 313–327 (1979).
11. Padoa-Schioppa, C. Range-adapting representation of economic value in the orbitofrontal cortex.J. Neurosci.29, 14004–14014 (2009).