2
R&D Trends in Flat Panel Display Technology
HIROSHI KOMATSU Information and Communications Research Unit
1 Introduction
1-1 The most familiar information terminal
Of the five senses, sight contributes most to the human ability to gather information, accounting for over 80% [1]. Personal computers and mobile phones are usually operated through display. In years to come, human interfaces based on visual recognition, typically graphical user interfaces (GUI), will play an increasingly important role in enabling people to operate electronic equipment loaded with an increasing number of functions.
The most important key device of these visual interfaces is the display.
T he bl ack - a nd - wh ite tele v i s ion, wh ich appeared in the 1950s, once constituted together with the washing machine and the refrigerator, the “three sacred treasures” of the household.
During the Izanagi Boom, a major economic boom in the 1960s, these three were replaced by the “3Cs”-the color TV, the air conditioner, and the car. Recently, a new version of the three sacred treasures has emerged among the digital household appliances that are driving consumer spending: the flat panel TV, the digital camera, and the DVD (Digital Versatile Disc) recorder (Table 1). Each generation of these treasures includes TV, so TV has, since its advent, been a central consumer product.
TV has recently undergone a transformation b e c a u s e o f t h e d e v e l o p m e n t o f d i s p l a y technology. The digitization of TV broadcast signals improves resolution and other image qua l it y aspects. I n a move towa rd dig ita l broadcast, TV displays are required to show high - definition image without degrading the quality of the original image. High- definition
pictures are at the same time spurring demand for larger screens. Since conventional T Vs with a Braun tube, also known as a cathode ray tube (CRT), cannot adequately meet this demand because of depth dimension and weight constraints, liquid crystal display (LCD) and plasma display are attracting attention as key devices for next-generation flat panel TVs.
1-2 A hopeful market
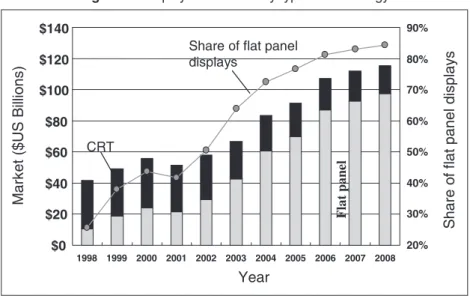
The worldwide display market was valued at approximately ¥7 trillion in 2003 and is projected to grow to roughly ¥12 trillion by 2008 (Figure 1). The share of flat panel models in all display products was over 50% in value terms in 2002, surpassing CRT displays. The proportion is expected to continue growing, exceeding 80% by 2006.
The rapid growth of the f lat panel display market since 2003 can in part be attributed to replacement demand for large - screen TVs in response to the expanded coverage of terrestrial digital broadcasti ng. Lured by the grow th forecasts, more companies are moving into the flat panel TV market. One of them is Dell Inc.
(Dell Computer Corp. until last November), which announced its entrance into this market in a tradeshow held in the U.S. in early 2004.
This article describes R&D trends in flat panel display technology, an element that supports the Table 1 : Changes in the three major consumer products
Three sacred
treasures 3Cs
The new three sacred
treasures Monochrome TV Color TV Flat panel TV Washing machine Cooler
(air conditioner) Digital camera
Refrigerator Car DVD recorder
evolution of the TV toward higher definition and larger screen size, and examines the challenges faced by this technology.
2 What is a flat panel display?
2-1 Principle and characteristics
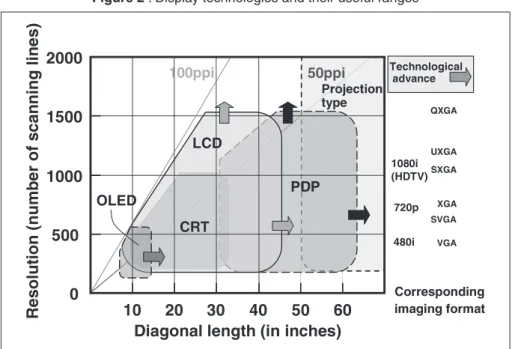
Among the other display technologies, this report primarily discusses, compared with traditional CRT displays, f lat panel display technologies that have been, or are officially planned to be, commercialized as TVs. Table 2 summarizes the principle and characteristics of the display technologies covered. Figure 2 shows the area of strength for each type of display in terms of screen size and resolution.
Table 2 describes each display technolog y from the viewpoint of the light source and the dimming (luminance) control mechanism. In CRT
technology, fluorescent materials, or phosphors, are excited by electron beams and jump to a high- energy state; they then emit light when returning to the low-energy ground state. On the other hand, an LCD panel carries a fluorescent lamp called the backlight. For luminance control, it electrically changes the orientation of the liquid-crystal film placed in front of the backlight.
A plasma display, which has an array of numerous miniature discharge tubes that form pixels, emits light by exciting phosphors by ultraviolet light generated by plasma discharge. A plasma display lights up based on the same principle as an ordinary fluorescent lamp and uses xenon (Xe) as the inert gas, whose resonance line is at a wavelength of 147 nm. On the other hand, the fluorescent lamp in an LCD display uses 254 nm ultraviolet rays, which correspond to the resonance line of mercury (Hg). Therefore, Figure 1 : Display market size by type of technology
Source: A report by DisplaySearch
Table 2 : The principle and characteristics of display technologies Technology Abbreviation Light source Luminance control Thinner
panel
Larger screen
Mass production
Power consumption Liquid Crystal LCD (Liquid Crystal
Display)
Backlight (fluorescent lamp, non-emissive)
Change in liquid
crystal orientation ○ △ ○ ○
Plasma PDP (Plasma Display Panel)
Light emission from phosphors excited by ultraviolet light
Intensity of the light
emission of plasma ○ ◎ △ △
Organic EL
OLED (Organic Light-Emitting Diode)
Light emission during recombination of excited electrons
Intensity of light emission by injected
electrons ◎ × × ○
Braun tube CRT
(Cathode Ray Tube)
Light emission from phosphors excited by electron beams
Intensity of electron
beams × △ ◎ ○
◎ : Very good ○ : Good △ : Fair × : Difficult
these two technologies usually use different t ypes of phosphor. The light source of an organic EL display is the light emitted when the electrons injected into organic light- emitting diodes recombine with the holes. LCD panels are called non-emissive displays because of their dependence on an external light source.
In plasma display technology, the larger the pixel size, or the screen size, the easier the manufacturing process, due to the luminous efficiency of the discharge tubes that constitute the pixels. On the other hand, large - screen LCD panels that are constrained by the need to ensure the uniformity of optical films and bottlenecks in the liquid cr ystal injection process during manufacturing, for example, have been considered difficult to produce at a reasonable cost. Therefore, it was expected that LCDs and plasma displays would form separate markets in terms of screen size with LCDs thriving in the under-30 -inch market and plasma products dominating the over-30 -inch market. Recently, however, production lines for so-called sixth-generation LCD panels have been in operation, allowing manufacturers to launch LCDs with screens of over 40 inches. Moreover, even some makers of organic EL displays have announced plans to develop technology aiming at large - screen TVs. Nowadays, screen size is no longer a critical issue in discussing flat panel technologies.
2-2 History of technological development
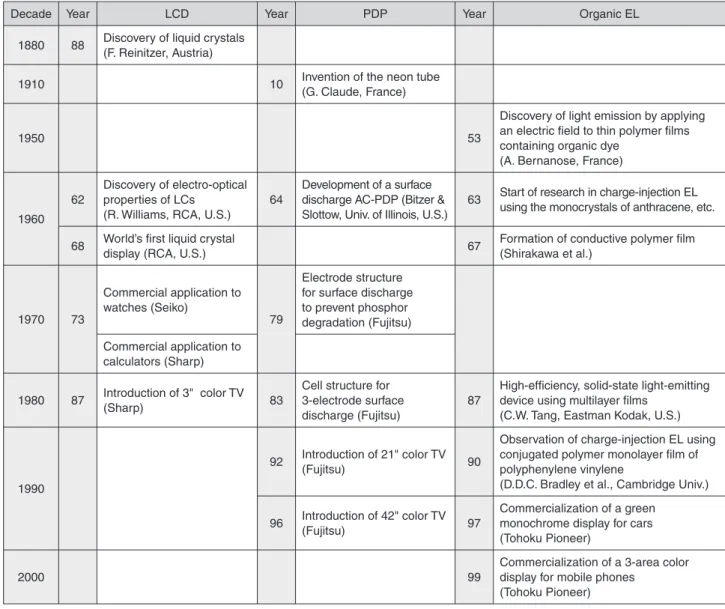
Table 3 lists major events in the development of display technology, including the discovery of display principles, the invention of basic technologies for application, the introduction of the first commercial model, and the launch of the first color TV.
As Table 3 shows, Japanese scientists have not necessarily been involved in early breakthroughs such as the discovery of the fundamental display principles and the invention of basic technologies for electronics application. The quality of each display type immediately after fundamental technology development was far from sufficient for application to TVs. For example, digital watches and calculators, the products for which LCD technology was first applied as display devices, initially showed numbers and characters using pixels called segments. The response of these displays was very slow, taking almost 1 second depending on ambient temperature.
Likewise, early plasma displays consumed so much power per luminance that they were dubbed “flat panel heaters.” Japanese companies, however, made persistent efforts to improve these quality problems and successfully introduced these technologies onto the market.
Organic EL displays are already in commercial use for some mobile phone models. However, there are still some technical hurdles such Figure 2 : Display technologies and their useful ranges
* For details of the corresponding imaging formats, see the appendix at the end of this article
as support for larger screens and improved endurance. In addition, their operating lives, which are currently between 1,000 and 2,000 hours, are insufficient for application to TVs. In May 2004, Seiko Epson Corporation announced that it would release a large-screen (40-inch) TV based on organic EL technology in 2007, which will probably have a longer life.
Since Kenjiro Takayanagi, who successfully demonstrated an electronic television system for the first time in 1926, Japanese researchers have been pioneering the application of new technologies to TV, and have improved the characteristics of LCD and PDP technologies, leading to commercialization. Even in the field of organic EL displays, the next potential technolog y, Japanese companies cur rently lead the world in commercialization, including application to mobile phones, and promote R&D activities for application to TVs.
Thus, in every type of technology, Japan’s R& D efforts to commercialize new display technologies have been successful.
2-3 The recent state of technological development
(1) Lower power consumption
The power consumed by a display increases in proportion to the screen size, provided that the luminous efficiency of the light source and the display surface luminance remain the same.
By increasing screen size and definition, it is necessary to reduce power consumption. Table 4 shows a roadmap of display technologies in terms of lower power consumption and other properties, assuming application to current TVs.
Table 4 includes the power consumption target in each technology. Improving the luminous efficiency of the light source is essential for reducing display power consumption. The Table 3 : History of display technology development
Decade Year LCD Year PDP Year Organic EL
1880 88 Discovery of liquid crystals (F. Reinitzer, Austria)
1910 10 Invention of the neon tube
(G. Claude, France)
1950 53
Discovery of light emission by applying an electric field to thin polymer films containing organic dye
(A. Bernanose, France)
1960 62
Discovery of electro-optical properties of LCs
(R. Williams, RCA, U.S.)
64
Development of a surface discharge AC-PDP (Bitzer &
Slottow, Univ. of Illinois, U.S.)
63 Start of research in charge-injection EL using the monocrystals of anthracene, etc.
68 World’s first liquid crystal
display (RCA, U.S.) 67 Formation of conductive polymer film
(Shirakawa et al.)
1970 73
Commercial application to watches (Seiko)
79
Electrode structure for surface discharge to prevent phosphor degradation (Fujitsu) Commercial application to
calculators (Sharp) 1980 87 Introduction of 3" color TV
(Sharp) 83
Cell structure for 3-electrode surface discharge (Fujitsu)
87
High-efficiency, solid-state light-emitting device using multilayer films
(C.W. Tang, Eastman Kodak, U.S.)
1990
92 Introduction of 21" color TV
(Fujitsu) 90
Observation of charge-injection EL using conjugated polymer monolayer film of polyphenylene vinylene
(D.D.C. Bradley et al., Cambridge Univ.) 96 Introduction of 42" color TV
(Fujitsu) 97
Commercialization of a green monochrome display for cars (Tohoku Pioneer)
2000 99
Commercialization of a 3-area color display for mobile phones
(Tohoku Pioneer)
luminous efficiencies target indicated in the above roadmap will be 4 -14 lm/W*1 by 2010, from 1-2 lm/W (current actual values) although slightly varying from one technology to another in 2000.
Approaches to improving luminous efficiency differ depending on display technology. In the case of LCDs, ongoing attempts include changing the backlight from the current multiple cold-cathode fluorescent lamp (CCFLs) to a single flat lamp for higher light source efficiency and using multiple light-emitting diodes (LEDs) as the light source.
For plasma display, improvement in efficiency is considered i n three stages, namely, the emission of ultraviolet light through electrical discharge, visible light emission from fluorescent materials irradiated with ultraviolet rays, and the extraction of visible light. Researchers are taking approaches such as improving discharge cells and the electrode structure, finding a better voltage application sequence for plasma operation, optimizing xenon partial pressure, and optimizing the characteristics of red, green, and blue phosphors.
In the area of organic EL display, fluorescent materials have been the major consideration in improving luminous efficiency. When excited by the recombination of electrons and holes, fluorescent materials produce two high-energy states, which are called the triplet and singlet excited states. However, it is only substances in the singlet state that contribute to light emission.
For higher luminous efficiency, phosphorescent materials in which substances contribute to light emission even in the triplet excited state, have been studied as a substitute for fluorescent materials. Since the energy density of the triplet excited state is theoretically three times greater than that of the singlet excited state, a four-fold increase in luminous efficiency can be expected using phosphorescent materials.
(2) Wider color gamut
The NTSC*2 color TV standard was established in 1953 in the U.S. In the 1970s, NHK ( Japan Broadcasting Corporation) began developing a provisional standard for high- definition TV (HDTV), a next- generation TV technology for a wider, larger screen with high - resolution pictures. In contrast to these advances i n resolution, the color gamut[3] has fallen short of the level initially set by the standard. This refers to the range of colors that an entire imaging system, including the display, can reproduce. The HDTV standard supports a narrower color gamut than NTSC, which is more feasible. However, the need for the accurate reproduction of actual colors has significantly increased recently, for such purposes as desktop publishing (DTP) in the printing industry, film-making, e-commerce, and telemedicine. In the XY chromaticity diagram, conventional displays can reproduce a color range no more than roughly 70% of Adobe RGB*3, the color space standard for high - end digital cameras. In these application fields, operators, who often need to print out designs and digital images created on computers and check the color of input data, want to perform color checking on their displays.
To meet this demand, researchers are examining two approaches to expanding the color gamut of displays. One is to increase the color saturation of red, green, and blue (RGB), which are the primary colors of light. For LCDs, for example, some researchers are considering using an array of high-power RGB LEDs as the light source, instead of traditional cold cathode fluorescent tubes, to increase backlight color saturation, which can help reproduce the original color[4].
The other is to use more basic colors, in addition to RGB, to expand the range of color Table 4 : Display technology roadmap
Year of achievement 2000 2005 2010
Screen size Diagonal (inch) 32 50 50 Definition (ppi) 15-40 40-50 50-100
Luminous efficiency (lm/W)
LCD 2 3 4
PDP 1.2 5 10
OLED 1-2 7 14
CRT 2 2 2
Power consumption (W)
LCD 140 120 100
PDP 300 200 120
OLED - 60 30
CRT 200 230 230
Source: Excerpted partly from the display technology roadmap published by the New Energy and Industrial Technology Development Organization (NEDO)[2]
reproduction. Samsung Electronics Co, Ltd., of Korea presented at the 2004 SID exhibition*4 an LCD panel featuring six-color*5 filters, which use the standard RGB plus cyan (C), magenta (M), and yellow (Y). The company demonstrated that the color reproduction range of this panel is as wide as 98% of NTSC[5].
(3) Hoped-for features of future displays In 2002, NHK displayed a prototype of the
“Super Hi -Vision”*6 system, which consists of both a camera and a display that support 4,000 scanning lines. Sony, on the other hand, introduced this year a projector - t ype LCD offering a vertical resolution of 2,160 lines (4096 horizontal pixels x 2160 vertical pixels, or 8.85 megapixels)[6].
A new imaging format requires not only the expansion of the color reproduction range through the use of more colors, but also the review of all related technologies including cameras, imaging devices, image processing methods, and displays. Meanwhile, despite long - time efforts to develop better display devices based on different technologies, none of the current display technologies meets all the requirements. Therefore, technological development needs to continue in pursuit of the reproduction of more realistic images. R&D for higher image quality to achieve ultimate imaging technology will remain the primary theme for researchers in years to come.
One of the drawbacks of display is the presence
of the “frame” around the screen, a factor that makes people aware that they are looking at an artificial image. To solve this, a technology that shows borderless pictures throughout the viewer’s visual angle, similar to a panoramic vision system, is discussed as a future direction of display technology [7]. Furthermore, some believe that large-screen displays will evolve to create a living environment, rather than just TVs.
For example, a large paper-thin display could be hung on the wall like a painting. It might even be used as an intelligent lighting system, if hung on the wall of a windowless room or the window of an urban apartment, which shows panoramic pictures of natural scener y with luminance that automatically changes as if it were natural light according to the intensity of sunlight. As a display, while providing input and output functions as an information terminal, it could become a part of the human living environment, helping people feel refreshed by showing them a background image’; this would be considered a true evolution of human interfaces.
3 The flat panel display industry
3-1 Change in the market share
Figure 4 shows the size of Japanese and overseas plasma display panel (PDP) markets and the combined share of Japanese companies in these markets.
Currently, there are only PDP manufacturers outside Japan in Korea, where Samsung SDI and Figure 3 : Two approaches to a wider color gamut
* For details on this graph (CIE-xy chromaticity diagram), see the appendix at the end of this article
LG Electronics account for the majority of the output.
Year 2001 marks the beginning of the plasma TV era, because multiple plasma TV models supporting HDTV were released that year. Since then, the market has been growing at an annual rate of over 100%. As the PDP market grew, however, Korean companies made a full-scale entry, resulting in a sharp decline in the market share of Japanese companies. This is also the case with the LCD market. Taiwanese and Korean companies becoming dominant in the worldwide market**1 is typical as the technology matures. However, some experts argue that Japanese manufacturers’ share of the PDP market will not easily be surpassed by their Korean counterparts because several Japanese PDP makers announced earlier this year their plans to invest in PDP production plants[8]. Nevertheless, from a long-term perspective, it is very likely that Japanese companies will face an uphill battle in competing with their Korean and Taiwanese
rivals who will market products of a similar quality at lower prices.
3-2 Restructuring status in the industry
Figure 5 shows the major alliances that have been recently formed, leading to the restructuring Figure 4 : Trends in PDP production and
Japanese companies’ market share
Source: Prepared by the author based on material published by the Japan Electronics and Information Technology Industries Association and DisplaySearch
Figure 5 : Partnerships among display manufacturers
Source: Prepared by adding data to material published by the Development Bank of Japan [9]
of the LCD and PDP industries. In the LCD industry, the restructuring process has advanced to a stage at which even Taiwanese and Chinese companies, in addition to Korean companies, are involved. In contrast, in the PDP industry, which has just emerged, Taiwanese and Chinese manu facturers have yet to make an entr y.
Corporate strategy varies by country. Korean companies can be characterized as primarily targeting the domestic market and having the capacity to perform technological R&D. On the other hand, Taiwanese companies do not engage in technological R&D and seek, as manufacturers specializing in displays, the lion’s share of the global market in mature products.
In the LCD manufacturing business, Japanese companies were once compelled to accept capital from Korean and Taiwanese rivals whose low-cost strategy proved successful. Here, there is debate about how to prevent “technology drain”
from Japan. However, it is a welcome move for consumers that, based on economic principles, companies are reorganizing and Taiwanese makers have begun using technologies that originated in Japan, making products that excel in price as well as quality available. The PDP industry will also see more technology licensing, investments, and alliances across the border, as its market grows and matures.
3-3 Comparison with the semiconductor industry
The once-dominant semiconductor, especially the DR A M*7- manufacturing sector in Japan rapidly lost its competitiveness in the latter half of the 1990s and was forced to reorganize and consolidate. Again, Korean and Taiwanese companies displaced Japan. Japan’s fast decline in the share of the LCD market is often compared with its similar experience in the DRAM industry.
The display panel is more similar to DRAM than CPU*8 among the sectors in the semiconductor i ndustr y. LSI tech nolog y is mu lti - layered, consisting of technologies for architecture, circuit design, manufacturing, and testing.
While CPUs do not allow each technology layer to be distributed independently, DRAMs do. In the DRAM market, each layer of technology is
supplied by vendors specializing in that specific area. In addition, it is impossible to differentiate produc t s by per for m a nce becau se DR A M standards are expressly defined and certified by CPU manufacturers.
In the case of display panels, wh i le the interface is determined by standards, product performance varies slightly because they are analog products. Nevertheless, because displays are manufactured based on materials and devices supplied by specialized vendors, there should be no significant difference in performance among the final products.
Since Japan has led the world in R&D in display technology, its patent position in this field is different from that in DRAM, for which Japan had to play catch-up with technology leaders.
The display market is also dissimilar in its growth trends from the DRAM market, which leveled off in value terms by 1995. If differentiation by performance is not feasible, manufacturers will eventually move toward price competition. When price becomes an issue, Japanese manufacturers will have to fight an uphill battle against their Korean and Taiwanese rivals. This process is not affected by changes in market size or the country’s technological position, and the challenge that Japanese companies face in seeking commercial b e n e f i t f r o m s u c c e s s f u l t e c h n o l o g i c a l development will remain.
Recently, there has been an increasing number of patent lawsuits filed by Japanese companies against Korean and Taiwanese companies. The Customs Tariff Law[10], which was amended last year, appears to benefit Japanese companies in that it allows them to seek legal measures at an earlier stage, such as bans on imports of the product in question. While claiming the rights granted is the right course of action, victory in patent disputes will not improve the situation in which Japanese companies face a continuing struggle in the display manufacturing business.
I f compan ies compete on ly i n the display manufacturing sector, which is horizontally divided, the industry leader will probably keep changing on a short-term basis as in the DRAM industry.
4 The State of R&D
4-1 The number of presentations at academic conferences
Figure 6 shows the trend in the number of presentations on PDP technology at recent SID conferences by country and region. In the first half of the 1990s, when Fujitsu Limited and other companies released plasma TVs, followed by the development of larger-screen models, Japan gave the largest number of presentations, with little contribution from elsewhere. However, the number of presentations from Korea sharply increased between 1996 and 1998, exceeding that of Japan in 1998, and has remained the largest for the remainder of the selected period.
According to Reference[11], which reports the detailed analysis results of the number of presentations by institution, the majority of Korean presentations have been made by universities, the business sector**2 providing meager input. This analysis also reveals that the ratio of presentations jointly delivered by businesses and universities to the total business presentations is high in Korea: 83% for LG Electronics and 42% for Samsung SDI, compared with an average 24% among the top presenting companies in Japan.
4-2 National projects in Japan
Table 5 lists major national projects ongoing in Japan with respect to display technology.
They pursue, for example, display devices with lower power consumption and energy-efficient
manufacturing processes for displays. With the exception of the project on the construction of facilities for joint research, all of the projects in Table 5 are small-scale, operating with an annual budget of less than ¥1 billion. In addition, all of them have been launched recently; this means that there were no display- related national projects in Japan previously. Therefore, it will be some time before these projects produce results.
In the field of display technology development, where no single technology is anticipated to be mainstream, it is difficult to forecast what will happen next. To complicate matters, researchers in LCD technology, considered by most to be a mature technology, still face many challenges, including not only improving characteristics through higher-efficiency light sources, a wider viewing angle, and faster response, but also advancing manufacturing technology. Given this nature of display technology development, small, distributed projects seem more appropriate in this area than large - scale comprehensive projects, which are common in semiconductor technology development. In any case, national display technology projects should provide long-term support for research themes that are too challenging for private- sector institutions and scientists. Current national projects are conducted close to this ideal, except that they tend to demand outcome too soon.
4-3 The situation in the U.S.
At one time, U.S. companies, namely, RCA and Zenith, dominated the market with color CRT TVs equipped with a technology called the shadow Figure 6 : Trends in the number of presentations on PDPs at SID conferences by country/region
Source: Japan Patent Office, Report on the Technological Trends in Industrial Property Rights Applications [11]
mask. In the 1970s, however, Japanese CRTs that excelled in both quality and cost emerged to rapidly weaken the competitiveness of U.S. CRT manufacturers. Until today, there has been no remarkable display-related industry in the U.S.
This does not necessarily mean that the U.S. has failed to take measures; for instance, alarmed by the Japan-led progress of flat panel display technology, the U.S. government and the private sector jointly established the United States Display Consortium ( USDC)[12] in 1993. The USDC, with over 100 member companies, devoted its energies to developing the LCD and FED*9 display technologies, which were then considered likely to be next-generation display devices for military and medical purposes. In reality, however, none of the USDC efforts have yielded remarkable results, with Japanese companies dominating in R&D on LCD technology and FED panels that are nowhere near commercialization. In another attempt to gain strength in the display industry, the U.S. Army and others are reportedly planning to set up a consortium[13] in imitation of SEMATECH*10. Yet another initiative is to establish a scientific society dedicated to the application of displays[14] to explore new technologies.
However, the effectiveness of these activities
is uncertain, given that the U.S. lacks a major technology leader in this field and that there is little reason for the business sector to invest in new display technology, said to take at least five years to develop.
The U.S. has no presence i n the display industr y. By contrast, Korea has a growing presence worldwide, than ks to successf u l collaboration among industr y, government, and academia. In Korea, the display industry, positioned by the government as a future key industry, is an area where the business sector is eager to hire a large amount of personnel and to make sizable investments. Furthermore, universities are active in supplying human resources and research results.
5 How to maintain
technological competitiveness
As described in the previous chapter, Japan’s national research projects to develop display panel manu facturing technolog y generally matches the nature of this development field.
However, in the same field, Korea began their efforts much earlier to intensify R&D as a national strategy. This increases the need for Japan to Table 5 : Major national projects for the development of next-generation display technology
Years Project Budget
(in ¥100 millions) Developing technologies Remarks
'03-05 Next-Generation
Energy-Saving PDP 7.7
High-efficiency light emission mechanisms, phosphors for a higher luminous efficiency, energy-efficient manufacturing process '02-06 High-Efficiency Organic
Devices 7.8
Constituent technologies including high-efficiency light-emitting devices and materials, large-area formation technology, organic transistors
'03-05 Polymer Organic EL Materials 4.7 Technology to form, refine, and mass-produce new conjugated polymer organic EL materials
'03-05 High-Strength Nano Glass for
Displays 2.3
Technology to strengthen substrates by forming heterogeneous phases in glass; Technology for the short-time processing of large substrates
'03-05 Carbon Nanotube (CNT) FED 7.4 Technology to produce homogeneous CNT film and micro emitters
'03-05
Construction of Facilities for Joint Research on Next-Generation Low-Power Display Manufacturing Technology
153 for 3 years Technology to manufacture low-cost, low-power large LCD panels
FY 2001 supplementary budget
'01-04 Liquid Crystal Device Process
for the Rational Use of Energy 5.1
50% reduction of power consumption in the manufacturing process of low-temperature polysilicon TFTs
Grants-in-aid for R&D
*The budgets without remarks refer to the annual budget for FY 2003
explore technologies in areas other than panel manufacturing.
A pos sible st r ateg y i s to sh i f t foc u s to developing high value - added technologies, as U.S. companies did when they were caught up with by their Japanese counterparts in DRAM manufacturing technology. The strategy of these U.S. chip makers, in specializing in CPU and DSP*11 development, has proven successful, and they currently dominate a market that is very difficult to enter.
A s fa r a s t he f ields i n wh ich Japa n ha s accumulated industr y - leading technologies are concerned, the country can utilize such technologies for a transition to display systems that are more advanced. However, the expansion of the color gamut through the use of more basic colors, for example, cannot be realized merely by improving the performance of display devices, because the current color technology is built on the basis of RGB combination. To allow for the use of more than three colors, all technologies for image signal input and output, including display devices, cameras, imaging devices, and image processing function, must be revised. A wider range of color reproduction can even raise the need for higher resolution, possibly leading to the proposal of a next- generation imaging format. These are goals that encompass such a broad range of R&D activity and such high risk that a single firm cannot handle. This is exactly the case where government should provide support. In a development project involving such diverse research themes and so many businesses, the government should act as a coordinator of development efforts across the participating companies, while providing R&D funds.
C o n s i d e r i n g t h e r e c e n t n u m b e r s o f presentations at academic conferences, it is highly likely that Korea will eventually overtake Japan as the industry leader in another display panel manufacturing arena: PDP. Japan could counter this possible move by utilizing its existing technological position to develop higher value - added technologies, such as a next- generation high - performance imaging system and a broadcast format after HDTV.
A not he r po s sible me a s u r e i s to l au nch long-term initiatives to develop future display
tech nolo g ie s s uch a s t he one appl ic able to a display that can create a com for table env i ron ment, a s mentioned at the end of Chapter 2. Displays will become part of the infrastructure that supports a maturing society.
They are expected to evolve to an intelligent system that can cater to national, local, or even personal preferences. With respect to consumers, Americans usually watch TV in relatively low light, while Japanese often watch TV in bright light and therefore prefer crisp pictures. Japan’s strength lies in the combination of these Japanese consu mers, who are h ig h ly demandi ng i n terms of image quality, and display and imaging systems, including peripheral devices, in which Japan has accumulated knowledge. Japanese display researchers should take advantage of this national strength to develop high value-added technology for the next generation.
6 Conclusions
As terrestrial digital broadcasting starts, CRT T Vs are about to be displaced by T Vs with higher resolution and larger screen size. In an effort to seize this huge business opportunity, m a n u f a c t u r e r s h a v e d e v e l o p e d v a r i o u s next- generation display technologies such as liquid-crystal (LCD), plasma (PDP), and organic EL (OLED) displays, to name only a few flat panel types, and are now introducing them onto the market.
T he s e t e c h nolo g i e s , a lt hou g h i n it i a l l y considered not applicable to consumer TVs, have been improved by Japanese manufacturers, who have overcome technical hurdles over the years. Among them, LCD and PDP technologies have already become the two major camps that split the large - screen TV market. Thus, Japan has led the world in display panel technology development.
D e spite t he i r s u cce s s i n tech nolo g ic a l development, Japanese companies have fared rather poorly in business. They have seen Korean and Taiwanese competitors rapidly catching up with them ever since the launch of the LCD and PDP markets. Furthermore, in recent years, research in Korean universities is advancing at a pace that threatens Japan’s position in the area of
R&D.
S i n c e t h e p r e s e n t d i s p l a y i n d u s t r y i s primarily based on horizontal labor division, manufactures are placing growing emphasis on manufacturing costs to gain a competitive edge.
Under such circumstances, Japan should, rather than vying with Korea and Taiwan only in the panel manufacturing arena, widen its scope of development and pursue next- generation high - performance display technologies with high added value and systems that exploit such technologies.
Displays are expected to advance toward the ability to produce images closer to real things. For example, to achieve a wider color reproduction range, display researchers will probably need to revise not only display devices but all technologies for image signal input and output, including cameras, image pickup devices, and image processing function. Higher color reproducibility could even spur the demand for higher definition. These challenges, which are too extensive for a single company to handle, should be tackled in a large framework that involves a large number of companies. In a development project that covers such diverse research themes, the government should act as a coordinator of development efforts across the participating companies, while providing R&D funds.
Japan’s strength lies in the combination of its comprehensive capabilities in display technology and imaging systems, including peripheral technologies, where Japan has accumulated knowledge, and Japanese consumers who are highly demanding in terms of image quality.
Japan should take advantage of this national strength to develop high value-added technology for the next generation.
Acknowledgements
I would like to express my deepest gratitude to the following people for their invaluable opi n ions and advice on th is ar ticle: Prof.
Yoshifumi Shimodaira, Department of Electrical a n d E l e c t r o n i c s E n g i n e e r i n g , S h i z u o k a University; Prof. Shigeo Mikoshiba, Department of Electronic Engineering, the University of Electro - Communications; Prof. Heiju Uchiike,
Depa r tment of E lectr ica l a nd E lectron ics Engineer ing, Saga Universit y; Prof. Tatsuo Uchida Graduate School of Engineering, Tohoku University; and Mr. Yukichi Deguchi, General Manager of the PDP Technical Department, Toray Industries Inc.
Glossary
*1 lm/W
The unit of luminous efficiency calculated by dividing the amount of light expressed in lumens (l m) by the power consumption of the light source, which is expressed in watts (W).
*2 NTSC
Abbreviation for the National Television Standards Committee. It refers to either the U.S. organization that has set the standard for analog terrestrial color TV broadcasting, or the standard itself. NTSC TVs have 525 horizontal scanning lines (of which 480 are active) and use interlaced scanning at 30 frames per second.
*3 Adobe RGB
The color spectr u m standard adopted by Adobe Systems Inc. of the U.S. for its
“Photoshop” image editor. It supports a range wider than the sRGB standard (see below). Adobe RGB is widely recognized as the de facto standard in the printing and publishing industry.
sRGB (standard RGB)
The international standard for color space defined by the International Electrotechnical C o m m i s s i o n ( I E C ) . M a n y c o m p u t e r peripheral devices such as digital cameras, printers, and monitors adjust colors based on sRGB to minimize color difference between input and output.
*4 SID
Abbreviation for the Society for Information Display. Based in the U.S., it is the largest academic society in the field of display technology.
*5 Use of six colors
Even though magenta is not monochromatic (saturated color), such non-saturated colors are sometimes added to increase the number of basic colors.
*6 Super Hi-Vision
A imaging format with 7680 x 4320 pixels (16 times more than HDTV ) and 60 - Hz frame rate progressive scanning.
*7 DRAM
Abbreviation for Dynamic Random Access Memory, a type of semiconductor memory chip. Being freely readable/writable and allowing relatively high density, DRAMs are primarily used for the main memory of computers.
*8 CPU
Abbreviation for Central Processing Unit.
This is a device that executes programs stored in the memory of a computer. It receives data from input and storage devices, computes and processes this data, and outputs the results to output and storage devices.
*9 FED
Abbreviation for Field Emission Display. FED is a display that glows by releasing electrons from nu merous hor izontal ly - ar r anged electron emitters into a vacuum where electrons collide with phosphors. FED technology is similar to CRT in the principle of light emission, but is dissimilar in having no def lection s ystem for electrons, a property that allows for a thinner panel.
*10 SEMATECH
A b b r e v i a t i o n f o r S E m i c o n d u c t o r M A nu factur i ng TECHnolog y. This is a consor tiu m joi ntly establ ished by the U.S. Depa r tment of Defense a nd fou r private-sector semiconductor manufacturers f o r R & D i n t h e s e m i c o n d u c t o r manufacturing technology, to reinvigorate t h e c o m p e t i t i v e n e s s o f t h e U . S . semiconductor industry, which was on the decline in the mid-1980s.
*11 DSP
DSP is an abbreviation meaning Digital Signal Processor. This processor is designed for processing specific signals such as audio and image signals and is often embedded in devices such as a modem, or in a PC to offload some of the processing tasks from the CPU.
Notes
**1 Market share of matured products
Of the CRT and 19 - inch or smaller LCD panels available on today’s market, roughly 60 % are made i n Taiwan and 30 % are produced in Korea.
**2 Number of presentations by institution The top institutions in the number of presentations in Japan are four business enterprises, three universities, and one public research institute, whereas those in Korea consist of one business enterprise and seven universities, suggesting the overwhelming leadership of universities in development activities.
References
[1] (e.g.) Shin Hasegawa, “Image Engineering”, the Un iver sit y Ser ies of the I nstit ute o f E l e c t r o n i c s , I n f o r m a t i o n a n d C o m m u n i c a t i o n E n g i n e e r s , C o r o n a Publishing Co., Ltd. (in Japanese)
[2] The display technology roadmap on the website of the New Energy and Industrial Technology Development Organization (NEDO):
http://www.nedo.go.jp/nanoshitsu/project/l oadmap.pdf
[3] SID Japan Chapter Newsletter No. 23 (May 17, 2003):
http://www.sidchapters.org/japan/letter/SI D-NL23.pdf
[4] (e.g.) Press releases by Mitsubishi Electric Corporation:
http://www.mitsubishielectric.co.jp/news/2 004/0322-a.htm
http://www.mitsubishielectric.co.jp/news-d ata/2004/pdf/0322-a.pdf
[5] An article released by Nikkei Business Publications, Inc.:
http://ne.nikkeibp.co.jp/members/NEWS/20 040526/103584/
[6] A press release by Sony Corporation:
http://www.sony.co.jp/SonyInfo/News/Pres s/200406/04-0604/
[7] EDF 2004 display tutorial lecture collection [8] (e.g.) A press release by Matsushita Electric
Industrial Co., Ltd.:
http://www.matsushita.co.jp/corp/news/off icial.data/data.dir/jn040518 -2/jn040518 -2.ht ml
[9] Development Bank of Japan’s website:
http://www.dbj.go.jp/beginners/why_dbj/ab out/files/
[10] http://www.mof.go.jp/jouhou/kanzei/ka160 415a.htm
[11] Jap a n P at e nt O f f ice, “Re p or t o n t he Technological Trends in Industrial Property Right Applications”:
http://www.jpo.go.jp/shiryou/index.htm [12] USDC’s website:
http://www.usdc.org/index.html#
[13] J a p a n E l e c t r o n i c s a n d I n f o r m a t i o n Te c h n ol o g y I n d u s t r i e s A s s o c i a t i o n’s survey and research report: “2003 Update on the U.S.: Trends and Development i n I n f o r m a t i o n P o l i c i e s t o P r o m o t e IT/Digitization and the Current State and Policy Issues on Internet/E-Commerce Rules Development”:
http://it.jeita.or.jp/infosys/report/2003- 04us report/chapter3.pdf
[14] SID’s website: http://www.sid.org/conf/adea c04/adeac04.html
<Appendix>
i) Imaging formats
Table 6 lists the major imaging formats mentioned in the article.
ii) Color gamut diagram (CIE XY chromaticity diagram)
International color standards are managed by t he I nte r n at ion a l C om m i s s ion on Illumination (CIE from its French name
“Commission Internationale de l’Eclairage”).
In 1931, the CIE created a standard for color specification. As the three primary colors, it defined red (R), whose light has the largest wavelength perceivable by the human eye, at 700 nm, and green (G) and blue (B) at 546.1 nm and 435.8 nm respectively, which correspond to the mercury lamp’s emission line spectrums. This CIE system allows colors to be represented by coordinates on a diagram, based on the mixing ratio of the three primary colors.
T h e C I E 19 31 R G B s y s t e m d e f i n e s chromaticity by this method. This system expresses any color as a point in 3D space.
The CIE X Y chromaticity diagram was derived by converting this RGB 3D color space including the entire color gamut into an easy-to -handle XYZ space in a manner that all parameters remain positive, and normalizing and projecting the results onto a 2D space.
T he C I E X Y ch r om at ic it y d i a g r a m i s cu r rent ly used for t he most com mon and precise color reproduction. In this diagram, spectral (monochromatic) lights Table 6 : Major imaging formats
Resolution Pixels
(in 10,000) Aspect Ratio
Application Format Name Horizontal Vertical
PC
VGA (Video Graphics Array) ; Basic 640 480 31 4:3
SVGA (Super-VGA) 800 600 48 4:3
XGA (eXtended-VGA) 1024 768 79 4:3
SXGA (Super-XGA) 1280 1024 131 4:3
SXGA+ (SXGA at 4:3 aspect ratio) 1400 1050 147 5:4
UXGA (Ultra-XGA) 1600 1200 192 4:3
QXGA (Quadruplet-XGA: quadrupled XGA) 2048 1536 315 4:3
QSXGA (Quadruplet-SXGA: quadrupled DXGA) 2560 2048 524 5:4
QUXGA (Quadruplet-UXGA: quadrupled UXGA) 3200 2400 768 4:3
TV
480i (interlaced) / 480p (progressive) 720 480 35 3:2
720ps 1280 720 92 16:9
1080i (HDTV) 1920 1080 207 16:9
1080p 1920 1080 207 16:9
are distributed along the outline of the f igure (visible region), and the f igure includes all colors that can be produced by mixing monochromatic lights. Color purity (saturation) increases toward the center of the figure. The colors reproducible through the additive mixing of given basic colors are limited to those within a polygon joining
the coordinates for the basis colors on the CIE XY chromaticity diagram. In general, monochromatic lights are not reproducible by additive mixing. The CIE XY chromaticity diagram implies that vivid green and the complementary colors of RGB-namely, cyan, magenta, and yellow-are not reproducible through the additive mixing of RGB.
Figure 7 : CIE-xy chromaticity diagram
(Original Japanese version: published in August 2004)