A Study on a Development Methodology for Real-time Urban Water Monitoring System
by
Seong Hoon KIM*, Wataru NISHIDA**, Jaekuk PARK*** and Byungdug JUN****
The purposes of this study are to raise the awareness of urban water not being efficiently managed and to propose a method for resolving this issue. To serve these purposes, a methodology was proposed to obtain sensing data in a real-time monitoring method and to build them into an IT system. Some sample data among sensing data were used to perform a series of trend analyses using a polynomial model. In addition, a method for the continued management of urban water monitoring systems was proposed based on the real-time monitoring data collected from sensors. As a result of the aforementioned research, a monitoring technique is needed in order to improve the reliability of urban water.
Key words : Urban Water, Monitoring System, Real-time
1. Introduction
Urban water denotes the water required for life, work, and production activities in cities, and includes drinking water, sewage, heavy water, and recycled water. Demand for urban water had continued to increase in Korea; however, mostly in large cities, the increase in demand for water has recently become stagnant or slowed down compared to the past. Based on the annual statistics on drinking water of the Ministry of Environment, water consumption per capita has decreased since 1997 (Jong-won Kim, 2003).
Thus, the need for an increase in the water supply, if needed, or the improvement of current reliability of water circulation has arisen. A circulation improvement system based on the water requirement and the amount of supply loss should be built and operated first in order to increase the water supply or to improve the current reliability
of water circulation. Under current circumstances, it is difficult to predict variations in water supply due to the poor awareness of possible water shortages and abnormal weather conditions caused by global warming in the face of a predicted deepening shortage of urban water. Since systematic monitoring and maintenance systems for urban water are not built properly as described above, urban water cannot be managed efficiently.
As part of efforts for resolving the previously mentioned issues, a real-time monitoring technique for urban water is introduced in this study. The proposed methodology enables the collection of data on the status of the amount of water supplied at educational, industrial, commercial, and residential facilities. This includes monitoring the amount of urban drinking water supplied and sewage outflow by using flow sensors and the construction of the collected data into an IT system.
平成23年 6月14日受理
* Associate Professor, Department of GIS Engineering, Namseoul University, Korea
** Associate Professor, Graduate School of Engineering, Nagasaki University, Japan
*** Associate Professor, Department of GIS Engineering, Namseoul University, Korea
**** Professor, Faculty of Education, Nagasaki University, Japan
This methodology also proposes a method for the management of urban water monitoring systems by analyzing real-time sensing data collected from each flow sensor.
2. Research Trends Analysis
In Korea, research about urban water has been already performed in several cases. However, most of them are about monitoring systems for drinking water.
Jin-taek Kim, et al. (2005) attempted to ensure the best maintenance of facilities and the usability of water operators. This attempt was done as follows: A water level monitoring system was developed using a water level measurement sensor to monitor reservoirs for agriculture, the functions (e.g., checking measurement status and data search) of the monitoring system were enabled, and the system was built.
Jeong-hun Kim, et al. (2008) analyzed tasks related to waterworks, and selected waterworks monitoring categories with a higher priority of development from sensing techniques in order to analyze the priority of developing waterworks monitoring technology.
Jin-seok Jeong, et al. (2009) performed experiments regarding the recognition of water leakage by using sensor data and an ontology technique for monitoring water leakage that occurs frequently in drinking water systems.
Based on the analyses of research cases, it turned out that research for methods that enabled the monitoring of urban water based on data on flux or pressure collected from sensors from urban water point of view where drinking water is integrated with sewage had been insufficient.
Since policies cannot be established, nor budgets estimated or executed in terms of water circulation without including the entire range of water use, approaches to entire urban water system are important.
3. Research Scope
3.1 Range of Research Details
As shown in Fig. 1, water circulation is
categorized into natural and artificial systems.
The artificial system includes several types of topics for research; however, only urban water is the object of this study. From informationization point of view, research on urban water can be categorized into monitoring and analysis sections.
In this study, a technique and a method for ubiquitous monitoring are presented.
3.2 Objects of Monitoring
There are diverse main monitoring items for the supply and management of urban water.
This study conceives of a method for improving the utilization of water focused on flux. As shown in Fig. 2, the influx of drinking water and sewage outflow in target areas and the amount of water supplied to the concerned theme areas were examined
Fig. 1 Classification Diagram for Water Circulation (Current View of Research).
Fig. 2 Objects of Monitoring.
by using samples and used for analysis.
In order to locate a sensor, the inflow point of drinking water is selected, and then a sewage outflow point is selected. In addition, four additional places are selected representing each of educational, residential, commercial, and industrial facilities. Sensors enabling the observation of flux are installed in the six areas and data are sent to the server via a data logger.
In this case, the number of areas where sensors are installed is subject to change depending on the paths of water inflow and outflow in the target areas.
3.3 Spatial Range
As the target area of this study, an area containing Gwanpyeongcheon Stream in Yuseong-gu, Daejeon-si, Korea was selected as shown in Fig. 3.
This area is a complex city where offices are located near residential facilities. Inside of the complex, a small stream called Gwanpyeongcheon Stream, which is the primary tributary of Gapcheon Stream, flows. The area of the stream basin is 10.85km2, and the extension of the flow path is 5.45km. The area around the middle of Gwanpyeongcheon Stream consists of farmlands, while the areas downstream consist of residential and industrial complexes. Thus, urban areas are naturally harmonized with agricultural areas in the
basin. It is concluded, therefore, that this area fully deserves to be the research target area.
3.4 Research Methodology
The urban water monitoring system is implemented by following the steps shown in Fig. 4.
Urban water includes diverse water resources such as drinking water, sewage, heavy water, filthy water, and recycled water. For this study, monitoring targets and ranges are set by reviewing previous research cases and the results of previous monitoring.
In addition, items with importance or higher needs for analysis are selected from monitoring categories for the efficient management of urban water. Schemes for building a monitoring system is established. Then, the needed acticities for the application of core technologies and database building are fulfilled to finally develop an urban water monitoring system.
In order for the efficient management and diverse analyses of the monitored data, Geographic Fig. 3 Research Target Area.
Fig. 4 Flowchart of Developing an Urban Water Monitoring System.
Information System (GIS) is introduced.
4. Implementation of an Urban Water Monitoring System
4.1 Trend Analysis through Monitoring
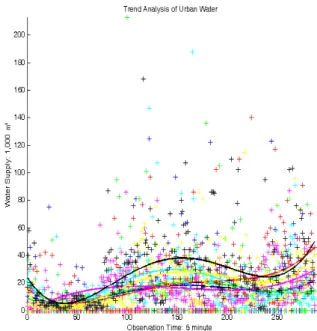
Fig. 5 shows data on the amount of drinking water supplied in the target area for seven days from September 29, 2009 to October 5, 2009. The data were collected from the flow sensors.
In the research target area, in addition to the flow sensors, sensors collecting pollution data were installed. In this study, data on the amount of water supplied were obtained from the flow sensors every five minutes. The horizontal axis shows time ranging from midnight to 11:55 PM, and the vertical axis shows the amount of drinking water supplied in tons (m3).
During a day, there are times when the amount of drinking water used is high and times when the amount of drinking water used is low. As a result of data analysis, the amount of water supplied shows a regular pattern of decreases and increases during a day.
In this study, a pattern of the amount of drinking water supplied for one day or a few days was
determined using a polynomial model as a part of the trend analysis method as shown in Fig. 6. If water leakage occurs in the target area due to an issue such as pipeline fatigue, data deviated from the trend line above will be transferred to the management server. By performing the steps of this kind of recognition, warning, and countermeasures through the real-time monitoring, the value in use of the urban water monitoring system will be increased.
4.2 Strategies for Continued Improvement
Fig. 7 shows a method for the continued growth of the urban water monitoring systems. Schemes for the improvement of the system can be established based on the real-time monitoring data obtained from sensors.
Traditional drinking or urban water management systems were not built to be enhanced. Thus, in order to develop the current urban water monitoring system into a systematic and sustainable one, schemes for the continued improvement of the system and methods for their assessment should be established based on actual field data including real-time monitoring data. Then, the schemes and methods should continue to be improved.
Fig. 5 Sensing Data on the Amount of Drinking Water Supplied.
Fig. 6 Trend Analysis using a Polynomial Model.
5. Conclusions
In this study, a methodology for the establishment of an urban water monitoring system was proposed to increase efficiency in urban water management. Based on the methodology, research regarding real-time sensing data on the amount of drinking water supplied was performed to enable functions with high usability. It also proposes a model for the continued improvement of the urban water monitoring system.
In order to improve the features of the system diverse analyses need to be performed when several additional items are accumulated in time-series. In addition to the research on the real-time data on the amount of drinking water supplied presented in this study, research about sewage outflow and each theme should be performed as well.
References
1) Jong-won Kim : Status of the supply of urban water and future countermeasures, J. of the Public Officials Benefit Association, August Issue, pp.28-40, 2003.
2) Jin-taek Kim, Gi-wuk Park, and Wuk-jong Ju : Monitoring system for agricultural reservoirs using automated water level monitoring guage, J. of the Korean National Society on Irrigation and Drainage, Vol. 12-1, pp.60-68, 2005.
3) Jeong-hun Kim, Mi-suk Lee, and Jae-il Hahn : A study of assessing the priority of the development of drinking water monitoring technology for the management of intelligent underground facilities, J. of Geographic Information Association of Korea, Vol. 16-2, pp.263- 278, 2008.
4) Jin-seok Jeong, Yong-ju Lee, In-seon Byeon, Tae-hun Kim, and Yong-hak Song : A study of scenarios for situation recognition in an ubiquitous environment – focused on the cases of waterworks -, J. of the Korean Society for GeoSpatial Information System, Vol. 17-2, pp.47-53, 2009.
Fig. 7 Method for the Continued Improvement of the Urban Water Monitoring System.