• 検索結果がありません。

Improvement of the solubility and intestinal absorption of curcumin by N-acyl taurates and cyclodextrins

N/A
N/A
Protected

Academic year: 2021

シェア "Improvement of the solubility and intestinal absorption of curcumin by N-acyl taurates and cyclodextrins"

Copied!
78
0
0

読み込み中.... (全文を見る)

全文

(1)

Improvement of the solubility and intestinal absorption of curcumin by N-acyl taurates and cyclodextrins

Ph.D. Dissertation

Xinpeng Li

Department of Biopharmaceutics Kyoto Pharmaceutical University

Kyoto

2017

(2)
(3)

i

Table of Contents

Abstract ... vii

Introduction ... 1

Chapter I Improvement of the solubility and intestinal absorption of curcumin by N-acyl taurates ... 5

1.1 Materials and methods ... 6

1.1.1 Materials ... 6

1.1.2 Solubility of CUR in 1% NAT formulations ... 7

1.1.3 Intestinal absorption study of CUR with NATs ... 7

1.1.4 Intestinal membrane toxicity after administration of NATs ... 8

1.1.5 Cellular transport of CF and CUR with NATs ... 9

1.1.6 Determination of CUR by HPLC ... 11

1.1.7 Statistical Analyses ... 11

1.2 Results and discussion ... 12

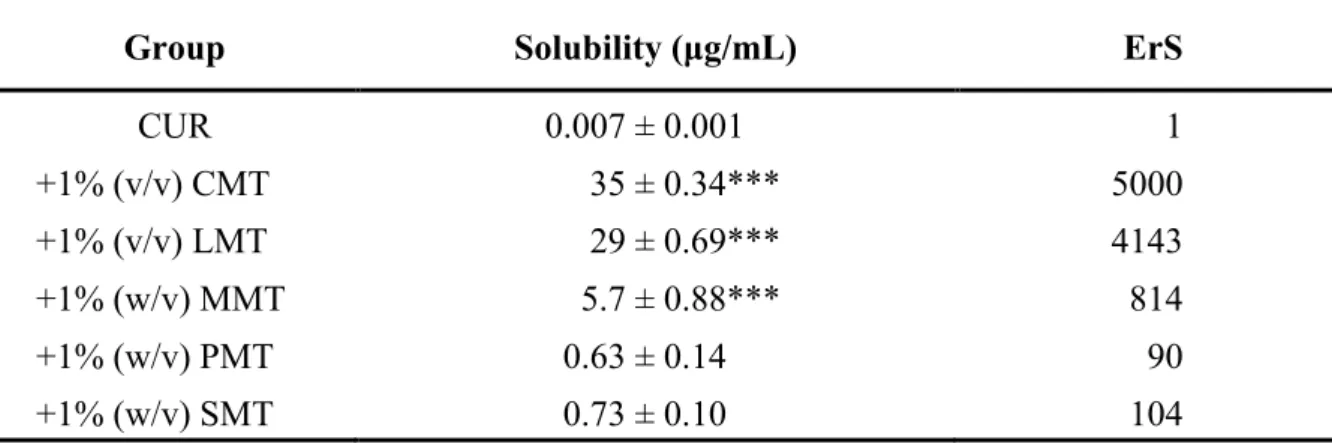
1.2.1 Solubility of CUR improved by NATs ... 12

1.2.2 Intestinal absorption of CUR in the presence of NATs ... 13

1.2.3 Intestinal membrane toxicity in the presence of NATs ... 17

1.2.4 Effects of NATs on the permeation of poorly absorbable drugs across Caco-2 cell monolayers ... 18

1.3 Conclusions ... 22

Chapter II Improvement of the solubility and intestinal absorption of curcumin by cyclodextrins ... 23

2.1 Materials and methods ... 24

2.1.1 Materials ... 24

2.1.2 Preparation of CUR suspension in CD formulations ... 25

2.1.3 Intestinal absorption of drugs in the presence of CDs ... 26

(4)

ii

2.1.4 Toxicity study of CDs ... 26

2.1.5 Cellular transport of CF and CUR in the presence of α-CD ... 27

2.1.6 Western blotting analysis ... 28

2.1.7 Evaluation of intestinal membrane fluidity in the presence of α-CD ... 29

2.1.8 Statistical analyses ... 30

2.2 Results and discussion ... 31

2.2.1 Phase solubility study of CUR in CD formulations ... 31

2.2.2 Intestinal absorption of CUR in the presence of CDs ... 34

2.2.3 Intestinal absorption of hydrophilic molecules in 50 mM α-CD solution ... 38

2.2.4 Toxicity of CDs after intestinal administration ... 41

2.2.5 Effects of α-CD on the permeation of poorly absorbable compounds across Caco-2 cell monolayers. ... 44

2.2.6 Expression of claudin-4 in the presence of 50 mM α-CD ... 47

2.2.7 Effects of α-CD on the membrane fluidity ... 48

2.3 Conclusions ... 51

Summary ... 52

Acknowledgement ... 55

References ... 56

Publications and presentations ... 66

(5)

iii

Table of Tables

Table 1 Characteristics of CUR ... 4 Table 2 Solubility of CUR in the presence of 1% NATs ... 13 Table 3 Pharmacokinetic parameters of CUR in the presence of 1% NATs after intestinal administration to rats ... 15 Table 4 Estimation of bioavailability and absorption rate of CUR using a deconvolution method ... 16 Table 5 Solubility of CUR in the presence of CD solutions ... 32 Table 6 Pharmacokinetic parameters of CUR in the presence of CDs after intestinal

administration to rats ... 37

(6)

iv

Table of Figures

Fig. 1. Chemical structure of N-acyl taurates ... 6

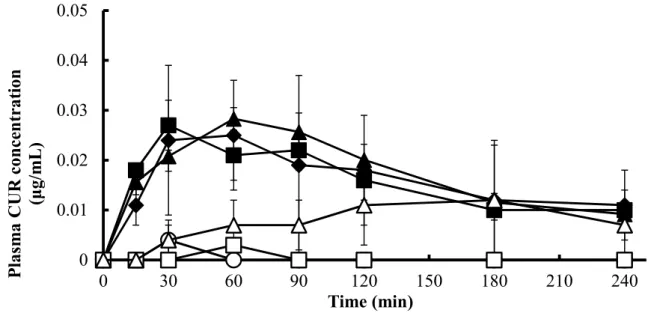
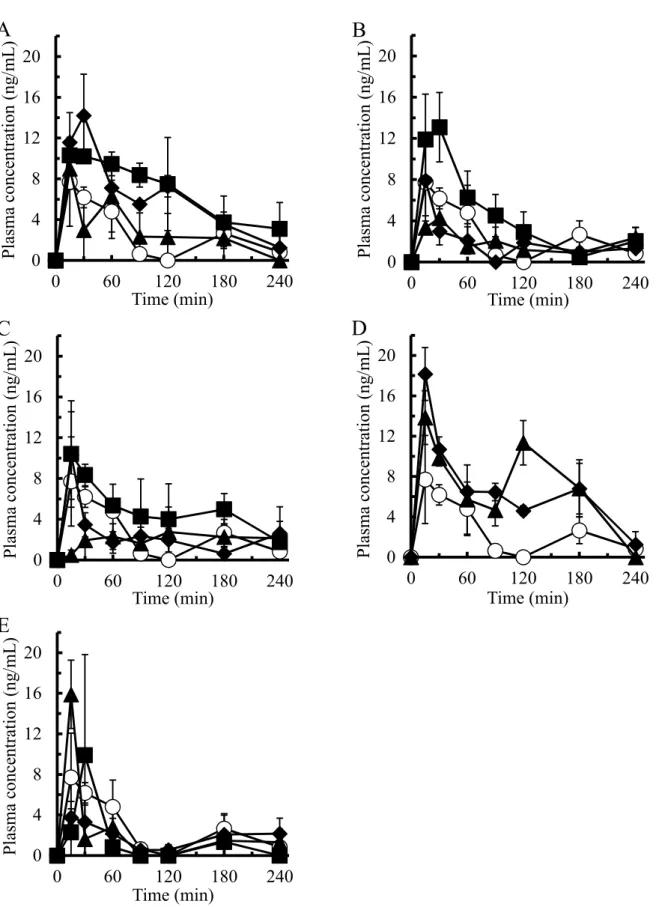
Fig. 2. Absorption of CUR (200 mg/kg) from rat small intestines in the presence of 1% NATs ... 15

Fig. 3. The relationship between the solubility and intestinal absorption of CUR in the presence of 1% NATs ... 16

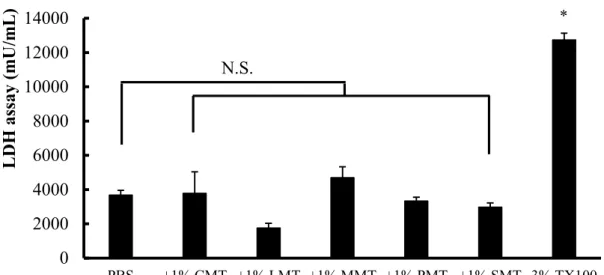
Fig. 4. The activity of LDH released from the intestinal membrane in the presence of 1% NATs ... 18

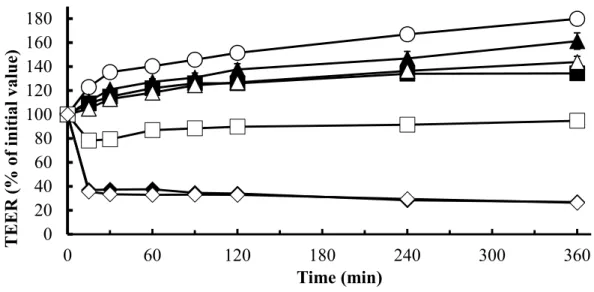
Fig. 5. TEER changes of Caco-2 cell monolayers in the presence of CMT and LMT ... 19

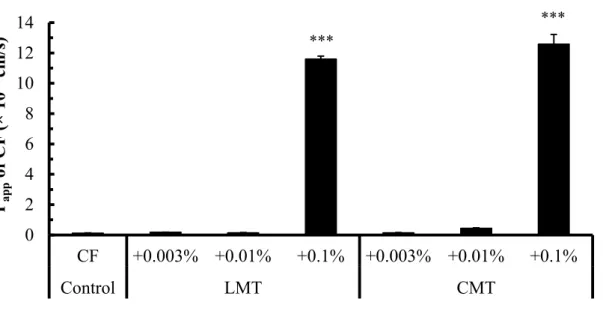
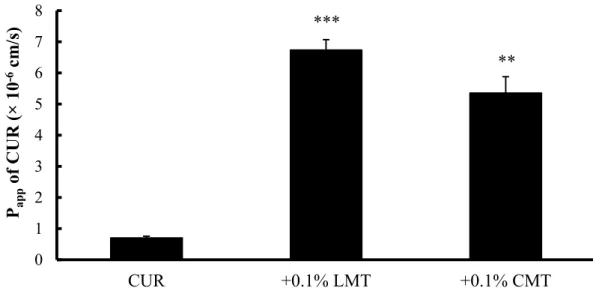
Fig. 6. Cellular transport of CF in the presence of either CMT or LMT ... 20

Fig. 7. Cellular transport of CUR in the presence of either CMT or LMT ... 22

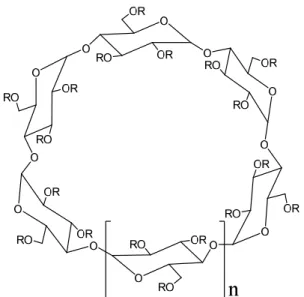
Fig. 8. Chemical structure of cyclodextrins ... 24

Fig. 9. Phase-solubility diagrams of CUR-CD suspensions... 33

Fig. 10. Absorption of CUR (200 mg/kg) from rat small intestines in the presence of CD solutions ... 36

Fig. 11. The relationship between the solubility and intestinal absorption of CUR in the presence of CDs ... 38

Fig. 12. Effects of 50 mM α-CD on the intestinal absorption of hydrophilic molecules ... 40

Fig. 13. Measurements of LDH and proteins released from the intestinal membrane in the presence of CDs ... 42

Fig. 14. Histological micrographs of rat small intestinal tissue treated with 50 mM α-CD .... 43

Fig. 15. Hepatotoxicity and nephrotoxicity of 50 mM α-CD after intestinal administration ... 44

Fig. 16. Cellular transport of CF and CUR in the presence of α-CD ... 46

Fig. 17. Reduction and recovery of claudin-4 expression after the treatment with 50 mM α-CD ... 48

Fig. 18. Fluorescence anisotropy of DPH, tma-DPH, and DNS-Cl in the presence of α-CD .. 50

(7)

v

List of Abbreviations

ALT Alanine transaminase

AST Aspartate transaminase

AUC Area under the plasma drug concentration-time curve BBMV Brush border membrane vesicle

BSA Bovine serum albumin

BUN Blood urea nitrogen

Caco-2 Colon adenocarcinoma-2

CDs Cyclodextrins

CF 5(6)-Carboxyfluorescein

C

max

Maximum plasma drug concentration CMC Critical micelle concentration

CMT Sodium methyl cocoyl taurate

CUR Curcumin

DMEM Dulbecco’s Modified Eagle Medium

DNS-Cl Dansyl chloride

DPH 1,6-Diphenyl-1,3,5-hexatriene EDTA Ethylenediaminetetraacetic acid EGTA Ethylene glycol tetraacetic acid ErA Absorption enhancement ratio Ers Solubility enhancement ratio

FBS Fetal bovine serum

FD4 Fluorescein isothiocyanate-labeled dextrans with average molecular weights of 4000

FD10 Fluorescein isothiocyanate-labeled dextrans with average molecular weights of 10000

HBSS Hank’s balanced salt solution

HEPES 2-[4-(2-Hydroxyethyl)-1-piperazinyl]ethane sulfonic acid HPLC High-performance liquid chromatography

LDH Lactate dehydrogenase

LMT Sodium methyl lauroyl taurate

MC Methylcellulose

(8)

vi MMT Sodium methyl myristoyl taurate

NATs N-Acyl taurates

P

app

Apparent permeability coefficient PBS Phosphate buffered saline

P-gp P-glycoprotein

PMT Sodium methyl palmitoyl taurate PVDF Polyvinylidene difluoride

S.E. Standar error

SMT Sodium methyl stearoyl taurate TBST Tris-buffered saline and Tween 20 TEER Transepithelial electrical resistance

tma-DPH 1-(4-(Trimethylamino) phenyl)-6-phenylhexa-1,3,5-hexatriene-p- toluenesulfonate

T

max

Time to the maximum plasma drug concentration Tris Tris(hydroxymethyl)amino methane

TX100 Triton X-100

(9)

vii

Abstract

Curcumin is a polyphenolic compound named as (1E,6E)-1,7-bis(4-hydroxy-3-

methoxyphenyl)hepta-1,6-diene-3,5-dione; CAS number: 458-37-7. The molecular formula is

C

21

H

20

O

6

and it has a molecular weight of 368 g/mol. This compound is derived from Curcuma

longa L. and has demonstrated versatile pharmacological effects including anti-inflammatory

and antioxidant actions in extensive preclinical studies. In addition, the therapeutic effects, such

as anti-tumors, were studied in human clinical trials over the last few decades. In terms of the

high dose at 12 g per day in healthy volunteers, curcumin was well tolerated in the oral

administration and appeared to be safe for the clinical use. However, based on the poor aqueous

solubility and low intestinal permeability of curcumin, the natural product is classified as a

biological classification system (BCS) Class IV molecule. The hydrolytic and light-sensitive

properties also cause the rapid degradation of this natural polyphenol. Due to these

characteristics, curcumin showed a low concentration in plasma after oral administration

resulting in a poor bioavailability. Various approaches have been developed to overcome the

bioavailability problem, such as nanoformulations. Because many ingredients in formulae are

used for both solubilizers and permeation enhancers, it is of interest to investigate their multiple

functions with respect to drug absorption. In our recent research, amorphous solid particles of

curcumin showed an enhanced permeation across the absorptive membrane, while it was not

observed in the presence of crystalline particles or supersaturated solution. Consequently, since

the crystalline powder is more stable than the amorphous particles in dosage forms, the present

study was focused on the development of new curcumin formulations using crystalline particles

with absorption enhancers and examined their absorption-enhancing mechanisms.

(10)

viii

Chapter I Improvement of the solubility and intestinal absorption of curcumin by N-acyl taurates (NATs)

NATs are a subset of acylated amino acids which are surfactants with natural lipid-like structures that exhibit amphiphilic properties. In this chapter, the effects of NATs on the small intestinal absorption of curcumin were examined in rats by an in situ closed-loop method.

Among these NATs, 1% (v/v) sodium methyl lauroyl taurate (LMT) and sodium methyl cocoyl taurate (CMT) were the most effective in increasing the solubility and intestinal absorption of curcumin. The intestinal membrane toxicity of NATs was also evaluated by measuring the activity of lactate dehydrogenase (LDH), a cytotoxicity marker. All of them did not increase the activity of LDH in the luminal fluid, suggesting that they may be safely administered orally.

The relationship between the solubility and absorption demonstrated that the drug solubility is an important factor contributing to the absorption of curcumin. However, the drug absorption was not changed when the solubility was higher than 5 μg/mL, which means that the rate- limiting step was shifted from the apparent solubility of curcumin to the permeation across the intestinal membrane. Thus, the absorption-enhancing mechanism was elucidated in the paracellular pathway using Caco-2 cells. In cellular transport studies, LMT and CMT reduced the transepithelial electrical resistance (TEER) values of Caco-2 cells and increased the transport of 5(6)-carboxyfluorescein (CF) and curcumin. Hence, besides the increased solubility, the improved permeability of curcumin by LMT and CMT also contributed to the intestinal absorption.

Chapter II Improvement of the solubility and intestinal absorption of curcumin by cyclodextrins (CDs)

CDs are a unique type of macrocyclic carriers widely used in pharmaceutical formulations

owing to their versatile functions as the solubilization, stabilization, and permeation

(11)

ix

enhancement. In this chapter, α-CD, β-CD, γ-CD, hydroxypropyl (HP)-β-CD, and dimethyl (DM)-β-CD were applied to the formulation of curcumin. The interaction between curcumin and CD molecules was investigated by phase-solubility diagrams, suggesting that 1:1 complex formation was observed in the solution except for γ-CD. The effects of various CDs on the intestinal absorption of curcumin were evaluated in rat intestine by the in situ closed-loop experiment. Among the tested CDs, 50 mM α-CD significantly enhanced the intestinal absorption of curcumin without causing any serious toxicity to tissues like intestinal membrane, liver, and kidney. In addition to curcumin, 50 mM α-CD increased the intestinal absorption of hydrophilic drugs including CF, fluorescein isothiocyanate-labeled dextrans with average molecular weights of 4000 (FD4), FD10, and salmon calcitonin, suggesting a molecular weight dependency of the absorption-enhancing ability. The analysis of cellular transport across Caco- 2 cell monolayers showed that 50 mM α-CD reduced the TEER value of cell monolayers and improved the paracellular permeability of CF. Furthermore, in the western blotting analysis, α- CD decreased the expression of claudin-4, a tight junction-associated protein, in brush border membrane. Additionally, α-CD increased the membrane fluidity of lipid bilayers in brush border membrane vesicles and may also promote the permeation of drug molecules via the transcellular pathway. Upon these results, it is concluded that 50 mM α-CD is the optimal CD formulation to enhance the absorption not only by solubilizing curcumin but also by assisting its permeation across the intestinal membrane.

Summary

When the solubility was higher than 5 μg/mL, the rate-limiting step of curcumin absorption

was shifted from the apparent drug solubility to the permeation across the intestinal membrane,

which confirmed the drawbacks of curcumin in both solubility and permeability. Of tested

absorption enhancers, 1% (v/v) LMT or CMT, and 50 mM α-CD significantly improved the

(12)

x

absorption of curcumin from the rat small intestine without inducing any serious toxicity to

intestinal tissue or organs. The absorption-enhancing effect of these materials on the

paracellular pathway was evidenced by Caco-2 cell model. In particular, α-CD altered the

barrier properties of both the paracellular and transcellular pathways. Therefore, the intestinal

absorption enhancement by absorption enhancers might be attributed to the synergistic effect

of increased solubility and permeability of curcumin in their presence.

(13)

1 Introduction

Curcuma longa L. is a medicinal plant of the ginger family which has been used for many centuries in India, China, and South East Asia. As claimed in the traditional medicine, it has therapeutic effects to various diseases, such as biliary disorders, anorexia, coryza, cough, diabetic wounds, hepatic disorder, rheumatism, sinusitis, abdominal pains, sprains, and swellings caused by injury.

1)

As the major component, curcumin (CUR) has demonstrated versatile pharmacological effects in extensive animal models where it worked as anti- inflammatory, antioxidant, anticarcinogen, antimicrobial, hepatoprotective, thrombosuppressive, cardiovascular, hypoglycemic, and antiarthritic agents. It also exhibited biological activities to Alzheimer’s diseases, cataract formation, pulmonary toxicity and fibrosis, psoriasis, and renal ischemia.

2,3)

The underlying mechanisms of the treatment may be due to the modulation of immune responses by CUR through its direct actions on signal pathways or target gene expression.

4,5)

Furthermore, the therapeutic activities of CUR have been evaluated in human clinical trials which revealed the potential actions to tumors and psoriasis vulgaris.

6,7)

In terms of the high dose at 12 g per day used in healthy volunteers, CUR was well tolerated in the oral administration and appeared to be safe for the clinical use.

8)

CUR is a polyphenolic compound characterized in Table 1. Due to these characteristics, CUR appears to be a low concentration in plasma after oral administration, resulting in a poor bioavailability.

9)

To achieve much more therapeutic effects, various approaches have been developed by many scientists in the world, such as co-administration of CUR with inhibitors of glucuronidation or prodrugs by conjugation.

10-12)

In current days, CUR nanoformulations have attracted great attention including liposomes, solid lipid nanoparticles, niosomes, polymeric nanoparticles, polymeric micelles, cyclodextrins, dendrimers, silver and gold nanoparticles.

Most of these nanoformulations were attempted to solubilize CUR and increase its stability in

(14)

2

aqueous solutions. Nevertheless, because many ingredients in formulae are used for both solubilizers and permeation enhancers, it is of interest to investigate their multiple functions with respect to drug absorption.

Recently, we developed a novel strategy for improving the bioavailability of CUR by amorphous solid particles.

13)

It is found that these drug particles enhanced the permeation across the absorptive membrane which was not observed in the presence of crystalline CUR powder or supersaturated solution. Consequently, since the crystalline powder is more stable than the amorphous particles in dosage forms, the present study was focused on the development of new curcumin formulations using crystalline particles with absorption enhancers and examined their absorption-enhancing mechanisms.

Up to date, more than 200 intestinal absorption enhancers have been published in previous

preclinical studies, some of which also have been undergoing the investigation in the clinical

trials.

14,15)

Over the past few decades, our research has been demonstrating several promising

absorption enhancers including surfactants, protease inhibitors, NO donors, and polymers,

which showed a strong absorption-enhancing efficacy and a low local toxicity in animal or cell

studies. Of various surfactants, bile salts, sodium glycocholate and sodium taurocholate, and

alkylsaccharide, N-lauryl-β-D-maltopyranoside increased the intestinal absorption of poorly

absorbed drugs including 5(6)-carboxyfluorescein (CF), phenol red, human calcitonin, ebiratide,

enkephalin analogs, and insulin.

16-23)

As a new type absorption enhancer, Gemini surfactant,

sodium dilauramidoglutamide lysine also exhibited the intestinal absorption-enhancing effects

on small hydrophilic molecules and macromolecules like protein and peptide drugs.

24)

In

addition, other types of surfactants, including sucrose fatty acids esters, N-acyl amino acids,

and N-acyl taurates improved the poor absorption of alendronate from the intestine.

25,26)

With

respect to protease inhibitors, bacitracin promoted the intestinal absorption of peptide and

protein drugs by improving drug stability against the peptidases in the intestinal regions.

27-29)

(15)

3

In comparison to the conventional absorption enhancers, NO donors were able to enhance the absorption of CF without any regional difference in the intestine.

30)

In terms of polymers, polyamidoamine (PAMAM) dendrimers improved the absorption of peptide and protein drugs either in nasal delivery or in pulmonary administration.

31,32)

On the other hand, the polymers, such as polyethylene glycol 20000 and polyoxyethylene alkyl ethers worked as P-gp modulators to reverse the efflux activity produced by P-gp transporters.

33,34)

As reported in these studies, most of these absorption enhancers were safe to the mucosal membrane without causing serious damages. Thus, applying absorption enhancers in formulations is still a useful strategy to enhance the intestinal absorption of poorly absorbable drugs like CUR.

In this study, the intestinal absorption of CUR was examined using an in situ closed-loop experiment in the presence of various absorption enhancers. To investigate the mechanisms of absorption enhancement of CUR, the factors as solubilization and permeation enhancement were evaluated when the natural product was co-administered with the absorption enhancers.

Regarding the drug permeation, the cellular transport of CF, a paracellular marker, was examined in Caco-2 cell monolayers and the intestinal expression of claudin-4 was determined in brush border membrane vesicles (BBMVs) in the combination with a absorption enhancer.

Furthermore, the transcellular permeation of CUR enhanced by the absorption enhancer was

also evaluated in light of the membrane fluidity of BBMVs.

(16)

4 Table 1 Characteristics of CUR

35)

Chemical name (1E,6E)-1,7-bis(4-hydroxy-3-methoxyphenyl)hepta- 1,6-diene-3,5-dione

C.A.S number 458-37-7

Molecular formula C

21

H

20

O

6

Molecular weight 368 g/mol

Chemical structure

Enol form (at pH > 8)

Keto form (at pH 1-7) Physical and chemical properties

Physical state Solid crystalline

Color Orange-yellow (at pH = 7)

Odor odorless

Solubility 11 ng/mL (in water at pH 5)

36)

Permeability Log Kow = 3.29

a

pK

a

7.8, 8.5 and 9.0

37)

Light sensitivity Light sensitive

a

Note: Estimated using EPI Suite

TM

(Ver. 4.11, 2012, developed by US EPA)

(17)

5

Chapter I Improvement of the solubility and intestinal absorption of curcumin by N-acyl taurates

N-acyl taurates (NATs) are a subset of acylated amino acids which are surfactants with

natural lipid-like structures that exhibit amphiphilic properties.

38)

These taurates showed

excellent detergency and stability over the whole pH range in aqueous solution.

39)

Due to

medium-chain fatty acyl moieties, NATs possess a variety of properties and may be used for

different purposes. Since they were invented from 1930s, taurates are mainly used in the

personal care applications. For example, sodium cocoyl taurate (CMT) were applied as the

primary surfactant to replace the sodium lauryl sulphate (SLS) in the SLS free product.

40)

Some

taurates with long-chain fatty acids have been identified in brain, liver, kidney, and skin.

41,42)

These endogenous taurates activate multiple members of the transient receptor potential (TRP)

family of calcium channels, including TRPV1 and TRPV4. Because TRPV4 locates in many

different epithelial cells, the activation of this channel may modulate epithelial permeability by

regulating extracellular and intracellular calcium concentrations.

43)

Recently, the absorption-

enhancing abilities of NATs have been examined in the intestinal absorption of alendronate,

which is characterized as a water-soluble and poorly absorbed drug.

26)

However, the enhancing

effects on other poorly absorbed drugs are still not well understood. Thus, five NATs with C8-

C18 fatty acyl chains (Fig. 1) were selected to evaluate their enhancing effects on the intestinal

absorption of CUR.

(18)

6 1.1 Materials and methods

1.1 Materials and methods 1.1.1 Materials

Curcumin, LDH-cytotoxic test Wako, albumin (from bovine serum, Cohn fraction V, pH 7.0), sodium carbonate were bought from Wako Pure Chemical Industries, Ltd. (Osaka, Japan). 5(6)- Carboxyfluorescein was produced by Eastman Kodak Company (Rochester, NY, USA). N-acyl taurates was supplied by Nikko Chemical Co. Ltd. (Osaka, Japan). Methylcellulose was purchased from Nacalai Tesque, Inc. (Kyoto, Japan). Caco-2 cells was provided by Dainippon Sumitomo Pharma Co., Ltd. (Osaka, Japan). Dulbecco’s modified eagle’s medium (DMEM), fetal bovine serum, and MEM non-essential amino acid solution was supplied by Life Technologies Corporation (Carlsbad, CA, USA). 0.25% Trypsin-1 M EDTA (ethylenediaminetetraacetic acid) and antibiotic-antimycotic mixed stock solution (10,000 U/mL penicillin, 10 mg/mL streptomycin, 25 mg/mL amphotericin B, 0.85% w/v saline) were manufactured by Dojindo Laboratories (Kumamoto, Japan). Hank’s balanced salt (HBS;

H6136-10X1L) was purchased from Sigma-Aldrich Chemical Co. Ltd. (St. Louis, MO, USA).

Polycarbonate membrane Transwell inserts (12 wells, 12 mm in diameter, 0.4-μm pore size, R - CON(CH

3

) CH

2

CH

2

SO

3

Na

Coconut oil, cocoyl (CMT): C7~C17 Lauroyl (LMT): C11

Myristoyl (MMT): C13 Palmitoyl (PMT): C15 Stearoyl (SMT): C17 R=

Fig. 1. Chemical structure of N-acyl taurates

(19)

7

sterile) were manufactured by Corning Inc. (Corning, NY, USA). All other reagents used in the experiments were of analytical grade.

1.1.2 Solubility of CUR in 1% NAT formulations

An over-saturated CUR suspension was prepared in 1 mL 1% (v/v or w/v) NAT in PBS (pH 6.5). The suspension was agitated for 5 min at 25 °C using Vortex-Genie 2 (Scientific Industries, Inc., Bohemia, NY, USA), and then was centrifuged at 9660 × g for 5 min. The supernatant was collected for the assay. The solubility enhancement ratio (ErS) was calculated from the following equation:

ErS = Solubility with absorption enhancer/Solubility without absorption enhancer

1.1.3 Intestinal absorption study of CUR with NATs

The intestinal absorption was evaluated by administering CUR into rat small intestine in an

in situ closed-loop experiment.

18,44)

All experiments were conducted in compliance with the

guidelines of the Animal Ethics Committee at Kyoto Pharmaceutical University. The crystalline

powder of CUR was suspended in 1% (v/v or w/v) NAT in pH 6.5 PBS containing 1% (w/v)

methylcellulose (MC) to reach the concentration at 16.67 mg/mL, followed by agitation for 5

min at 25 °C, ahead of the intestinal administration. The drug suspension without any NAT was

set as the control. Prior to the experiment, male Wistar rats, weighing 220-260 g, were fasted

for 16 h with a free access to water. To begin the experiment, the animals were anesthetized by

intraperitoneal injection of sodium pentobarbital (32 mg/kg body weight) and placed under a

heating lamp to keep warm. The small intestine was exposed through a midline abdominal

(20)

8

incision. After ligating the bile duct, polyethylene cannulas were inserted into the incisions of the small intestine at duodenal and ileal ends. The small intestine was then washed with PBS (10 mL × 2) to clean the intestinal content. Three milliliters of the drug suspension was administered into the small intestine and then the cannulas were closed by forceps.

45)

Blood samples (~ 0.4 mL) were withdrawn from the jugular vein at the predetermined time up to 240 min after administration. 150 μL of plasma was separated immediately by centrifugation at 9660 × g for 5 min and stored at -30 °C until assay.

The maximal plasma concentration of CUR (C

max

) and the time to maximal plasma concentration (T

max

) were read from the plasma drug concentration-time curve. The area under the curve (AUC) between 0 and 240 min was calculated manually by the trapezoidal method.

The absorption enhancement ratio (ErA) was obtained from the following equation:

ErA = AUC

0240 min

with absorption enhancer /AUC

0240 min

without absorption enhancer

1.1.4 Intestinal membrane toxicity after administration of NATs

The intestinal membrane toxicity of NATs was evaluated in terms of the activity of LDH

released from intestinal epithelia cells. PBS (pH 6.5), 1% NAT, and 3% (v/v) Triton X-100

(TX100) were administered, respectively, into the small intestinal loops of experimental

animals by the in situ closed-loop method. After 240 min post administration, the small intestine

was washed with 30 mL of ice-cold PBS (pH 7.4) which was collected from the ileal end and

stored in an ice box subsequently. The washing solution was centrifuged at 200 × g for 7 min

at 4 °C to get rid of any deposition, and then was diluted by 100 times. The activity of LDH

was determined by mixing the dilution with LDH-cytotoxicity test Wako kit and reading the

(21)

9

absorbance at 590 nm with a microplate multi-detection reader (Synergy HT with Gen 5 software; BioTek Instruments, Inc., Winooski, VT, USA).

1.1.5 Cellular transport of CF and CUR with NATs 1.1.5.1 Cell culture

Caco-2 cells were cultured in DMEM containing 10% (v/v) FBS, 1% (v/v) antibiotic- antimycotic mixed stock solution, and 0.1 mM MEM non-essential amino acid solution in a filter cap cell culture flask with a humidified atmosphere of 5% CO

2

at 37 °C.

28,29)

Cells at passage 54-68 were seeded onto 12-well plates fitted with polycarbonate inserts at a density of 1 × 10

5

cells/well. The cultivated cells grew for 21 days by changing the culture medium every 2 days. Transepithelial electrical resistance (TEER) values of the cell monolayers were measured using a Millicell-ERS voltohmmeter (EMD Millipore Corporation, MA, USA). When these values were more than 500 ohms∙cm

2

, Caco-2 cell monolayers were used for the following experiments.

1.1.5.2 Cellular transport study of CF

Cellular transport was studied from the apical and basolateral direction by adding a donor solution/suspension to the apical compartment. Generally, the pH value in the apical side of jejunum is about 6.5, while the pH of the basolateral side is about 7.4. Thus, in the present study, a similar pH gradient was used to mimic the physiological condition of the small intestine.

After 1 h incubation in HBSS at 37 °C, the transport experiments were initiated by replacing

with 0.5 mL of 10 μM CF in HBSS (pH 6.5) in the apical side. At the defined times up to 360

(22)

10

min, the TEER value was measured and 200 μL sample was taken out from 1.5 mL of the receiving HBSS (pH 7.4) which was then supplemented by the fresh medium. The fluorescence intensity of CF was measured at an excitation wavelength of 485 and emission wavelength of 528 nm using a microplate multi-detection reader.

1.1.5.3 Cellular transport study of CUR

In the transport experiments of CUR, 0.5 mL of 2 mM drug suspension, with or without NAT, in HBSS (pH 6.5) was added to the apical side of 1 h-incubated Caco-2 cell monolayers. 1.5 mL of HBSS (pH 7.4) containing 5% (w/v) bovine serum albumin (BSA) was applied in the basolateral compartment. Other procedures were kept same as the cellular transport of CF in1.1.5.2. The samples were stored at -30 °C until assay.

1.1.5.4 Apparent permeability coefficient (P

app

)

Based on the transported compound in the receiving solution, the P

app

value was calculated as follows:

P

app

= (dQ⁄dt)/(A∙C

0

)

where P

app

is the apparent parameter of permeability (cm/s), dQ/dt is the rate of the test

compound appearance in the receiver side (pmol/s), A is the membrane surface area (1.12 cm

2

),

and C

0

is the initial concentration or solubility of the test compound in donor solution or

suspension (nM).

(23)

11 1.1.6 Determination of CUR by HPLC

The assay of CUR in the solubility and intestinal absorption studies was determined using an HPLC system configured with a binary pump (LC-20AB; Shimadzu Corporation, Kyoto, Japan) and UV/Vis detector (SPD-20A). CUR was eluted at 35 °C by a C18 reverse-phase column (150 × 4.6 mm, 5C18-AR-II; Nacalai Tesque Co. Ltd, Kyoto, Japan) and was analyzed at 420 nm. The mobile phase was a mixture of 5% (v/v) acetic acid and methanol (32:68, v/v) with a flow of 1 mL/min. In order to determine the concentration of CUR in plasma, 150 μL plasma sample was mixed with 15 μL 5% (v/v) acetic acid. CUR was extracted from the treated plasma by 1 mL ethyl acetate, which was then evaporated at 40 °C for 30 min and re-dissolved by 150 μL methanol. 50 μL of the resulting sample was injected into the HPLC system.

The concentration of CUR in the cellular transport study was measured in the same HPLC system as described above, while the detector was replaced with a fluorescence detector (RF- 10AXL; Shimadzu Corporation, Kyoto, Japan). The excitation and emission wavelengths were set at 420 and 530 nm, respectively.

46)

150 μL of receiving solution was mixed with 15 μL 5%

(v/v) acetic acid. The BSA in the sample was precipitated by mixing the treated sample with 335 μL of methanol, followed by centrifuging at 9660 × g for 10 min. The supernatant was collected for HPLC injection.

1.1.7 Statistical Analyses

Results are expressed as the mean ± S.E. of at least three experiments. Tests of statistical

significance of different experimental groups were performed using Dunnett’s test, in which p

(24)

12

< 0.05 was considered significant. Significance levels are denoted as (n.s.) not significantly different, (*) p < 0.05, (**) p < 0.01, and (***) p < 0.001.

1.2 Results and discussion

1.2.1 Solubility of CUR improved by NATs

In order to improve the free drug in the aqueous solution, CUR was suspended in 1% NAT solution by an agitation method. Compared to the control, the solubility of CUR was improved with an ErS at more than 90 by all NATs, especially CMT and LMT (Table 2). The rank order of the solubilizing effect was CMT > LMT > MMT > SMT > PMT.

As a subset of acylated amino acids, NATs are used as solubilizers in the solution for

hydrophobic substances. NATs with short fatty acid chains, such as C8-C12, could improve the

solubility of CUR effectively and the solubilizing effects of these taurates decreased along with

the increase in the length of their fatty acid chains. The strong solubilizing effect of LMT may

be ascribed to the formed micelles when the applied concentration was above CMC which was

about 0.3% (w/v).

47)

Similarly because LMT is the main composition of CMT, it is possible

that CUR molecules were entrapped in the micelles in CMT solution. Moreover, the mixed

micelles formed by complex compositions in CMT might contribute to the highest solubility of

CUR.

(25)

13

Table 2 Solubility of CUR in the presence of 1% NATs

Group Solubility (μg/mL) ErS

CUR 0.007 ± 0.001 1

+1% (v/v) CMT 35 ± 0.34*** 5000

+1% (v/v) LMT 29 ± 0.69*** 4143

+1% (w/v) MMT 5.7 ± 0.88*** 814

+1% (w/v) PMT 0.63 ± 0.14 90

+1% (w/v) SMT 0.73 ± 0.10 104

Results are expressed as the mean ± S.E. of at least 3 experiments.

(***) p<0.001, compared with CUR (control). (Table 2 in Biol. Pharm. Bull. 2017, 40 (12), 2175–2182.)

1.2.2 Intestinal absorption of CUR in the presence of NATs

The intestinal absorption of CUR in the presence of 1% NATs was studied by administering the drug suspension into the loop of the rat small intestine. As shown in Fig. 2, the plasma CUR appeared obviously in the first hour after administering CUR with CMT, LMT, or MMT. The concentration of CUR in plasma increased slowly in the experiment using SMT as the absorption enhancer, while the PMT group presented a similar profile to the control. The pharmacokinetic parameters in Table 3 showed a significant increase in the intestinal absorption of CUR in the presence of CMT, LMT, and MMT. Based on the ErA values, the rank order of the absorption-enhancing ability is as follows: LMT ≥ MMT ≥ CMT > SMT > PMT.

Furthermore, the bioavailability and absorption rate of CUR were estimated in Table 4 by a

deconvolution method.

48)

In the presence of CMT, LMT, and MMT, after 240 min treatment,

the drug bioavailability (F) could reach above 17%. Furthermore, both CMT and LMT groups

(26)

14

display the fastest absorption rate of CUR at 1.24 (ng/min), suggesting that these two taurates have a fast onset of absorption-enhancing action. In contrast, SMT displayed a mild effect on the absorption of CUR in the small intestine. However, it was difficult to estimate these parameters in the control and PMT groups owing to the low drug absorption.

In light of the solubilizing ability of NATs, one possible explanation to the enhanced

absorption might be the N-acyl taurate micelles which can act as a drug reservoir to maintain a

constant free CUR for the intestinal absorption. It also should be noted that the drug suspension

consisted of free CUR, CUR in micelles, and the solid drug particles.

49)

In this case, the

dissolution rate of solid CUR was accelerated by absorption enhancers. Therefore, the

relationship between the solubility and absorption was investigated when CUR was co-

administrated intestinally with NATs. As shown in Fig. 3, a good sigmoidal relationship

(R=0.8725) was obtained between two indexes, demonstrating that the solubility is an important

factor contributing to the absorption of CUR in the presence of NATs. However, the drug

absorption was not changed when the solubility was higher than 5 μg/mL. This finding indicates

that the rate-limiting step was shifted from the apparent solubility of CUR in micelles to the

permeation across the intestinal membrane. Therefore, it was regarded that NATs, especially

LMT and CMT, acted as both solubilizer and permeation enhancer to promote the absorption

of CUR in the small intestine.

(27)

15

Table 3 Pharmacokinetic parameters of CUR in the presence of 1% NATs after intestinal administration to rats

Group C

max

(μg/mL) T

max

(min) AUC

0→240 min

(μg/mL∙min) ErA

CUR 0.004 ± 0.004 30 ± 0 0.090 ± 0.090 1

+1% (v/v) CMT 0.027 ± 0.005 30 ± 0 3.8 ± 0.68* 42 +1% (v/v) LMT 0.016 ± 0.007 27 ± 12 4.2 ± 0.34** 47 +1% (w/v) MMT 0.037 ± 0.007 60 ± 17 3.9 ± 1.1* 43 +1% (w/v) PMT 0.003 ± 0.001 60 ± 0 0.10 ± 0.020 1 +1% (w/v) SMT 0.020 ± 0.001 150 ± 24 1.9 ± 1.6 21 Results are expressed as the mean ± S.E. of 3-4 experiments. (**) p< 0.01, (*) p< 0.05, compared with CUR (control). (Table 1 in Biol. Pharm. Bull. 2017, 40 (12), 2175–2182)

0 0.01 0.02 0.03 0.04 0.05

0 30 60 90 120 150 180 210 240

P lasm a CUR conce ntrat ion g/m L)

Time (min)

Fig. 2. Absorption of CUR (200 mg/kg) from rat small intestines in the presence of 1% NATs

Keys: (○) CUR only, (▲) +1% (v/v) LMT, (■) +1% (v/v) CMT, (♦) +1% (w/v) MMT, (□)

+1% (w/v) PMT, (△) +1% (w/v) SMT. Results are expressed as the mean ± S.E. of 3-4

experiments. (Fig. 2 in Biol. Pharm. Bull. 2017, 40 (12), 2175–2182)

(28)

16

Table 4 Estimation of bioavailability and absorption rate of CUR using a deconvolution method

Time (min)

+1% (v/v) CMT +1% (v/v) LMT +1% (w/v) MMT +1% (w/v) SMT

F (%)

Absorption rate

(ng/min)

F (%)

Absorption rate

(ng/min)

F (%)

Absorption rate

(ng/min)

F (%)

Absorption rate

(ng/min)

15 0.9 0.60 0.8 0.53 0.6 0.40 0.2 0.14

30 2.7 1.24 2.3 0.98 2.1 1.01 0.5 0.19

60 6.1 1.11 6.0 1.23 5.7 1.20 1.4 0.28

90 9.1 0.99 9.7 1.24 8.6 0.97 2.4 0.33

120 11.4 0.80 12.6 0.98 11.1 0.81 3.7 0.44

180 14.9 0.58 16.4 0.62 14.8 0.62 6.9 0.53

240 17.7 0.46 18.9 0.42 17.7 0.49 9.2 0.39

Note: Bioavailability (F) was estimated based on the ratio of AUC

0-240 min

from the intestine to that of intravenous injection.

(Reported data in Biol. Pharm. Bull. 2017, 40 (12), 2175–2182

y = 0.525ln(x) + 2.0756 R = 0.8725

0.0 0.5 1.0 1.5 2.0 2.5 3.0 3.5 4.0 4.5

0 5 10 15 20 25 30 35 40

AUC

0→240 min

g/m L∙ m in )

Solubility (μg/ml)

Fig. 3. The relationship between the solubility and intestinal absorption of CUR in the presence of 1% NATs

(Fig. 7 in Biol. Pharm. Bull. 2017, 40 (12), 2175–2182)

(29)

17

1.2.3 Intestinal membrane toxicity in the presence of NATs

The activity of LDH released from the rat small intestine was determined in the intestinal washing solution after 4 h treatment of 1% NAT. The results in Fig. 4 presented that none of the tested NATs induced the remarkable release of LDH. On the contrary, 3% (v/v) TX100, the positive control, increased the activity of LDH in the intestinal washing solution. This means that NATs did not cause serious damage and irritation to the mucosal membrane of rat intestine.

LDH is a cytosolic enzyme which was recommended as a potential marker for the evaluation

of intestinal damage.

50)

Some attention should be paid to the depletion of LDH in the tissue

since the LDH release was less in LMT group than that in the control. Nevertheless, it is found

that this depletion would not occur in the taurate groups on the basis of the considerably high

LDH activity in TX100 treated group. Consequently, the exact reason for the decrease of LDH

is still not clear in the present study.

(30)

18

1.2.4 Effects of NATs on the permeation of poorly absorbable drugs across Caco-2 cell monolayers

1.2.4.1 TEER values of Caco-2 cell monolayers

To evaluate the barrier function of Caco-2 cell monolayers, the TEER value was monitored for 6 h in the cellular transport study. As depicted in Fig. 5, the cellular TEER value changed in the NAT concentration-dependent manner when Caco-2 cells were exposed to 0.003-0.1%

(v/v) of either CMT or LMT. The TEER values decreased to a steady state in the presence of the high concentration of both taurate solutions. In addition, at the concentration of 0.01%,

0 2000 4000 6000 8000 10000 12000 14000

PBS +1% CMT +1% LMT +1% MMT +1% PMT +1% SMT 3% TX100

LDH assay (m U/m L)

N.S.

*

Fig. 4. The activity of LDH released from the intestinal membrane in the presence of 1%

NATs

Results are expressed as the mean ± S.E. of 3-4 experiments. N.S. means no significant difference compared with PBS (control). (*) p< 0.05, compared to PBS. (Fig. 3 in Biol.

Pharm. Bull. 2017, 40 (12), 2175–2182)

(31)

19

CMT produced a stronger efficacy than LMT on the barrier of Caco-2 cells and induced a reversible change of TEER value. Thus, the substantial decrease of TEER values indicates that high concentrations of both CMT and LMT could disrupt tight junctions in the paracellular pathway.

1.2.4.2 Effects of CMT and LMT on the cellular transport of CF

The effects of CMT and LMT on the paracellular permeation across the intestinal epithelia were studied in the cellular model of Caco-2 using CF as a paracellular marker. As shown in Fig. 6, the P

app

value was improved from (0.13 ± 0.01) × 10

-6

cm/s in the control to (12.58 ± 0.73) × 10

-6

and (11.61 ± 0.21) × 10

-6

cm/s in 0.1% CMT and LMT solution, respectively. On

0 20 40 60 80 100 120 140 160 180

0 60 120 180 240 300 360

TE ER (% of in itial valu e)

Time (min)

Fig. 5. TEER changes of Caco-2 cell monolayers in the presence of CMT and LMT

Keys: (○) CF, (▲) +0.003% (v/v) LMT, (■) +0.01% (v/v) LMT, (♦) +0.1% (v/v) LMT, (△) +0.003% (v/v) CMT, (□) +0.01% (v/v) CMT, (◊) +0.1% (v/v) CMT. Results are expressed as the mean ± S.E. of 3 experiments. Some error bars of S.E. are within the size of symbols.

(Fig. 4 in Biol. Pharm. Bull. 2017, 40 (12), 2175–2182)

(32)

20

the contrary, the taurate solutions at other concentration did not change the permeability of CF significantly. In accordance with the fast recovery observed in TEER value, 0.01% CMT just accelerated the permeability 3-fold higher than the control.

The enhanced permeability of CF in this experiment further suggested that both CMT and LMT had a positive effect on the reduction of the paracellular barrier in the intestine, so that they could improve the intestinal absorption. This effect was linked to their applied concentrations in the solution. Additionally, this result is consistent with our previous work where CMT effectively improved the intestinal absorption of alendronate, a poorly absorbed drug in the oral administration. Hence, it is assumed that these two taurates would enhance the intestinal absorption of poorly absorbable drugs with similar molecular size to CF (MW=376) via the paracellular pathway.

0 2 4 6 8 10 12 14

CF +0.003% +0.01% +0.1% +0.003% +0.01% +0.1%

Control LMT CMT

P

app

of CF ( × 10

-6

cm /s)

***

***

Fig. 6. Cellular transport of CF in the presence of either CMT or LMT

Results are expressed as the mean ± S.E. of 3 experiments. (***) p< 0.001, compared with

control. (Fig. 5 in Biol. Pharm. Bull. 2017, 40 (12), 2175–2182)

(33)

21

1.2.4.3 Effects of CMT and LMT on the cellular transport of CUR

To examine the effects of CMT and LMT on the permeability of CUR, CUR suspension containing each NAT was applied as the donor in Caco-2 cell models. As is evident in Fig. 7, the permeability of CUR across cellular layers was markedly improved by 0.1% CMT or LMT.

The P

app

value increased from (0.70 ± 0.04) × 10

-6

cm/s in free CUR suspension to (5.36 ± 0.60)

× 10

-6

and (6.74 ± 0.38) × 10

-6

cm/s in CMT and LMT solution, respectively.

Given the drug permeation was the rate-limiting step, the enhanced absorption of CUR in the small intestine might be attributed to the improved paracellular permeation induced by these taurates. In our previous study, it has been proved that N-acyl amino acid was able to improve the paracellular permeation of drugs by loosening the tight junctions through the regulation of the expression of tight junction-associated proteins. Therefore, it is plausible that CMT and LMT could enhance the diffusion of free CUR across the intestinal membrane by the similar mechanism.

Furthermore, based on our previous study, N-acyl amino acid increased the drug permeation

through a transcellular pathway by increasing the plasma membrane fluidity of epithelial cells.

26)

In this case, CMT and LMT may act to enhance the intestinal absorption of CUR in the same

way. Therefore, more evidence regarding the transcellular permeation is needed in the future.

(34)

22 1.3 Conclusions

In this chapter, NATs were used as solubilizers and absorption enhancers to improve the intestinal absorption of CUR. Of these taurates, CMT and LMT were the superior types which not only improved the aqueous solubility of CUR but also enhanced the drug absorption in rat small intestines. The activity of LDH released from the intestinal membrane demonstrated that all tested NATs were potentially safe excipients without causing serious damage and irritation to the intestinal tissue. The cellular transport of CF indicated that CMT and LMT were able to enhance the paracellular permeation by disrupting the barrier of cellular layers. In the same Caco-2 cell model, the permeability of CUR enhanced by both taurates was verified in terms of significantly increased P

app

values. These results suggested that co-administration with either CMT or LMT would be a simple and effective method to enhance the absorption of CUR in the small intestine by improving the drug solubility and permeability simultaneously.

0 1 2 3 4 5 6 7 8

CUR +0.1% LMT +0.1% CMT

P

app

of CUR ( × 10

-6

cm /s)

***

**

Fig. 7. Cellular transport of CUR in the presence of either CMT or LMT

Results are expressed as the mean ± S.E. of 3 experiments. (***) p< 0.001, compared with

control. (Fig. 6 in Biol. Pharm. Bull. 2017, 40 (12), 2175–2182)

(35)

23

Chapter II Improvement of the solubility and intestinal absorption of curcumin by cyclodextrins

CDs are made of 6-8 units of oligosaccharides which form a non-polar cavity in the center.

They are a unique type of macrocyclic carriers widely used in pharmaceutical formulations owing to their versatile functions as the solubilization, stabilization, and permeation enhancement. In order to improve the activities, numerous CD derivatives were synthesized by adding functional moieties including hydroxypropyl and methyl groups.

36)

As solubilizers, CDs were employed to overcome low water solubility of lipophilic drugs and ameliorate their absorptions by producing a high concentration gradient between drugs and various epithelial membranes. HP-β-CD was applied to increase drug bioavailability in various administrations including oral, ocular, and transdermal routes.

51-53)

In addition, CDs were used as the chemical absorption enhancers to modulate the drug permeation across the epithelial membranes. It was demonstrated that the natural types of CDs could work as carriers to pass through Calu-3 layers by a passive diffusion via a paracellular pathway rather than a transcelluar pathway.

54)

The methylated CDs may either enhance the paracelluar permeation of macromolecules by opening tight junctions or activate cellular uptake in the transcelluar pathway by macropinocytosis.

55,56)

As reported previously, CDs are capable to improve the aqueous solubility and stability of CUR.

However, few studies have been examined on the action of CDs to alter the low permeability

across the mucosal membrane. Therefore, in this chapter, the effects of various CDs, α-, β-, γ-

CD, HP-β-CD, and DM-β-CD (Fig. 8), on the intestinal absorption of CUR was studied,

followed by the elucidation of the absorption-enhancing mechanisms.

(36)

24 2.1 Materials and methods

2.1.1 Materials

Curcumin, salmon calcitonin, Glucose B test kit, calcium E test kit, lactate dehydrogenase (from chicken heart), coomassie brilliant blue (CBB) G-250, transaminase CII-test Wako, albumin (from bovine serum, Cohn fraction V, pH 7.0), sodium carbonate, and 1-(4- (trimethylamino) phenyl)-6-phenylhexa-1,3,5-hexatriene-p-toluenesulfonate (tma-DPH) were bought from Wako Pure Chemical Industries, Ltd. (Osaka, Japan). Insulin, 2,6-Di-O-methyl-β- CD (DM-β-CD), γ-CD, Chemi-Lumi One Ultra, and dansyl chloride (DNS-Cl) were supplied by Nacalai Tesque, Inc. (Kyoto, Japan). α-CD, β-CD, and HP-β-CD were produced by Nihon Shokuhin Kako Co., Ltd. (Tokyo, Japan). 5(6)-Carboxyfluorescein was manufactured by Eastman Kodak Company (Rochester, NY, USA). Fluorescein isothiocyanate-dextrans with average molecular weights of 4000 (FD4) and 10000 (FD10), Hank’s balanced salt (H6136- 10X1L), and 1,6-diphenyl-1,3,5-hexatriene (DPH) were purchased from Sigma-Aldrich Chemical Co. (St. Louis, MO, USA). Cytotoxicity detection kit was produced by Roche

Fig. 8. Chemical structure of cyclodextrins

n=1 (α), 2 (β), 3 (γ); R=H-, CH

3

CH(OH)CH

2

-, or CH

3

-

(37)

25

Diagnostics GmbH (Penzberg, Germany). QuantiChrom™ Urea Assay Kit was supplied by BioAssay Systems, Hayward (CA, USA). Caco-2 cells were bought from Dainippon Sumitomo Pharma Co., Ltd. (Osaka, Japan). Dulbecco’s modified eagle’s medium (DMEM), fetal bovine serum, and MEM non-essential amino acid solution were manufactured by Life Technologies Corporation (Carlsbad, CA, USA). 0.25% Trypsin-1 M EDTA (ethylenediaminetetraacetic acid) and antibiotic-antimycotic mixed stock solution (10,000 U/mL penicillin, 10 mg/mL streptomycin, 25 mg/mL amphotericin B, 0.85% w/v saline) were prepared by Dojindo Laboratories (Kumamoto, Japan). Polycarbonate membrane Transwell inserts (12 wells, 12 mm in diameter, 0.4-μm pore size, sterile) were manufactured by Corning Inc. (Corning, NY, USA).

Claudin-4 Mouse Monoclonal Antibody-Unconjugated and HRP-Rabbit Anti-Mouse IgG (H+L) Conjugate were produced by Invitrogen

TM

(Carlsbad, CA, USA). α-Tubulin (DM1A) Mouse mAb was purchased from Cell Signaling Technology, Inc. (Danvers, MA, USA). Can Get Signal Solution 2 was provided by Toyobo Co., Ltd. (Osaka, Japan). ECL

TM

western blotting reagents was manufactured by GE Healthcare UK Ltd. (Buckinghamshire, England). BCA Protein Assay Kit was bought from Thermo Fisher Scientific Inc. (Waltham, MA, USA). All other reagents used in the experiments were of analytical grade.

2.1.2 Preparation of CUR suspension in CD formulations

20 mg of CUR were suspended into 1 mL of one of pre-prepared 20-100 mM CD solutions/suspensions in a closed vial. The drug suspension was treated with an ultrasound at 40 kHz at 30 °C for 2 h in a dark room.

57)

To test the solubility of CUR in CD solution, the drug suspension was centrifuged at 9660 × g for 2 min and then filtered through a 0.45-μm filter.

The initial filtrate was discarded and the remaining solution was collected and diluted with 5%

(v/v) acetic acid for the assay. The ErS was calculated from the same equation in 1.1.2.

(38)

26

2.1.3 Intestinal absorption of drugs in the presence of CDs 2.1.3.1 Intestinal absorption of CUR in CD formulations

The intestinal absorption was assessed in the same manner as described in 1.1.3. 16.67 mg/mL of CUR was prepared in one of 20-100 mM CD solutions/suspensions in pH 6.5 PBS.

Free CUR was dispersed in PBS as the control. All dosing suspensions were treated in the same way as described in 2.1.2. The ErA value was calculated from the same equation in 1.1.3.

2.1.3.2 Intestinal absorption of hydrophilic and poor-absorbable molecules with 50 mM α-CD

In the similar in situ closed-loop experiment to the above, CF, FD4, FD10, salmon calcitonin, and insulin were co-administered with 50 mM α-CD solution at the different doses per unit of body weight which were 0.5 mg/kg, 8 mg/kg, 80 μg/kg, and 80 IU/kg, respectively. Free drugs in PBS were used as the controls. The absorptions of salmon calcitonin and insulin were evaluated based on the calcium and glucose concentrations in plasma.

2.1.4 Toxicity study of CDs

2.1.4.1 Intestinal membrane toxicity of CD formulations

In this study, the intestinal membrane toxicity caused by CDs were evaluated based on the quantification of LDH or protein leakage and the morphology of small intestine villi cells.

To measure the LDH activity and the leaked protein from the intestinal tissue, the small

intestine was washed with 30 mL of cold PBS (pH 7.4) which was collected from the ileal end

and stored in an ice box subsequently. The washing solution was centrifuged at 200 × g for 7

min at 4 °C to get rid of any deposition and then was diluted by 100 times for the LDH assay

and 10 times for the protein determination. The activity of LDH was determined using the

working solution of the cytotoxicity detection kit and the absorbance was read at 490 nm. The

(39)

27

leakage of protein was measured at 595 nm based on the Bradford method.

58)

3% (v/v) TX100 was administered into rat small intestines as a positive control.

The morphology of small intestine villi cells was observed by haematoxylin and eosin (H&E) staining method. To visually identify the damage of the intestinal membrane, the small intestine was examined after the treatment of 50 mM α-CD through an in situ closed-loop experiment.

24,59)

The small intestinal loop segment was removed and fixed by 4% buffered- formaldehyde. The resulting segment was embedded in a paraffin block, sectioned with thickness at 5 μm, and stained with H&E in order. The stained sections were observed by a light microscopy (BZ-8000 Fluorescence Microscope; KEYENCE Corporation, Osaka, Japan).

2.1.4.2 In vivo toxicity of α-CD

In order to obtain the in vivo safety evidence, we evaluated the hepatotoxicity of α-CD by testing aspartate transaminase (AST) and alanine transaminase (ALT), and the nephrotoxicity by testing blood urea nitrogen (BUN). Three milliliters of 50 mM α-CD in pH 6.5 PBS was administered intestinally in rats by the in situ closed-loop method as described in 1.1.3. PBS was administered as the control. After 240 min treatment, blood samples (~ 0.4 mL) were withdrawn from each group and the plasma was collected immediately by centrifugation at 9660 × g for 5 min. The levels of AST and ALT in plasma were measured using the transaminase CII-test Wako, while the assessment of BUN was carried out using Quantichorom

TM

urea assay kit.

2.1.5 Cellular transport of CF and CUR in the presence of α-CD 2.1.5.1 Cellular transport of CF

Caco-2 cells were cultured as described in 1.1.5.1. All experimental procedures were similar

to that in 1.1.5.2, except that 0.5 mL of 10 μM CF in 20 or 50 mM α-CD was added in the apical

(40)

28

compartment. The concentrations of CF were determined by spectrofluorimetry. The same equation in 1.1.5.4 was employed to calculate P

app

value of each drug. After finishing 6 h of cellular transport study, Caco-2 cellular monolayers were incubated at 37 °C in the cell culture medium and the TEER values were monitored until 24 h.

2.1.5.2 Cellular transport of CUR

Similar to 1.1.5.3, 2 mM CUR in 20 or 50 mM α-CD was prepared as the donor suspension for the cellular transport across Caco-2 cell monolayers. In addition, the concentration of CUR and P

app

calculation were conducted in the same way as NAT groups.

2.1.6 Western blotting analysis

Western blotting was used to analyze the expression of tight junction-associated proteins in the brush border membrane of rat intestines. The intestine of the male Wister rat was treated with 50 mM α-CD in the same manner as described in the in situ closed-loop experiment. The rats were divided into three groups: control, treatment, and recovery group. In the treatment group, the rat small intestine was exposed to the α-CD solution for 90 min and then was removed for the following process. In the recovery group, after 90-min exposure to α-CD, the small intestine was washed with PBS and, 2 h later, was removed in the same method as the treatment group. The PBS-treated small intestine was used as the control. The removed small intestines were excised to extract tight junction-associated proteins in the brush border membrane as per the method in 2.1.7.1. The protein content of each sample was diluted to a final concentration of 5 mg/mL in the homogenizing buffer and the final samples were stored at -80 °C until use.

As one of the tight junction-associated proteins, the expression of claudin-4 was examined

in the brush border membrane by a western blotting. Briefly, 20 μL of protein samples were

(41)

29

mixed with SDS buffer solution and separated on a 15% (v/v) polyacrylamide gel at 80 V for 5-6 h by electrophoresis. The separated proteins were electrically transferred to a polyvinylidene difluoride (PVDF) membrane at 15 V for 20 min. The membranes were blocked in 5% (w/v) skim milk in Tris-buffered saline and Tween 20 (TBST) and then incubated with a 1:500 dilution of primary antibodies for claudin-4 and α-tubulin, respectively.

60)

Subsequently, after washing three times with TBST, these membranes were incubated with a 1:1000 dilution of HRP-Rabbit Anti-Mouse IgG (H+L) conjugate in Can get signal solution 2. After three further washes in TBST, the membranes were exposed to ECL

TM

western blotting reagents and Chemi-Lumi One Ultra, respectively. The signals were detected by a luminescence imaging system (LAS-4000 mini, FUJIFILM Corporation, Tokyo, Japan). The intensity of the claudin- 4 band was corrected by the value obtained from the α-tubulin band as a loading control.

2.1.7 Evaluation of intestinal membrane fluidity in the presence of α-CD 2.1.7.1 Preparation of BBMVs

BBMVs were prepared from the rat intestine by a magnesium precipitation method.

25,26,61)

Briefly, after treated as described in the in situ closed-loop experiment, the whole small intestine

was removed and immersed in the ice-cold PBS (pH 7.4). The intestinal mucosa was collected

and homogenized in a homogenizing buffer (pH 7.4), which consisted of 12 mM Tris, 5 mM

EGTA, and 300 mM mannitol. The homogenate was added to 10 mM MgCl

2

, agitated for 15

min at 4 °C, and centrifuged at 3000 × g for 10 min at 4 °C. The supernatant was centrifuged

at 32000 × g for 30 min at 4 °C. The pellets collected from the second centrifugation were

suspended in the homogenizing buffer by a 27-gauge needle. The protein concentration was

adjusted to 0.1 mg/mL with HEPES-Tris buffer (25 mM HEPES, 5.4 mM KCl, 1.8 mM CaCl

2

,

0.8 mM MgSO

4

, 140 mM NaCl, and 5 mM glucose, pH 7.4 modified by 1 M Tris) using a BCA

(42)

30

Protein Assay Kit (Thermo Fisher Scientific Inc., Waltham, MA, USA) with BSA as the standard. This suspension was stored at -80 °C until use.

2.1.7.2 Measurement of intestinal membrane fluidity

To measure the intestinal membrane fluidity, BBMVs were labeled with fluorescent probes by incubating the BBMV suspension with 1 μM DPH, 0.5 μM tma-DPH, or 5 μM DNS-Cl at 37 °C in a dark place and the subsequent addition of 10, 20, and 50 mM α-CD in HEPES-Tris.

Cholesterol in BBMV suspension was used as a negative control. The fluorescence intensities of DPH and tma-DPH were detected with an excitation wavelength at 360 nm and emission wavelength at 430 nm, while that of DNS-Cl was measured with an excitation wavelength at 380 nm and emission wavelength at 480 nm, using a fluorescence spectrofluorimeter (F-2000 Spectrofluorimeter; Hitachi Seisakusho Corp, Yokohama, Japan). The fluorescence anisotropy (r) was calculated from the intensity measurements using the following equation:

r = (I

vv

- GI

vh

) / (I

vv

+ 2GI

vh

)

where I

vv

and I

vh

represent the fluorescence intensities perpendicular and parallel, respectively to the polarized excitation plane; G represents the compensating factor for the anisotropy sensitivity of the instrument, which was set as 1 in this study.

25,62)

2.1.8 Statistical analyses

All tests were analyzed in accordance with 1.1.7.

(43)

31 2.2 Results and discussion

2.2.1 Phase solubility study of CUR in CD formulations

As solubilizing agents, various CD solutions were used to improve the solubility of CUR by a sonication method. As indicated in Table 5, 50 mM DM-β-CD showed a highest solubilizing effect to improve the solubility of CUR. The solubility enhancement was related to the concentration of CDs with exception of γ-CD. The enhancing rank order of CD category was DM-β-CD > HP-β-CD > α-CD > β-CD. To understand the interaction between CD and guest molecule, the phase-solubility was studied based on Higuchi and Connors method.

63,64)

The phase solubility diagram was plotted using the solubility of CUR versus concentration of CD solution (Fig. 9). The A

L

-type phase solubility diagrams were observed with a linear slope (R >

0.96). Based on these slopes, the apparent stability constants (K

1:1

) of CUR-CD complexes were calculated as 2980, 4725, 33498, and 116855 M

-1

for β-, α-, HP-β-, and DM-β-CD, respectively.

In general, the solubilizing effects of the natural CDs on lipophilic compounds are dependent

on the size of their inner cavities. Since α-CD showed a superior solubilizing ability, the cavity

size of this CD is suitable to the entrapment of CUR molecule. In addition, the surficial

modification of β-CD surface by some moieties, such as methyl and hydroxypropyl groups, is

capable to raise the solubilizing activity in comparison to the parent. It is possible that chemical

modification to the parent CD may facilitate to form H-bond with guest molecules or to form

complex aggregates like micelles, resulting in an increase in the extent of drug complexation

and interaction.

64,65)

As to α-, β-CD, HP-β-CD, and DM-β-CD, they formed the complexes with

CUR in a first order stoichiometry of 1:1. These CDs could improve the aqueous solubility of

CUR in a concentration-dependent manner.

(44)

32 Group Content Solubility

(μM) Slope × 10

-3

Apparent stability

constant (K

1:1

) (M

-1

) ErS Control PBS 0.076 -- -- 1 α-CD 20 mM 11 0.3590 4725 145

50 mM 27 355

100 mM 36 474

β-CD 20 mM 4.7 0.2264 2980 62

50 mM 11 145

HP-β-CD 20 mM 28 2.5394 33498 368

50 mM 152 2000

100 mM 242 3184

DM-β-CD 20 mM 129 8.8028 116855 1697

50 mM 434 5711

γ-CD 20 mM 0.32 -0.0016 -- 4

50 mM 0.038 0.5

100 mM 0.022 0.3

(Table 1 in Int. J. Pharm. 2018, 535 (1-2), 340–349)

Table 5 Solubility of CUR in the presence of CD solutions

Table 2 Solubility of CUR in the presence of 1% NATs
Table  3  Pharmacokinetic  parameters  of  CUR  in  the  presence  of  1%  NATs  after  intestinal  administration to rats
Table 4 Estimation of bioavailability and absorption rate of CUR using a deconvolution method
Fig. 4. The activity of LDH released from the intestinal membrane in the presence of 1%
+7

参照

関連したドキュメント

Two grid diagrams of the same link can be obtained from each other by a finite sequence of the following elementary moves.. • stabilization

Standard domino tableaux have already been considered by many authors [33], [6], [34], [8], [1], but, to the best of our knowledge, the expression of the

The edges terminating in a correspond to the generators, i.e., the south-west cor- ners of the respective Ferrers diagram, whereas the edges originating in a correspond to the

H ernández , Positive and free boundary solutions to singular nonlinear elliptic problems with absorption; An overview and open problems, in: Proceedings of the Variational

Comparing the Gauss-Jordan-based algorithm and the algorithm presented in [5], which is based on the LU factorization of the Laplacian matrix, we note that despite the fact that

The inclusion of the cell shedding mechanism leads to modification of the boundary conditions employed in the model of Ward and King (199910) and it will be

Keywords: Convex order ; Fréchet distribution ; Median ; Mittag-Leffler distribution ; Mittag- Leffler function ; Stable distribution ; Stochastic order.. AMS MSC 2010: Primary 60E05

In Section 3, we show that the clique- width is unbounded in any superfactorial class of graphs, and in Section 4, we prove that the clique-width is bounded in any hereditary