Silk and Sakoku : a simulation analysis of industrial location in Edo period Japan
著者 ATSUMI Toshihiro
journal or
publication title
明治学院大学経済研究 = The papers and proceedings of economics
number 145
page range 101‑110
year 2012‑01‑31
URL http://hdl.handle.net/10723/1100
Abstract
Japan closed itself to international trade from the 17
thcentury to the mid-19
thcentury dur- ing the Edo period, known as the Sakoku. After the closure, industries dispersed from western coastal cities to inland areas in western and eastern Japan. This paper investigates how the Sakoku may have aff ected industrial locations within Japan by applying a footloose entrepreneur type ge- ography model to an economy with agricultural raw materials in a continuous space setting. The simulations based on this model show that agglomeration of industries such as silk fabric produc- tion in western coastal cities no longer become sustainable after the closure, and relocates to inland places forming new cities.
JEL Classifi cations: F12, L67, N95, R12
Keywords: International trade, economic geography, Japan
1.Introduction
Silk fabric production in Japan fi rst emerged in western ports which had better access to the Asian continent to import raw silk, because Japan at the time could not produce raw silk effi ciently on a commercial basis. The earliest silk fabric production sites include Hakata, Sakai and Kyoto
『経済研究』(明治学院大学)第 145 号 2012 年
Silk and Sakoku: a simulation analysis of industrial location in Edo period Japan
Toshihiro ATSUMI * Faculty of Economics, Meiji Gakuin University GEP, University of Nottingham
*
I would like to thank Rod Falvey and Daniel Bernhofen for helpful comments and suggestions. I also thank the participants in the seminar at the University of Nottingham. I am responsible for all remaining errors.
E-mail: [email protected]
which is also known as the fi rst case of industrial agglomeration in Japan.
However, the Tokugawa regime that came into power in the 17
thcentury decided on a policy of self-imposed isolation that lasted two centuries. The port closure in the late 17
thcentury resulted in the introduction of raw silk production in eastern Japan, where climate and mountainous land was not suitable for crops like rice. Following the isolation, the silk fabric industry dispersed to the east- ern inland regions, while Kyoto in the west also remained as a major silk fabric production site. New- ly developed silk fabric manufacturing sites in the east in this era include the city of Kiryu, which is known to have become a rival of Kyoto.
The silk fabric industry of Japan had experienced drastic changes in its environment: the fi rst phase can be characterized by silk fabric production based on imported raw materials; the first shock occurred in the late 17
thcentury when the ports were closed (phase 2); the second shock came in the mid- 19
thcentury when the ports were reopened and international trade in textiles started (phase 3). The aim of this paper is to explain the phase 1 geography and the transition to phase 2.
1This is done by applying a footloose entrepreneur type geography model developed by Forslid and Ottaviano (2003) to an economy with agricultural raw materials in a continuous space setting. By in- troducing continuous space, cities and hinterland within regions can be taken into account, which al- lows an analysis of economic geography at a fi ner level.
The analysis of cities and hinterland based on the new economic geography framework was developed by Fujita and Krugman (1995), which is known as the monocentric economy model. This paper also makes use of their idea of modelling a city as a manufacturing site in one dimensional con- tinuous space. However, it departs from their monocentric economy model in which the economy consists of one type of worker and a simple agricultural sector supplying agricultural goods to the city, by introducing skilled and unskilled workers who are mobile between sectors, or mobile be- tween the city and the hinterland, and the agricultural sector that produces raw materials in the hin- terland.
The evolution of cities and the system of cities have been investigated by researchers includ- ing Fujita and Mori (1997) and Fujita et al. (1999), based on the monocentric economy model. Their analyses demonstrate systems of cities created by exogenously increasing population. The focus of this paper is on the impact of external shocks such as the port closure, since population was stagnant in this era.
The main fi nding of this paper is that while providing feasible economic reasoning, the model can roughly simulate the changing location of the silk fabric industry in relation to the changing eco- nomic environment: agglomeration in the west as an initial equilibrium in phase 1, dispersion of silk
1
The geographic impact of the reopening of the ports in the mid-19
thcentury is analysed in Atsumi (2010).
fabric production to the eastern inland region in phase 2 during isolation.
This paper is organised in the following way. The next section presents the basic model and its application to the phase 1 geography. The initial equilibrium and the sustainability of the geo- graphic structure are examined. In Section 3 the impact of the port closure is analysed. Section 4 demonstrates a possible dynamic process that leads to the formation of a new geographic structure in phase 2 during the economic isolation in the Edo period. Section 5 concludes.
2.Explaining economic geography in phase 1
The economic geography of Japan in this era is modelled as in Figure 1, which is described in detail in the next subsection.
2.1 Basic assumptions
Goods, production technology, and market structure
There are three goods in the economy; diff erentiated silk fabrics and two homogeneous agri- cultural goods - raw silk for silk fabric production and food. Production of silk fabrics requires raw
Figure 1: The phase 1 geography
P P
Foreign Home
raw silk
food
eastern hinterland
east west
food
silk fabrics western hinterland
port h
Wh
Eport city
mountains
cultivated area:
P P
intra-regional
transport cost: e
τA Mde
τA Mdt
A,Mcity:
port: P
food
silk and two types of labour, skilled and unskilled. A fi rm producing a particular variety of silk fab- rics requires a fi xed number (α) of skilled workers and one unit of raw silk and β unskilled workers per unit output. The fi rm thus faces increasing return to scale. Its total cost for producing a given amount q
Mis then
c q
M=αw
S+ βw
U+p
Rq
M, (1)
where w
Sis the wage of skilled labour, w
Uis the wage of unskilled labour and p
Ris the price of raw materials. It is assumed that manufacturing fi rms are monopolistically competitive.
On the other hand, agriculture is a constant returns sector which uses only unskilled labour combined with land. Due to the climate diff erences between the east and the west, we assume that food production is less effi cient in the east. In other words, the east has a comparative advantage in raw silk while the west has a comparative advantage in food. Perfect competition is assumed for food production.
Geography and transport cost
There are two domestic regions, the east and the west. Transport costs exist between them and inter-regional transport can only take place through the two ports: goods cannot be shipped di- rectly to the other region from hinterlands or non-port cities. This assumption fi ts into a country like Japan where inland locations are mountainous, and so inter-regional transport took place between port cities on the coastline.
2Inter-regional transport cost is expressed in iceberg form, t (>1). An ice- berg transport cost of t implies that t units of a good needs to be shipped in order to supply a unit of the good to a destination. In other words, t−1 units are lost during transport. Transport costs for silk fabrics and agricultural goods (food and raw silk) can diff er with iceberg transport costs for silk fabrics and agricultural goods expressed as t
Mand t
A, respectively.
Further, one dimensional continuous space is introduced within regions in order to distinguish between cities, ports and hinterlands. Cities are defi ned as silk fabric production sites and can locate anywhere. This implies that in addition to the inter-regional transport costs t
M A, intra-regional trans- port costs, that is, the transport costs between the port, the city, and its hinterland are take into ac- count. The iceberg transport cost function of silk fabrics between locations with distance d is τ
M( d ) = e
δMd(δ
M> 0, d > 0). In particular, if the length of the hinterland is h
r(r=E, W) then the iceberg trans- port cost between the port and the frontier, or the edge of hinterland, will be e
δMh.
3Similarly, the ice-
⎝⎛ ⎝⎛ ⎝⎛ ⎝⎛
2
Ochiai (2007) describes the goods transported through the main ocean route between Osaka and Edo (current Tokyo), which includes basic food (such as rice), fabrics, soy sauce, sake, and vegetable oil. See also the map in Subsection 2.6.
3
h
ris variable depending on the size of agriculture in each region.
berg transport cost function for the agricultural goods, is τ
A( d )= e
δAd(δ
A>0, d >0).
Labour endowment
The population of unskilled workers in the country is normalized at one and that of skilled workers is denoted by S . This implies that the total mass of fi rms in the country is fi xed at S/α in equilibrium. It is also assumed that unskilled labour is evenly distributed between the east and the west.
4Therefore each region has half a unit of unskilled labour.
Introduction of land as a factor of production requires modelling owners of land or landlords.
However, following Fujita and Krugman (1995), the present analysis abstracts from modelling land- lords explicitly: landlords reside on the land they own and earn land rents from the unskilled work- ers who are cultivating the land. However, they are immobile and do not exist beyond the frontier.
5Consumer preference
All consumers have the same preferences, which are described by a two-tier utility function.
The upper tier is
U=M
μF
1−μ, 0 <μ< 1 (2)
which implies that the income shares of μ and 1−μ are allocated for silk fabrics ( M ) and food ( F ), re- spectively. The second tier dictates the consumersʼ preferences over the diff erentiated varieties of silk fabrics, which is defi ned as
(3)
where M is the composite of all the diff erentiated silk fabric varieties, n is the mass of silk fabric vari- eties, m ( i ) is the consumption of variety i , and ρ is the substitution parameter. 0 <ρ< 1 is assumed to ensure that the silk fabric varieties are imperfect substitutes. To represent the elasticity of substitu- tion between any two varieties of silk fabrics, σ=1/(1−ρ) (σ>1). Consumersʼ love-of-variety is stron- ger the smaller σ (or the smaller ρ).
By introducing a price index of silk fabrics
(4)
such that total expenditure on silk fabrics is GM , and denoting the price of food as p
F, indirect utility (or the real wage, ω) can be expressed as
( )
ρ ρ 1
0
= ∫
nM m i d i , 0 <ρ < 1
( )
1
0
= ∫
nG p i
1−σd i
1−σ4
The total population of the east and the west was nearly equal before the port openings in the late 19
thcentu- ry. (The west was slightly larger.) The east overtook the west after the port openings.
5
In other words, a landlord exists only when the land is used. They ʻdisappearʼ when the land they own is no
longer cultivated.
(5)
Labour mobility
As in the footloose entrepreneur model by Forslid and Ottaviano (2003), skilled workers are the only mobile factor between and within the regions. Following Krugman ( 1991 ), it is simply as- sumed that skilled workers move to the location that off ers them the highest real wages. Unskilled workers are not mobile between the regions but are mobile within the region they reside, and can be employed in either sector within the region, that is, they can either work in the city in the silk fabric sector or in the hinterland in the agricultural sector producing food or raw silk.
2.2 Specifi c assumptions in phase 1
Eastern natural conditions are less suitable for food production. Specifi cally, a unit of unskilled labour combined with a unit of land produces a unit of food in the west, while f
Eunits of unskilled la- bour and land are required to produce a unit of food in the east. f
E> 1 means that eastern food pro- duction is less effi cient compared to the west.
Raw silk is not produced domestically in phase 1: Japan exports food from the western port to the Asian continent to trade for raw silk.
6The only silk fabric production site is the western port, that is, there is only one city at the western port, where S/α silk fabric fi rms locate.
2.3 Firm behaviour and prices by location
Denoting the (mill) price of silk fabrics in the western port city as P
MPW, and the price of (im- ported) raw silk as P
RPW, if a fi rm sells quantity q
MPW, its profi t (value of sales minus variable and fi xed costs) is
p
MPWq
MPW− βw
UPW+p
RPW
q
MPW−αw
SPW. (6)
Then to maximize its profi t, the monopolistically competitive fi rm will set price as
(7)
The price (index) of silk fabrics at a location of distance d from the western port in the western hin- terland can be expressed as
1−μ
=
μ
ω =
F
j j
p G
w ( j U S , ) .
⎝⎛ ⎝⎛
1− 1 = + .
M
σ
p
PWβw
UPWp
RPW6
Japanʼs main exports in the 16
thand the 17
thcentury before the port closures were primary goods including
minerals such as silver (and later copper) and other miscellaneous goods such as sulphur, handicraft, rice,
wheat and dried seafood. It can be interpreted that these are included in ʻfoodʼ.
(8a) (Hereafter, a location of distance d from the port is called “location d ”.) In the eastern hinterland the price index at location d is
(8b)
2.4 Demand for goods by location Demand for food
Demand sources of food are the western port city and foreign, in addition to the demand from unskilled agricultural workers and landlords in hinterlands. Denoting aggregate income of the west- ern port city as Y
PW, food demand from the western port city is
(9)
Demand for silk fabrics
Demand sources of silk fabrics are the western port city and the farms in the hinterlands con- sisting of unskilled agricultural workers and landlords. Denoting farm income (the sum of unskilled agricultural workersʼ and landlordʼs income) of location d in the west and the east as Y
W(d) and Y
E(d), respectively, total demand for a typical variety of silk fabric, including inter-regional and intra-region- al transport costs, is
(10)
where G
MPW=G
MW(0).
Demand for raw silk
Total input demand for raw silk from the silk fabric fi rms in the western port city, given the output q
MPW, is D
RPW=n
Wq
MPW.
1−
M
W M
d
PWG ( ) ( ) d .
σ
1−
σ
=
1
τ
Mn
Wp
1−
M
E M
d
PWG ( ) ( ) d .
σ
1−
σ
7= t
1 M
τ
Mn
Wp
) (
F PW F PW
PW
p
Y
D μ
= 1−
.
( )
D
MPWp Y
M M M PW M
PW
( )
PW( )
G
Mμ
Y
Eμ
PW
−σ σ−1
σ−1
+
−σ=
s=0
∫
hEp t τ s G
ME( ) s ( ) s t
Mτ
M( ) s ds,
M M
PW
( )
−σμ Y
W+
0
∫
hwp τ s G
MW( ) s
−σ( ) s τ
M( ) s ds.
7
The mill price is further multiplied by t
Mto refl ect the inter-regional transport cost from the western port to
the eastern port.
2.5 Spatial equilibrium in phase 1
Equilibrium requires that all goods and factor markets clear, fi rms achieve zero profi ts, and the real wage of unskilled workers in the city and the real wages in the agricultural hinterland to be equalized in the west. These conditions lead to the following results.
The agricultural sector
Farm income. Perfect competition in food production implies marginal cost pricing. Then if the food price in the western port city is p
FPW, the income of a farm at location d in the west is Y
W(d)=p
F PWτ
A(d)
−1and income of a farm at location d in the east is Y
E(d)=p
F PWf
Et
Aτ
A( d)
−1. Food and raw silk are internationally traded and their prices at the western port, p
FPWand p
RPW, respectively, are given for Japan.
Market clearing of food. Food supply to the western port city from the western and eastern hin- terlands, except for their own consumption in the farms, should be equal to its total demand from the western port city and its exports to foreign (E
Ff):
(11)
Unskilled wage in the western port city
Unskilled workers are mobile within the region they reside. In addition, in the west they are mobile between the silk fabric sector in the western port city and the agricultural sector in the west- ern hinterland. The real wage of unskilled workers in the western port city is
(12)
and the real wage of agricultural workers in the western frontier, where the land rent is zero, is
(13)
Intra-regional and inter-sectoral mobility of unskilled workers imply that these are to be equalized in equilibrium. Therefore,
(14)
−1
μ
( ) f
s=0
∫
hw
s=0
∫
hE
μ τ
As d s + t
Aτ
A( ) s
−1d s = D
FPW+ E
F f( )
μ( )
ω
G p
1−μ=
U PW
M
PW F
PW U
w
PW,
( ) (
( ) )
( ) { }
( )μ
τ
ω = τ = .
−1
μ −1 1−μ
h
Wh
WM W
W A
A
τ
APW W
U W
p h
h
F
p
PWFp
PWFG G
WM( ) h
W( ) h
Wμ
W = .
τ
AU PW
p
PWFG
PWM( ) h
W( ) h
WM
G
WUnskilled labour market clearing
Full employment of unskilled workers require that the supply of unskilled workers for silk fabric production meets the demand from the fi rms in the western port city, that is,
(15)
where full employment of skilled workers implies n
W= S /α. The east does not have silk fabric pro- duction, so all eastern unskilled workers are employed in food production. Therefore h
E=1/2.
Skilled wages
In the silk fabrics sector, assuming free entry and exit, equilibrium skilled wage corresponding to their full employment is determined by a bidding process for skilled workers, which continues un- til no fi rm can earn a positive profi t at the equilibrium prices. This implies that in equilibrium a fi rmʼs size is such that the operating profi t exactly matches the fi xed cost which is the wage paid for the skilled workers. That is,
(16)
Substituting for p
MPWusing (7), the equilibrium skilled wage is
(17)
where the silk fabric market clearing requires q
MPW= D
PWM.
Balance of trade
The value of food export and raw silk import should be balanced:
P
EPWE
Ff= p
RPWD
RPW. (18)
2.6 Solution of the phase 1 model Parameter settings
A common set of parameters is used throughout the analysis to solve the model numerically.
Their values are μ=0.25, σ=6.6, β=0.03, t
M=1.5, and t
A=1.25.
8In order to extend the analysis to a continuous space setting as in Figure 2, the additional parameters to be set are the δʼs for the intra- regional transport cost functions, τ
M A(d). Since each region has half a unit of unskilled labour, the maximum length of the hinterlands are also 0.5 (when all unskilled labour is employed in the agricul- tural sector). It is assumed that δ
A=0.45 so that the iceberg transport cost of agricultural goods be-
− =
1 2
M PW
W W
h n β q ,
PWS U
PW M
αw = p
PWq
PWM− ( βw + p
PWR) q .
MPWPWS U
βw
PWα σ−1
PWR
( p
( )
) q
PWM= +
w ,
8
See Atsumi (2010) for the background information of these parameter values and further historical evidence.
The values of S and α do not aff ect geography. Therefore, S=1 and α=1 are used for the numerical solutions.
Figure 2: Inter-regional and intra-regional transport in Japan
Note: The Hokkaido island (region 1 in the map) was not well integrated to the mainland economy until the 20
thcentury. The southern part of regions 2 is considered as the peripheral areas (or the frontier) of eastern Japan.
7 11 10 20 23 21 24
30 30
33 32
1
2 2 2
2 3 3
4 6 5
7 8 9 11 10
12 13 15 14
17 16 18 20 19 21 22
23 25 24 27 26 28
30 29 30 31 33 32
34 35 37 36
Kyoto/Osaka
Kiryu
West t
M, t
Ainter-regional transport
(Osaka-Edo route)
East
intra-regional transport(West)
intra-regional transport(East)
Edo(Tokyo)
The Kansai region
and its hinterland The Kato region
and its hinterland τ
M(d),τ
A(d)
τ
M(d),τ
A(d)
0 d
1.5
1.4
1.3
1.2
1.1
1 0 0.1 0.2 0.3
distance from the port
0.4 0.5
τ
M(d),τ
A(d)
τ
M(d)=e
0.8*dτ
A(d)=e
0.45*dFigure 3: Intra-regional transport cost function
tween the port and the frontier of the hinterland within each region is at most τ
A(0.5)= e
0.45*0.5㲓1.25.
This assumption is used because according to a survey by Dainihon Sanshi Kai (The Silk Industry Association of Japan) (1935), the delivered price of raw silk from the city of Maebashi, located in the North end of the Kanto region in eastern Japan, to Yokohama port was on average around 20% high- er than the price at the origin during the period 1859 to 1867. As for the intra-regional transport cost of manufactured goods, it is assumed that the transport cost (loss) is twice compared to that of the agricultural goods. Therefore, δ
M=0.8 so that τ
M(0.5) = e
0.8*0.5㲓 1.5. The intra-regional transport cost functions for agricultural and manufactured goods are graphed in Figure 3.
Numerical solution
The model is solved choosing food at the western port as the numeraire, that is p
FPW=1. Solu- tions of the main endogenous variables for diff erent levels of the eastern food productivity (f
E) and the port price of imported raw silk ( p
RPW) are shown in Table 1. It can be seen that higher productivi- ty of food in the east and/or lower relative price of raw silk leads to higher wages and real wages. In addition, lower relative price of raw silk leads to a smaller western hinterland. This is because the silk fabric industry in the western port city expands and employs more unskilled workers from the western hinterland.
Table 1: Solution of the phase 1 model for diff erent levels of eastern food productivity (f
E) and imported raw silk price (p
RPW)
f
E=1 f
E=2 f
E=3
p
RPW=2
p
RPW=1
p
RPW=0.25
p
RPW=2
p
RPW=1
p
RPW=0.25
p
RPW=2
p
RPW=1
p
RPW=0.25 w
SPW0.03173 0.03174 0.03177 0.02468 0.02469 0.02471 0.02233 0.02234 0.02236
w
UPW0.8560 0.8567 0.8605 0.8559 0.8564 0.8594 0.8558 0.08563 0.08590
P
MPW=G
MPW2.387 1.209 0.325 2.387 1.209 0.325 2.387 1.209 0.325
h
W0.497 0.495 0.481 0.498 0.496 0.485 0.498 0.496 0.486
ω
SPW0.0255 0.0302 0.0421 0.0196 0.0235 0.0327 0.0180 0.0213 0.0296 Note: f
E> 1 implies that the eastern food production is less effi cient than to that of the west. See Subsection 2.2.
Since this is a continuous space geography model, it is useful to express the equilibrium prices
of diff erent locations in the following “price schedule” form; Figures 4a and 4b show the prices of food
and silk fabrics, respectively, of all domestic locations for the f
E=3 case. Figure 4a indicates that the western port city, where food from the eastern and western hinterlands were shipped to, has the highest food price. The gap between the western port price and the eastern price refl ects both the transport cost and the productivity diff erence. Figure 4b indicates that, since silk fabrics were only produced in the western port city, its price in the city is lowest and prices for the consumers in the eastern hinterland were high because of the inter-regional transport cost.
2.7 Sustainability of the western port city
The market potential functions are defi ned and are evaluated for all values of d
<―h
r( r = E, W ) using the results from the numerical solution in Table 1. They indicate under what conditions the geography with a single western port city can be sustainable.
The geographic structure with a single port city in the west can be considered sustainable 1
&
0.4 0.3 0.2 0.1 0 d
0.2 0.4 0.6 0.8 1
0 0.1 0.2 0.3 0.4 d
west
(producers)
east
(producers)
port city
port
agricultural wage land rent
earned price by eastern farmers transport cost
&
productivity difference earned price by western farmers
agricultural wage
distance from port distance from port
p
FPW=1
consumers land rent p
FPW(e
τAd)
−1p
FPW( f
Et
A)
−1p
FPW(f
Et
Ae
τAd)
−1Figure 4a: Equilibrium price schedules of food in phase 1 with f
E= 3 and p
WR= 1
0 0.1 0.2 0.3 0.4 d
0.4 0.3 0.2 0.1 0
0.3 0.4 0.5 0.6 0.7 0.8 0.9 1
port city
port transport cost
west
(consumers)
east
(consumers)
ditance from port distance from port
consumers/producers p
MPWe
τMdp
MPWp
MPWt
Me
τMdp
MPWt
MFigure 4b: Equilibrium price schedules of silk fabrics in phase 1 with f
E= 3 and p
RPW= 1
when no location has a market potential exceeding unity, because this indicates that no location is more profi table than the city, and that no fi rm has an incentive to leave the city.
The market potential function of the west
Given the equilibrium prices, fi rms calculate hypothetical profi ts (the operating profi t minus fi xed costs of locations other than the city), that is,
(19)
where p
RW( d ) is the price of raw silk at location d in the west,
(20a)
(20b)
and
(20c)
(20a) is the unskilled workersʼ wage at location d in the west. This is refl ected in (20b) which means that the hypothetical mill price at that location will be based on the unskilled wage and the price of raw silk at that location. The hypothetical demand shown in (20c) is therefore based on this hypo- thetical mill price.
The hypothetical fi xed cost of operating at location d in the west is αw
SE(d), where
(21)
is the hypothetical skilled wage compensated for the changes in the living cost of relocating to loca- tion d . The market potential function in the west is defi ned as
(22)
M
W U
W W
~ ~
π ( ) d = p ( ) d D ~
MW( ) d − βw ( ) d + p
RW( ) d D ~
WM( ) d ,
M
G
W MG
PW Fp
PW μμ A U
W
( ) d = w
PWU,
(1−μ)
1−μ
(
(
)
) ( p
FPW)
d τ ( ) d w
−1
( ) d =
M
~ p
Wσ−1 βw
WU( ) d + p
WR( ) d , σ
⎩ ― ⎨ ― ⎧
=
× +
+
.
−σ
σ−1 σ−1
σ−1 1−σ
1−σ
1−σ
μ ~
MW( ) d
( ) d
( ) d ( ) s ( ) s ( ) s ( ) s
d − s p
PW PW
( G
M)
Y Y
EM
τ
Wτ
Mt
Mτ
Mτ
M( ) d
M W
D ~
( ) s ( ) ds
ds
M
G
W MG
E⎩ ― ⎨ ― ⎧
s=0
∫
hWs=0
∫
hEY
〜
M
G
W MG
PW Fp
PW μμ A S
W
( ) d = w
SPW(1−μ)
1−μ
(
(
)
) ( p
FPW)
d τ ( ) d w
−1
~
W S
W
=
W.
( ) d π ( ) d Ω
~
( ) d
αw ~
The market potential function of the east
The hypothetical operating profi t at location d in the east is
(23)
where p
RE( d ) is the price of raw silk at location d in the east,
(24a)
(24b)
and
(24c)
The hypothetical fi xed cost of operating at location d in the east is αw
SE( d ), where
(25)
is the hypothetical skilled wage compensated for the changes in the living cost of relocating to loca- tion d. The market potential function of location d in the east is defi ned as
(26)
The city is sustainable if Ω
E( d )
<―1 and Ω
W( d )
<―1 for all d , because otherwise fi rms decide they can leave the western port city and profi tably move to other locations.
The calculated market potentials of all locations for diff erent levels of the eastern agricultur- al productivity ( f
E) are shown in Figure 5a for the east and in Figure 5b for the west. Figures 6a and 6b show the market potentials for diff erent levels of the port price of imported raw silk ( p
RPW), fi xing the level of f
E. They indicate that the geography with a single port city in the west is sustainable in phase 1 if agricultural (food) productivity of the east is suffi ciently lower than the west and/or if raw silk is suffi ciently expensive relative to food. Low food productivity in the east is consistent with the historical understanding that the natural condition of eastern Japan (particularly in mountainous
M
E U
E E
~ ~
π ( ) d = p ( ) d D ~
ME( ) d − βw ( ) d + p
RE( ) d D ~
ME( ) d ,
( ) d =
M
~ p
Wσ−1 βw
UE( ) d + p
RE( ) d , σ
M
G
E μU
W
( ) d = p
FPWf t
E Aτ
A( h
E) ,
1−μ
( ) d
M
G
E( h
E)
( h
E) τ
Aτ
Aw ( ) d
−1
=
+
× + .
−σ
σ−1
σ−1
σ−1 1−σ
1−σ
μ ~
ME( ) d
( ) d
( ) s ( ) s
( ) s ( ) s
d p
PW
( G
PWM)
Y
Y
EM
W
τ t
Mt
Mτ
Mτ
M( ) d
M E
D ~
( ) s ( ) ds
M
G
WM
G
E⎩ ―― ⎨ ―― ⎧ ⎩ ―― ⎨ ―― ⎧
s=0
∫
hW
s=0
∫
hEY
1−σ
d − s τ
M( ) ds
〜
M
G
E MG
PW Fp
PW μμ A S
E
( ) d = w
SPW(1−μ)
1−μ
(
(
)
) ( p
FPW)
d t τ
A( ) d w
−1
~
E S
E
=
E.
( ) d π ( ) d
Ω ~
( ) d
αw ~
places) was not suitable for crops like rice and that the farmers there were poor before the introduc- tion of sericulture.
The result can be interpreted as follows. The western port is the best location in terms of raw silk cost. However, it is not necessarily the best location for supplying silk fabrics for (domestic) con- sumers because in this era Japanese silk fabrics were not exported. If the eastern agricultural tech- nology is high, which implies higher agricultural income, fi rms in the western port may fi nd profi t- able locations in the east, because it is advantageous to supply to the eastern market (as in the f
E=1 or the f
E=2 cases in Figure 5a). The eastern regions are, however, understood to have been inferior in agricultural productivity due to natural conditions. Therefore, the east was not as attractive as the western port which had the best access to imported raw materials; under low food production tech- nology in the east and/or high raw silk price, it is likely that the economic geography with a single western port city was sustainable in phase 1 as in the f
E=3 case shown in Figures 5a and 5b.
0.1 0.2 0.3 0.4
0.4 0.6 0.8 1.2 1.4 1.6 Ω
E(d)
d f
E=1
f
E=2
f
E=3 port
western port city is sustainable Figure 5a: Market potential of the east in phase 1 (p
RPW=1)
0.1 0.2 0.3 0.4
0.9 0.8 0.7 0.6 0.5 0.4 Ω
W(d)
d
f
E=1 f
E=2
f
E=3 port city
Figure 5b: Market potential of the west in phase 1 (p
RPW=1)
3.The impact of the port closures in the late 17
thcentury on the phase 1 geography
The port closures in the late 17
thcentury implied a total loss of raw silk supply. Following the closure, domestic production of raw silk started in the east, which had a comparative advantage in raw silk production due to the diff erences in the natural conditions. This section considers the impact of the port closure and the resulting domestic raw material production on the phase 1 geography with a single western port city. It investigates whether the single city in the western port is still sus- tainable under the change in the environment (Figure 7).
0.1 0.2 0.3 0.4
0.9 0.8 0.7 0.6 0.5 0.4 1.1 Ω
E(d)
port d
western port city is sustainable p
RPW=0.25
p
RPW=1
Figure 6a: Market potential of the east in phase 1 (f
E=3)
0.1 0.2 0.3 0.4
0.9 0.8 0.7 0.6 0.5 Ω
W(d)
port city d
p
RPW=0.25 p
RPW=1
Figure 6b: Market potential of the west in phase 1 ( f
E=3)
3.1 Modifi cations of the model to account for port closure and domestic raw material production Geography and transport cost
There is no international trade due to the port closure. The same domestic transport cost as- sumptions are maintained.
Goods, production technology, and market structure (introduction of raw silk production)
It is assumed that food productivity in eastern Japan is so low that the eastern agricultural sector specializes in raw silk production after the port closure.
9The production technology of raw silk is that a unit of unskilled labour combined with a unit of land produces a unit of raw silk. Perfect competition prevails for raw silk production as well as for food in the west.
103.2 Sustainability analysis of the phase 1 geography with port closure Numerical solution
The model is fi rst solved numerically, assuming the same exogenous parameters used in the Figure 7: The phase 1 geography after the port closure (late 17c)
P P
eastern hinterland
east west
food
silk fabrics
raw silk
no international trade western hinterland
port h
Wh
Eport city
mountains
cultivated area:
P P
e
τA Mde
τA Mdt
A,Mcity:
port: P
9
The necessary condition for eastern Japan to specialize in raw silk is 1/f
Et
Ae
τAd<p
RPE/ e
τAdor 1 < p
R PEt
Af
E. f
Eis as-
sumed to be high enough so that this holds.
10
Formal description of the model is available from the author upon request.
previous section, to obtain the equilibrium values of the endogenous variables (Table 2 ). They will then be used in evaluating the market potential functions.
Table 2: Solution of the phase 1 geography with port closure
w
SPW0.222
w
UPW0.858
p
RPE0.257
P
MPW(=G
MPW) 0.409
h
W0.489
ω
SPW0.0277
Note: Food at the western port city is chosen as the numeraire ( p
FPW=1).
The equilibrium price schedules of phase 1 with port closure based on the results in Table 2 are shown in Figures 8a, 8b and 8c. Figure 8a is the food price schedule. Since food is now only pro- duced in the west, prices in the east are generally higher than in the west because of the transport costs. Figure 8b is the price schedule of raw silk. After the introduction of raw silk production in the east, its price is lowest in the eastern frontier. Silk fabric producers in the western port city bear the transport cost to purchase raw silk from the east. Figure 8c is the price schedule of silk fabrics. Silk fabric production is agglomerated in the western port city, where its price is lowest. Silk fabric pric- es are generally higher in the east because of the inter-regional transport cost. It can be foreseen from these results that the east is now potentially an attractive place for silk fabric production, given the low raw silk cost and the high current prices of silk fabrics, although food is expensive in the east.
Figure 8a: Equilibrium price schedules of food with port closure
d
west
(producers)
east
(consumers)
land rent
transport cost earned price by western farmers
agricultural wage
distance from port distance from port
consumers
0.4 0.3 0.2 0.1 0
0.6 0.8 1 1.2 1.4 1.6
0 0.1 0.2 0.3 0.4
port city
port p
FPW(e
τAd)
−1p
FPWt
Ap
FPWt
Ae
τAdp
FPW=1
Market potentials of the phase 1 geography with port closure
The market potentials of the phase 1 geography with port closure are shown in Figure 9a for the east and in Figure 9b for the west.
11Figure 9a clearly indicates that every eastern location is more profi table than the western port city since the market potentials exceed unity. Therefore, with port closure, the phase 1 geography becomes unsustainable. This is because the advantage of the low raw silk price in the eastern hinterland outweighs the disadvantage of the inferior market access to the existing western port city and the western hinterland from the east. In particular, fi rms calculate that the inland location d =0.45 in the east, indicated in Figure 9a, exhibits the highest market poten- tial. It is likely then that the fi rms leave the western port city and a new manufacturing city emerg- es in the eastern inland sericulture region.
Figure 8b: Equilibrium price schedules of raw silk with port closure
d
east
(producers)
west
agricultural wage land rent
earned price by eastern farmers transport cost
silk fabric producers raw silk cost*
distance from port distance from port
0.4 0.3 0.2 0.1 0
0.1 0.2 0.3 0.4
0 0.1 0.2 0.3 0.4
port city
port
p
RPE(t
Ae
τAd)
−1p
RPEt
Ap
RPEFigure 8c: Equilibrium price schedules of silk fabrics with port closure
west
(consumers)
east
(consumers)
consumers/producers
d transport cost
distance from port distance from port
0.4 0.3 0.2 0.1 0
0.4 0.5 0.6 0.7 0.8 0.9
0 0.1 0.2 0.3 0.4
port city
port p
MPWe
τMdp
MPWp
MPWt
Me
τMdp
MPWt
M11
The market potential functions are available from the author upon request.
Figure: 9a: The eastern market potential of the phase 1 geography with port closure
hinterland(distance from the port)
highest market potential
(d=0.45)
0.1 0.2 0.3 0.4
0 5 10 15 20 25 30 35 Ω
E(d)
port d
Figure: 9b: The western market potential of the phase 1 geography with port closure
hinterland(distance from the port)
0.1 0.2 0.3 0.4
0.9 0.8 0.7 0.6 Ω
W(d)
port city d
4. A Possible dynamic process of the transition from the phase 1 to the phase 2 ge- ography
The market potentials of the phase 1 geography with port closures shown in Figures 9a and
9b indicated that location d =0.45 in the east is potentially most profi table from the viewpoint of silk
fabric fi rms that are agglomerated in the western port city. It is likely that the profi t maximizing
fi rms with the skilled workers who are mobile between regions relocate to this eastern inland loca-
tion to start production. This section considers a possible transition process from the phase 1 geogra-
phy to the formation of a new geographic structure in phase 2, the economic isolation period of Ja-
pan.
4.1 The migration process
To take into account the changes in the market potentials over time, the market potential of region R ∈{ E, W } at time t from the viewpoint of silk fabric fi rms in region Z ∈{ E, W } is denoted as Ω
ZR t( d ). Ω
WE 0( d ) and Ω
WW, 0( d ) correspond to Figures 9a and 9b, respectively.
Skilled workers are mobile both inter-regionally and intra-regionally. On the other hand, un- skilled workers are only mobile within the region they reside. In the hinterlands, they are food farm- ers in the west or raw silk farmers in the east. But if there is a city in the region, they can move to the city to be employed by the silk fabric fi rms. In order to account for inter-regional and intra-re- gional migration of the fi rms and skilled workers, a sequential migration process through which the fi rms with their skilled workers migrate away from the western port city to the (new) eastern city is introduced:
・ λ = cλ ( π
CE− π ) , (27) where c is a positive constant denoting the adjustment speed, π
CEis the profi t at the eastern city, and −= π λπ
CE+ (1−λ) π
CWis the average profi t. This simply means that the rate of change in the re- gional share of fi rms and skilled workers is proportionate to the diff erence in the profi ts.
12Since there are no fi rms in the east initially, it is assumed that a fraction of fi rms and their skilled workers migrate from the western port city to location d=0.45 in the east which is the most profi table location according to the market potential of the east at t =0.
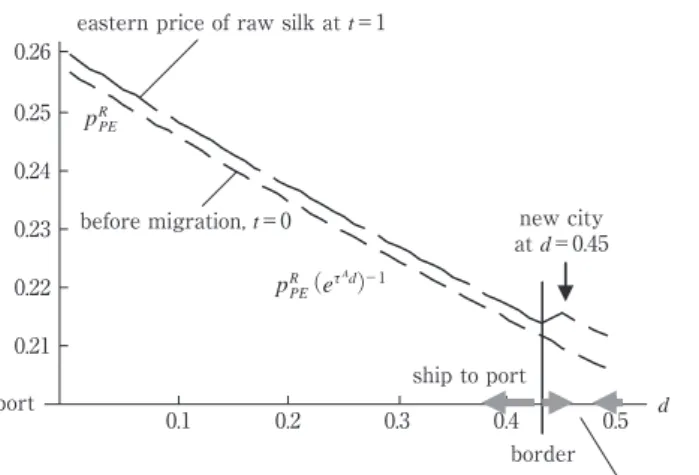
13At t = 1 after the fi rst wave of the inter-regional migration, production is newly set up at location d=0.45 in the east, to which the eastern unskilled workers respond: some will be employed by the new silk fabric fi rms; those who remain in the agricultural sector can now ship their raw silk to the new (small) city to supply the new silk fabric fi rms, resulting in changes in the prices. Given the price changes, silk fabric fi rms, both in the east and in the west, re-evaluate their market potential functions. They will now have re- vised market potential functions, Ω
EE, 1( d ) and Ω
WW, 1( d ), respectively. According to the revised market potential functions, it is assumed that the fi rms with their skilled workers migrate intra-regionally, if there is a more profi table location within each region. That is, in the east, silk fabric fi rms and their skilled workers (or the city) moves to location d
*if it satisfi es Ω
EE, 1(d
*)=maxΩ
EE, 1(d) >Ω
EE, 1(0.45). The same also occurs in the west if Ω
WW, 1( d
*)=maxΩ
WW, 1( d ) >Ω
WW, 1(0). Unskilled workers respond again by changing the direction of their shipment of agricultural goods, if the city location changes.
Given the (new) location of the two cities and the profi ts of silk fabric fi rms in these cities, the
12
One reason for introducing a gradual migration process is because ʻall at onceʼ migration to form a new single city does not result in a sustainable geography. The other reason is that there is a range of locations within which a sustainable two city geography exists.
13
See Figures 9a and 9b.
next wave of inter-regional migration of fi rms and skilled workers occurs according to the inter-re- gional migration equation. The economy then proceeds to t =2 for the next intra-regional adjustment and migration. In this way, inter-regional and intra-regional migration occur sequentially until there is no further incentive for any migration.
4.2 A two city model
In addition to the migration process specifi ed in the previous subsection, a model with two cit- ies is necessary, in order to simulate the transition from the phase 1 to the phase 2 geography. A two city geography as in Figure 10 is modelled, allowing for a city in each region which can exist in locations other than the port. One complexity that arises from allowing for a non-port city is the di- rection of the agricultural goods shipment: as indicated in Figure 10, there exists a border that di- vides farms shipping products to the city or to the port.
14Given the prices in the port and the city, farms can now choose where to send their products depending on their location.
Solution
During the course of migration, the model is solved for a given level of λ to derive the silk Figure 10: A model of two cities
P P
eastern hinterland
east
border city
west
food
silk fabrics
raw silk
raw silk shipped to the inland city
raw silk shipped to the port
no international trade western hinterland
port h
Wh
Eport city
mountains
P P
e
τA Mde
τA Mdt
A,Mcultivated area:
city:
port: P
14