How the sunk costs of incumbents make entrants important for innovation: a model and implications for policy
Dimitry Rtischev
Abstract
The paper clarifies how sunk costs can lead a rational incumbent to innovate less than an entrant. It also demonstrates that competition among incumbents yields less adoption of new and more efficient production technology than competition which includes entrants. The results suggest that policy promoting adoption of next-generation production technology should distinguish among firms based on their sunk costs in current-generation technology and encourage entry by industry outsiders such as startups or firms from other industries.
Keywords: cost-reducing innovation, R&D competition, sunk costs, entry, innovation policy JEL codes O31, L13, L52
1. Introduction
Consider a policy that aims to accelerate development of next-generation technology in a given industry. Using a variety of instruments such as grants, subsidies, tax benefits, and patents, the policy encourages firms to invest in research and development (R&D). The question arises, which firms should the policy target? Does it matter for innovation performance whether the R&D competition includes only industry incumbents or whether it also includes newcomers such as newly formed ventures or entrants diversifying from other industries? Answering these questions is important because, innovation performance being equal, it would be preferable for the policy to focus on incumbents rather than take on the more expansive and risky task of promoting entry. One reason for this is ease of implementation:
because the set of incumbents is typically a known, finite set of firms, it is much easier to deal with just the incumbents as compared to qualifying and interacting with an indefinite number of potential entrants.
Another reason is that industry entry often goes hand-in-hand with industry exit, and such turnover of firms typically dislocates workers and entails costly redeployment or duplication of assets.
A prominent example of policy that relied on competition among incumbents is Japanʼs post-war industrial policy, which generated impressive R&D performance in semiconductors and other industries by working long-term with a stable but highly competitive set of incumbents. (Okimoto, 1989) At the
opposite extreme is the venture-capital / Silicon Valley system of innovation, which enshrines the startup venture as an indispensable catalyst of innovation and thrives on displacing incumbents. A less extreme case is entry not by newly organized firms but by established firms from other industries. In Japan, for instance, interindustry competition has catalyzed development of optical fiber and interindustry collaboration has led to technology fusion underlying the successful development of the mechatronics and optoelectronics industries. (Kodama, 1995) These examples suggest that although lacking entrants may not preclude innovation, having entrants may help. Although far from being conclusive, this observation casts some doubt on the sufficiency of an incumbent-centric innovation policy.
Further evidence that incumbents may innovate less well than entrants is found in management scholarship on the interplay of technology and organization. That scholarship characterizes some technological discontinuities as “competence-destroying” or “disruptive” and argues that incumbents have organizational difficulties espousing such technologies. (Anderson and Tushman, 1997; Henderson and Clark, 1990; Christensen, 1997) In this vein, Fosterʼs (1986) and Christensenʼs (1997) book-length accounts of the “attackerʼs advantage” and “innovatorʼs dilemma,” respectively, detail many instances of incumbents over-allocating resources to incrementally improve their existing businesses at the neglect of paradigm-shifting innovation needed to survive technological discontinuities. In other words, incumbentsʼ investment behavior seems to be constrained by sunk costs in and on-going benefits from current-generation technology, in contrast to entrants who appear free to pursue next-generation technology without such constraints. The management literature interprets this as a mistake and searches for organizational solutions to give incumbents the same flexibility as enjoyed by entrants. The upshot for innovation policy is that unless policymakers trust that incumbents can overcome their organizational impediments, itʼs best to take a pro-entry stance.
This paper goes further to provide a firmer basis for pro-entry innovation policy. The paper shows that sunk costs in current-generation technology is a sufficient condition for an incumbent to rationally pursue next generation technology to a lesser extent than an entrant. Sunk costs are at the heart of what distinguishes incumbents from entrants. However sunk costs are not supposed to affect rational decisionmakers seeking to maximize future profits. After all, every business school graduate must have heard about the sunk-cost fallacy. This paper resolves this apparent paradox by providing a theoretical basis for how sunk costs make incumbents rationally innovate less the entrants. It then applies the theory to qualify the differences in innovation performance generated by incumbent-only competition vis-a-vis competition which includes entrants.
The theory leads to an unusual view of the incumbent: rather than being unfavorably constrained by its past, the incumbent possesses a comparative advantage over entrants in the form of an option to operate the old way on terms more favorable than those available to newcomers. Moreover, the theory shows that there are conditions under which the incumbent rationally chooses to exercise this “status quo” option whereas the entrant rationally chooses to innovate. Furthermore, the theory demonstrates that entrants spur innovation in the sense that competition between incumbents alone is less prone to generate innovation than competition that includes an entrant. Thus, an industry that regularly pits incumbents against entrants is likely to generate more innovation than a similarly concentrated industry comprised of a stable set of competing firms. Echoing Schumpeterʼs (1950, p. 84) famous assertion that
the relevant problem is not “how capitalism administers existing structures … [but] how it creates and destroys them,” these findings provide a theoretical basis for why innovation policy should promote entry rather than rely on competition among incumbents.
2. Framework for analysis
Our unit of analysis will be a firm that develops a production technology and then uses it to manufacture goods for sale. The firm makes a one-time upfront investment to carry out R&D and build the production facilities. After the development phase, the firm manufactures the goods, sells them in an output market, and earns a certain per-period profit. The profit depends on production costs, demand, and competition.
Our analytical framework has two periods and two firms: an incumbent which operates in periods 1 and 2 and an entrant, such as a newly organized firm or an existing firm from another industry, which operates only in period 2. The only difference between the incumbent and the entrant is that the former has sunk an investment into an “old technology” in period 1 whereas the latter has not. The decision of interest is the period 2 technology choice by the incumbent and the entrant, each of which can adopt a new technology that has emerged after period 1 as an alternative to the old technology. Specifically, the decision for the entrant is whether build its factory with the new or the old technology; the decision facing the incumbent is whether to continue producing with the old factory in period 2 or build a new one.
This framework parsimoniously captures several essential features of technology choice by incumbents and entrants and will allow us to derive insights about the differences in innovation behavior of firms and innovation performance of industries. We will proceed by considering the set of all possible new technologies (hereinafter referred to as “innovation projects”) and examining the relationships among the following four collectively exhaustive subsets:
1. Innovation projects that only an entrant undertakes 2. Innovation projects that only an incumbent undertakes 3. Innovation projects that both undertake
4. Innovation projects that neither undertakes
By comparing these subsets, we will be able to characterize the relative propensity to innovate by incumbents and entrants, and contrast the innovation performance of various competition regimes.
We will make the assumption that each firm can operate only one technology in period 2, either new or old. This assumption permits focus on the tradeoff between innovation and the status quo, but biases results towards portraying a starker difference than what is likely to be observed in settings where straddling the old and the new is possible. Although this “no-straddling” assumption oversimplifies reality, arguably, it is representative of a significant fraction of actual circumstances since firms often face financial and self-consistency constraints that preclude them from simultaneously pursuing the old and the new.1)
1) In the context of business innovation, Porter (1996) and (Christensen, 1997, pp. 112-5) discuss the need to have a
3. Are entrants more likely to innovate than incumbents?
Before we can characterize the effect of entry on industry innovation performance, we need to first characterize differences in innovation behavior of incumbents and entrants. It is helpful to begin analysis with the case of no competition and then add competition.
3.1 No competition
There are two identical monopolists, each facing an output market for its product. The markets are identical but completely isolated from each other by some trade barrier such as geography or regulation.
In period 1, one of the monopolists invests K > 0 to develop the only available technology at that time;
the other monopolist is not active in period 1. The technology allows production characterized by cost parameter k > 0. 2) The first monopolist undertakes production with the technology, sells the output, and earns Πk in profit (gross of the investment K). In period 2, the first monopolist can persevere, using the technology it has already developed to again earn Πk without any additional investment.3) Alternatively, in period 2 it can invest R > 0 to develop a new technology, which allows more efficient production at unit cost r < k. If the monopolist produces with the new technology and sells the output, it will earn Πr
in profit in period 2 (gross of the investment R). Both technologies produce identical goods but the new technology is more efficient, which under standard assumptions implies that Πr > Πk.4)
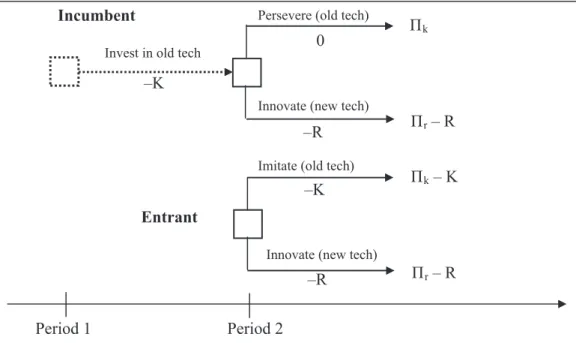
The second monopolist enters in period 2 by either imitating the first monopolistʼs first period technology or investing in the new technology. Like the first monopolist, it can invest either K or R to develop the old or new technology, respectively, and will earn either Πk or Πr in profit upon selling the products in its own output market.5) Figure 1 shows the decision trees for the two monopolists. We will refer to period 2 outcomes in terms of who innovates using the following notation (see Table 1):
EO−Entrant Only: entrant chooses new technology, incumbent stays with old IO−Incumbent Only: incumbent chooses new technology, entrant chooses old BT−Both: entrant and incumbent choose new technology
NT−Neither: entrant chooses old technology and incumbent stays with old technology
coherent strategy as a reason why firms are sometimes unable to operate new and old business models in parallel and are forced to choose only one.
2) As is common in the economics literature on innovation (see Tirole, 1988), I conceive technology as process technology and characterize it in terms of a cost parameter which represents the unit cost of production enabled by the technology.
3) To simplify analysis, I do not explictly discount period 2 cash flows relative to period 1. Adding such discounting to the model does not lead to any substantive changes. Period 2 profit can be interpreted as the discounted present value of a long stream of profits.
4) In addition to the case of r<k treated here, another conceivable case, not pursued here, is the case of r>k and R<K.
This corresponds to a new technology that is less efficient to produce with but cheaper to develop or setup. In such a case, the incumbent would not invest in the new technology under any circumstances but the entrant might. However, if we view period 2 profits as the present value of a long-term profit stream that follows development, it is difference in per-unit costs rather than upfront investment that is likely to drive the technology choice decision.
5) To guarantee that entry occurs, I assume that investment in technology K can be recouped in one period: Pk > K.
At the start of period 2, the incumbent (first monopolist) has vested interest in old technology and the entrant (second monopolist) does not. From the decision trees in Figure 1, it follows that the entrant innovates if and only if
Πr−R > Πk−K (1)
whereas the incumbent innovates if and only if
Πr−R > Πk. (2)
Being a forward-looking profit-maximizer, the incumbent avoids the sunk-cost fallacy by ignoring its sunk cost K. However, K indirectly makes the incumbent relatively more conservative by affecting the entrantʼs decision. The entrant compares the gain from innovation to the gain from imitation, net of technology investment, whereas the incumbent compares the gain from innovation, net of investment in new technology, to the pure gain from persevering (without subtracting from that gain the sunk investment in old technology). This fundamental difference in the calculus employed by the incumbent and the entrant implies that there are innovation projects that an entrant would pursue but an incumbent Figure 1. Decision trees for the incumbent and the entrant. Payoffs shown are for the second period only.
–K
–R
Π
kΠ
r– R
–R
Π
k– K
Π
r– R –K
Period 1 Period 2
Entrant Incumbent
Innovate (new tech)
Innovate (new tech) Persevere (old tech)
Imitate (old tech)
Invest in old tech
0
Table 1. Notation for designating period 2 outcomes Entrant’s technology choice
Old New
Incumbent’s technology
choice
Old NT EO
New IO BT
would not, and not vice versa.
More formally, for a given old technology (k, K), the set of innovation projects that an entrant alone undertakes without competition with the incumbent is:
EO(k, K) = {(r, R) : Πr−Πk < R < Πr−Πk+K} (3)
The other three sets of interest are:
IO = ∅ (4)
BT(k) = {(r, R) : R < Πr−Πk} (5)
NT(k, K) = {(r, R) : R > Πr−Πk+K} (6)
Result 1 and the Venn diagram in Figure 2 summarize these results.
Result 1. In the absence of competition, an incumbent is more conservative than an entrant in the sense that there exist innovation projects which only an entrant pursues but there do not exist innovation projects which only an incumbent pursues.
3.2 Duopoly
Let us now add competition to the model. Instead of two monopolists selling in isolated output markets, let the firms be duopolists competing in a single output market in period 2. As before, each firm must decide which technology to use in period 2: an old technology parameterized by (k, K) or a new technology parameterized by (r, R), where K>0, R>0 are upfront investments and k > r > 0 are cost parameters sufficient to determine equilibrium profits under a given specification of demand and competition. Denote equilibrium duopoly profits by Π(r)k , Π(k)r , Π(r)r , and Π(k)k , where Π(y)x
represents the highest profit a firm can earn in period 2 if it uses technology with cost x, provided the other firm is maximizing its own profits using technology with cost y. Without restricting the model to a particular specification of production, competition or demand, let us only assume that the profit functions are differentiable and that a duopolist earns higher profits the lower its own costs and the higher its rivalʼs costs, ceteris paribus:
Figure 2. Venn diagram of innovation projects pursued by incumbents and/or entrants in the absence of competition.
ENTRANT ONLY INNOVATES
BOTH INNOVATE
ALL INNOVATION PROJECTS
∂Πx y
∂x ∂y
( )< 0 and∂Π( )x y > 0. (7)
These conditions hold in many standard models of competition such as Cournot and under reasonable assumptions on demand. The conditions imply:
Π(r)k < Π(k)k < Π(r)r < Π(k)r . (8)
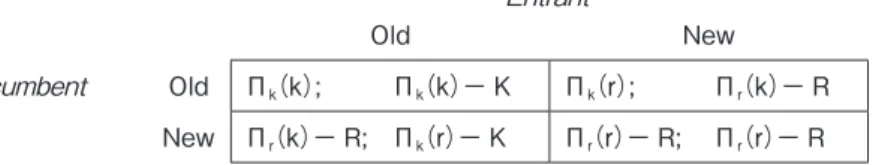
To guarantee that entry occurs, let us assume that Π(r)k > K, which means that the entrant can enter with old technology and turn a profit regardless of which technology the incumbent chooses.6) All payoffs and the structure of the game are common knowledge. The firms make their period 2 technology choice decision simultaneously. The period 2 payoff matrix is shown in Table 2.
Table 2. Entrant-incumbent competition (Generation Gap) game Entrant
Old New
Incumbent Old Π(k); k Π(k)− Kk Π(r); k Π(k)− Rr
New Π(k)− R; Πr (r)− Kk Π(r)− R; Πr (r)− Rr
Proceeding as before, we fix the old technology and consider the set of all innovation projects {(r, R) : 0<r<k and R>0}. Using the payoff matrix in Table 2, we can solve for conditions under which each of the four possible outcomes is a Nash equilibrium and then identify subsets of innovation projects corresponding to each equilibrium. Doing so yields the following. For a given old technology (k, K), the set of innovation projects that are pursued solely by the entrant in equilibrium is:
EONE(k, K) = {(r, R) : Π(r)−Πr (r)k < R < Π(k)−Πr (k)+k K} (9)
The sets of innovation projects corresponding to the other three possible equilibria are:
IONE(k, K) = {(r, R) : Π(r)−Πr (r)+k K< R < Π(k)−Πr (k)k } (10)
BTNE(k) = {(r, R) : R < Π(r)−Πr (r)k } (11)
NTNE(k, K) = {(r, R) : R > Π(k)−Πr (k)+k K} (12)
From (9) and (10) it follows that IONE ⊂ EONE. Thus, as was the case without competition, there are innovation projects that an entrant would pursue in equilibrium but an incumbent would not. Unlike the case without competition, however, a proper subset of such projects can also be part of another Nash equilibrium in which the incumbent innovates and the entrant does not. Although both the EO and IO equilibria result in the same technology adoption pattern, namely that one firm uses the old technology and one firm uses the new, the IO equilibrium is clearly less efficient because it requires K more in upfront investment.7)
Furthermore, comparing (3), (5), and (6) yields: NTNE∩ BTNE = ∅, NTNE ∩ EONE = ∅, and 6) Assuming profitable entry allows the analysis to focus on the differences in innovation strategies by incumbents and
entrants, setting aside the complementary question of whether entry occurs. The latter question is addressed in a separate literature on entry and entry barriers (see Gilbert, 1989)
7) Nevertheless, the IO equilibrium cannot be easily ruled out through game-theoretic analysis.
BTNE ∩ EONE = ∅. Result 2 and the Venn diagram in Figure 3 summarize these results.
Result 2. An incumbent competing against an entrant is relatively more conservative in the sense that
(a) there exist innovation projects which are pursued by the entrant in some Nash equilibrium of the competition game but are not pursued by the incumbent in any Nash equilibrium; and
(b) there do not exist innovation projects which are pursued by an incumbent in some Nash equilibrium but are not pursued by the entrant in any Nash equilibrium.
3.3 The case of Cournot duopoly with linear demand
Examining the above general findings in the context of a benchmark model of competition provides additional insights. Consider a Cournot duopoly facing linear inverse demand p = a−bq, where a and b are positive constants, q is quantity and p is price of the output good. With this demand specification, equilibrium profits (gross of investment) to a Cournot duopolist with cost x facing a rival with cost y is given byΠ(y)x = (a−2x+y)2 /9b; if both firms have the same costs, this reduces to Π(x)x = (a−x)2 /9b. Substituting these profit functions into (9)−(12) yields the sets of innovation projects corre sponding to each of the four possible equilibria:
EONE(k, K) = {(r, R): 4
9b(a−k)(k−r) < R < 4
9b(a−r)(k−r)+K} (13)
IONE(k, K) = {(r, R): 4
9b(a−k)(k−r)+K < R < 4
9b(a−r)(k−r)} (14)
BTNE(k) = {(r, R): R < 4
9b(a−k)(k−r)} (15)
NTNE(k, K) = {(r, R): R > 4
9b(a−r)(k−r)+K} (16)
Inspecting (13) and (14) reveals that EONE is contiguous to BTNE with the boundary given by
Figure 3. Venn diagram of innovation projects pursued in equilibrium by incumbents and/or entrants under competition.
ENTRANT ONLY INNOVATES
INCUMBENT ONLY INNOVATES
BOTH INNOVATE
ALL INNOVATION PROJECTS
R = 4
9(1−k)(k−r). Similarly, EONE is contiguous to NTNE with the boundary given by R = 4
9(1−r)(k−r)+K. IONE is contained within EONE with boundaries given by (14). Figure 4 plots the four regions. This is the concrete version of the abstract Venn diagram in Figure 3.
Figure 4. Innovation projects pursued in equilibrium by incumbents and/or entrants under Cournot competition with linear demand. Parameter values are a=100, b=.01, k = 50, K=5000.
㻜 㻞㻜㻘㻜㻜㻜 㻠㻜㻘㻜㻜㻜 㻢㻜㻘㻜㻜㻜 㻤㻜㻘㻜㻜㻜 㻝㻜㻜㻘㻜㻜㻜
㻞㻡 㻟㻜 㻟㻡 㻠㻜 㻠㻡 㻡㻜
㼞
㻾
EO
BT
NT (IO)
EO
We can quantify the relative amounts of innovation by incumbents and entrants by considering the ratio of innovations by entrant alone to all innovations undertaken in equilibrium.8) We can compute this ratio from the sizes of the equilibrium sets as follows: |EO| / (|EO| + |BT|), where |S| represents the size of a set S. In the case of the sets in (13)−(16), this corresponds to
ρ= EO EO + BT =
9b4(k r)2+ K
9b4(a r()k r)+ K (17)
Figure 5 plots (17) using the same parameter values as used in Figure 4. The percentage of innovations adopted by the entrant alone is large for minor improvements in production cost (i. e., small values of k
−r), but goes down as the relative efficiency of the new technology increases. However, even when the new technology is twice as efficient (k = 2r), as much as 37% of innovation projects are adopted by the 8) This accounting implicitly assumes that innovation projects for any given level of unit cost r are uniformly distributed
in terms of the upfront investment R.
entrant alone.
4. Comparing incumbent-only competition to competition with entrants
The previous section demonstrated that the entrant can undertake or stimulate a significant amount of innovation in a duopoly that pits an incumbent against an entrant. However, what happens to innovation performance if instead of being an entrant, the other duopolist is also an incumbent? This section extends the above framework to answer this question and thereby sheds light on whether there is likely to be more innovation when entrants compete with incumbents as compared to incumbents competing among themselves.
We proceed by comparing equilibria in the following three duopoly games, keeping all other aspects of the model the same:
Generation Gap: an incumbent competes with an entrant Old Boys’ Club: two incumbents compete
New Frontier: two entrants compete
Generation Gap is the incumbent-entrant game that was analyzed in the preceding sections. The other two games have the same structure, but different players. The period 2 payoff matrices of the three games are shown in Table 3.
To compare innovation outcomes in the three games, it is easiest to focus on the outcome NT, the status quo in which both firms choose the old technology K. The conditions under which NT is a Nash equilibrium in the three games follow from the payoff matrices. The sets of innovation projects corresponding to those equilibria are:
Figure 5. Percent of innovation projects adopted only by entrants out of all innovation projects that can be potentially adopted in Cournot equilibrium with linear demand. This is a plot of equation (17)
with parameter values a=100, b=.01, k = 50, K=5000. The graph shows, for example, that when the new technology offers a unit cost of r = 20 as opposed to the cost k = 50 offered by the old technology, 40% of the projects that could be undertaken by some firm are undertaken by entrant alone. It is assumed that innovation projects are distributed uniformly in terms of initial investment R.
Generation Gap or New Frontier:
NT GG(k, K) = NT NF(k, K) = {(r, R) : R > Π(k)−Πr (k)+k K} (18)
Old Boys’ Club:
NT OBC(k) = {(r, R) : R > Π(k)−Πr (k)k } (19)
By inspection, NTGG = NTNF NTOBC. This means there is less innovation in Old Boys’ Club.
Intuitively, the sunk cost K is irrelevant to period 2 payoffs in Old Boys’ Club since both firms have already sunk it. Their technology choice is based on comparing producing with the new technology net of additional investment to producing with the old technology with no additional investment. In contrast, when one or both firms is an entrant, old and new technology investments enter the decision process, and the decision to invest in the new technology is taken on more occasions the greater the investment K sunk by the incumbent. This leads to the following result.
Result 3. Entrants spur innovation in the sense that
(a) there exist innovation projects that are not undertaken in equilibrium of an incumbents-only game but are undertaken in equilibrium of a game that includes an entrant, and
(b) there do not exist innovation projects that are undertaken in equilibrium of an incumbents-only Table 3. Payoff matrices for three competition games
(a) Generation Gap Entrant
Old New
Incumbent Old Π(k); k Π(k)− Kk Π(r); k Π(k)− Rr
New Π(k)− R; Πr (r)− Kk Π(r)− R; Πr (r)− Rr
(b) Old Boys’ Club Incumbent 1
Old New
Incumbent 2 Old Π(k); k Π(k)k Π(r); k Π(k)− Rr
New Π(k)− R; r Π(r) k Π(r)− R; Πr (r)− Rr
(c) New Frontier Entrant 1
Old New
Entrant 2 Old Π(k)− K; Πk (k)− K k Π(r)− K; Πk (k)− Rr
New Π(k)− R; Πr (r)− Kk Π(r)− R; Πr (r)− Rr
game but are not undertaken in equilibrium of a game that includes an entrant
In the case of the Cournot duopoly example examined in Section 3.3, the above sets become:
NT GG(k, K) = NT NF(k, K) = {(r, R) : R > 4
9b(a−r)(k−r)+K} (20)
NT OBC(k) = {(r, R) : R > 4
9b(a−r)(k−r)} (21)
The difference is the sunk cost K. Holding old technology (k, K) constant and letting new technology parameters (r, R) vary, Figure 6 plots innovation projects that go ignored in equilibrium of the three games and identifies the set of innovations that would not be adopted unless competition includes entrants.
Figure 6. Innovation projects ignored in equilibrium under Cournot competition with linear demand. The area between the two curves represents the additional innovation due to having entrants in the industry.
Parameter values are a=100, b=.01, k = 50, K=5000.
㻜 㻟㻜㻘㻜㻜㻜 㻢㻜㻘㻜㻜㻜 㻥㻜㻘㻜㻜㻜
㻞㻡 㻟㻜 㻟㻡 㻠㻜 㻠㻡 㻡㻜
㼞
㻾
OLD BOYS CLUB
GENERATION GAP & NEW FRONTIER
The increase in innovation projects adopted if we replace one of the incumbents in the duopoly with an entrant is given by
θ=NTGG NTOBC
NTOBC = K
4
9b(a r()k r) (22)
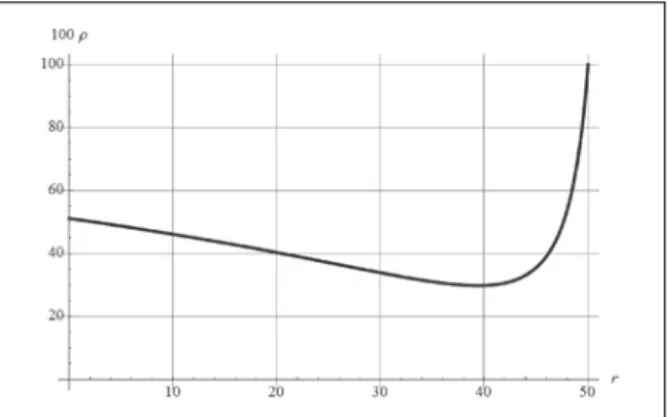
Figure 7 plots (22) using the same parameters as in Figures 4-6. It shows the substantial increase in innovation adoption that can accompany a shift from incumbents-only competition to a competition regime that includes entrants.
6. Conclusion
This paper developed a theoretical basis for why innovation policies that rely on competition by industry incumbents may underperform policies that promote entry by newly formed firms or by firms from other industries. The theory clarifies how an incumbentʼs sunk cost in current-generation technology causes the incumbent to be relatively reluctant to adopt next-generation technology, as compared to an entrant.
Several implications for policy can be tentatively noted. The findings suggest that innovation policy should explicitly distinguish incumbents from entrants using sunk costs as the litmus test of incumbency.
To give a concrete example, consider the problem of selecting recipients of R&D assistance to develop next-generation production technology in a given industry. Based on the findings, which are subject to the limitations of the model, the following advice can be given:
Donʼt just fund the incumbents. Also seek out and fund outsiders such as new startups, universities, or firms in other industries. Seek to achieve balance between experienced insiders and aggressive outsiders.
When qualifying candidates, ascertain whether and to what degree each candidate has sunk costs in current-generation technologies. Make sure that at least some of the chosen candidates have no or minimal sunk costs.
Finally, it is notable that an incumbent being upstaged by a newcomer is not a phenomenon limited to modern high-technology industries. Rather, it appears to extend back in time and across many fields of human endeavor including political, religious, military, artistic, and scientific revolutions. Of particular Figure 7. Percent increase in innovation projects adopted in Cournot equilibrium with linear demand when competition regime changes from incumbents-only to incumbent-entrant or entrant-entrant. This is a plot of equation (22) with parameter values a=100, b=.01, k = 50, K=5000. The graph shows, for example, that when the new technology offers a unit cost of r = 40 as opposed to the cost k = 50 offered by the old technology, there are about 20% more innovation projects that would be undertaken if entrants are involved than if there are only incumbents. It is assumed that innovation projects are distributed uniformly in terms of initial investment R.
relevance here is Kuhnʼs seminal work on paradigm shifts in science, in which he directly implicates sunk costs in the innovation performance of scientists: “Almost always the men who achieve these fundamental inventions of a new paradigm have been either very young or very new to the field whose paradigm they change. And perhaps that point need not have been made explicit, for obviously these are men who, being little committed by prior practice to the traditional rules ... are particularly likely to ...
conceive another set that can replace them.” (Kuhn 1970, p. 90) Although the mechanisms driving innovation by individuals differ from those driving innovation by firms, the parallels between Kuhnʼs observation and the findings of this paper allow us to conjecture that differences in sunk costs may be applicable for explaining differences in innovation performances in contexts beyond interfirm competition.
References
Anderson, P. and M. L. Tushman (1997) Managing Through Cycles of Technological Change, in Anderson, P.
and M. L. Tushman, eds., Managing Strategic Innovation and Change, Oxford University Press, New York, pp. 45-52
Christensen, C. M. (1997) The Innovator’s Dilemma: When New Technologies Cause Great Firms to Fail, Harvard Business School Press, Boston
Foster, R. N. (1986) Innovation: The Attacker’s Advantage, Summit Books, New York
Gilbert, R. J. (1989) Mobility Barriers and the Value of Incumbency, in R. Schmalensee and R. Willig, eds., Handbook of Industrial Organization, vol. 1, Elsevier Science, Amsterdam
Henderson, R. M. and K. B. Clark (1990) Architectural Innovation: The Reconfiguration of Existing Product Technologies and the Failure of Established Firms, Administrative Science Quarterly, 35, pp. 9-30 Kodama, F. (1995) Emerging Patterns of Innovation: Sources of Japan’s Technological Edge, Harvard Business
School Press, Boston
Kuhn, T. S. (1970) The Structure of Scientific Revolutions, 2nd ed., University of Chicago Press, Chicago Okimoto, D. I. (1989) Between MITI and the Market: Japanese Industrial Policy for High Technology, Stanford
University Press, Stanford
Porter, M. E. (1996) What Is Strategy? Harvard Business Review (Nov-Dec)
Schumpeter, J. (1950) Capitalism, Socialism, and Democracy, Harper and Row, New York Tirole (1988) The Theory of Industrial Organization, MIT Press, Cambridge