ŔűŢŵŪŢŭġŻŰůŪůŨġŰŧġųŦŨŪŰůŢŭġŵŴŶůŢŮŪġũŢŻŢųťġŢůťġŦŹűŰŴŶųŦġŪůġŵũŦġŊůťŪŢůġŐŤŦŢůġ ŶŴŪůŨġŴŤŦůŢųŪŰţŢŴŦťġůŶŮŦųŪŤŢŭġŵŴŶůŢŮŪġŴŪŮŶŭŢŵŪŰůġŢůťġŨŭŰţŢŭġűŰűŶŭŢŵŪŰůġťŢŵŢ
Anawat Suppasri*, Tsuyoshi Futami**, Richard Sanders***, Fumihiko Imamura*
łţŴŵųŢŤŵ
The Indian Ocean is one of the tsunamigenic regions where the great earthquake occurred in 2004, with many smaller events reported each year thereafter. In addition, earthquakes in other subduction zones in Indonesia, Myanmar and Pakistan also have the potential to generate tsunamis that affect countries surrounding the Indian Ocean. Therefore, there is still a need to assess tsunami hazards level when zoning a given locationȧs disaster planning and management. In this study, we summarize information regarding earthquake magnitude and recurrence. Then, the earthquake data is used as input for a numerical simulation to obtain tsunami hazard values, and global population data is used to assess the hazard for each country in the Indian Ocean.
Most of the studied countries might be affected by a tsunami larger than 4 m generated by an Mw
9.0 earthquake, particularly India, Indonesia and Thailand, where the simulated resulting tsunami heights along the coast were larger than 16 m.
The potential tsunami exposure (PTE) of the population distributions in the study area varied, with the highest PTE values in India, Indonesia and Myanmar, potentially exposing populations of over one million people. Large simulated tsunami heights in highly populated areas, such as Bangladesh, Indonesia and Pakistan, caused the highest hazard. This information is important for
disaster planning and management against future tsunami in the Indian Ocean.
Keywords: Tsunami hazard assessment, tsunami simulation, population data, Indian Ocean tsunami
IJįġŊůŵųŰťŶŤŵŪŰů
Earthquake and tsunami activities are still found in the Indian Ocean after the great earthquake in 2004 initiated in the region and caused large impacts in the Andaman and North Sumatra. However, it is also important to study the tsunami hazards to populations from potential tsunamis in other regions that still have not been properly assessed. For example shown in Fig. 1, there are potential tsunami sources in Makran in Pakistan and Iran (Page et.
al, 1979, Byrne et. al, 1992 and Heidarzadeh et al., 2008), Arakan in Myanmar (Socquet et al., 2006, Cummins, 2007, and Aung et al., 2008) and Java and Banda in Indonesia (Løvholt et al., 2006, DomineyHowes et al., 2007, Jankaew et al., 2008, Monecke et al., 2008, Burbidge et al., 2008, Latief et al., 2008, Alam et al., 2012). This study was designed to assess the regional tsunami hazards among countries in the Indian Ocean using earthquake information, numerical tsunami simulations and global population data. Previous studies of earthquakes in the study area were referenced for information on the relationship between earthquake magnitude and return period.
Numerical simulations were used to assist in estimating tsunami hazards based on earthquake parameters, and the exposure was assessed using
*International Research Institute of Disaster Science, Tohoku University, Japan
**Willis Japan Insurance Broker K.K.
***Willis (Singapore) Pte Ltd
global population distribution data. The expected outputs are tables of tsunami hazard levels and maps giving information on tsunami height, earthquake magnitude or return period as well as hazard levels for the exposed population. These results will support for planning, management and policy development for regional tsunamis.
ijįġŅŢŵŢġ
2.1 Fault parameters
The authors considered farfield tsunamis, which are known to have occurred in the Indian Ocean. Subduction zones were considered as potential tsunami sources in that study, including
the subduction zones in Makran, Arakan, Sumatra, Java and Banda. The present study assumed the strike, dip and slip values the same as a study by Okal et al. [2008] that considered seismological point of views based on mechanism of historical earthquakes in the study areas.
Papazachos et al. [2004] derived a series of empirical formulae to estimate the fault length (L), fault width (W) and displacement (u) that are based on the moment magnitude (Mw) of a given earthquake. The derived formulae were classi ed according to the type of fault. The following formulae were derived for calculating those fault parameters in the subduction zone:
Fig. 1 Plate tectonics and subduction zones in the Indian Ocean
Fault length, L (in km): log L = 0.55 Mw – 2.19, 6.7 Mw 9.2 (1) Fault width, W (in km): log W = 0.31 Mw – 0.63, 6.7 Mw 9.2 (2) Displacement, u (in cm): log u = 0.64 Mw – 2.78, 6.7 Mw 9.2 (3)
Table 1 Estimated size of each fault based on the earthquake moment magnitude Magnitude
(km)
Length (km)
Width (km)
Displacement (m)
Mw 9.3 1,000 200 14.86
Mw 9.0 600 175 9.55
Mw 8.9 500 160 8.24
Mw 8.7 400 150 6.14
Mw 8.5 300 135 4.57
Mw 8.2 200 120 2.94
Mw 7.6 100 100 1.21
For example, an Mw 7.6 earthquake will have a length of approximately 100 km, width of 50 km and displacement of 1.2 m. For convenience of the simulations, the present study simulated tsunamis that were generated by 7.6 and 9.3 Mw
earthquakes using a unit of fault length of 100 km, as shown in Table 1. An earthquake with a 9.3 Mw was only applied to two regions, Andaman and Sumatra, following the 2004 Indian Ocean event.
2.2 Earthquake regions and return period The study areas were separated into six regions based on geography: Makran, Arakan, Andaman, Sumatra, Java and Banda. General simulations of tsunami generated by 30 major historical earthquakes in the study area were previously performed by Suppasri et al. [2012a], showing the historical background of tsunami in this region.
At the time of this study, the selected areas cover 24 zones of 17 African and Asian countries, as shown in Table 2. The number of scenarios for each earthquake magnitude and region is summarized in Table 3. For example, in the Andaman region (Fig. 2), the total length is 1,600 km (= 16 unit faults); therefore, 16 simulated scenarios exist for the Mw 7.6 case. For the 9.0 Mw
simulations, the fault length of 600 km comprises 11 scenarios (nos. 1–6, nos. 2–7, nos. 3–8, nos.
4–9, nos. 5–10, nos. 6–11, nos. 7–12, nos. 8–13, nos. 9–14, nos. 10–15 and nos. 11–16). The total number of simulations performed in this study was 489 scenarios.
There have been some previous studies about earthquake return periods in the regions of the study area. In Makran, Page et al. [1979] first mentioned that the return period of a great event similar to the event that occurred in 1945 should be 125250 years, while Byrne et al. [1992]
estimated the same period as 175300 years, and a recent study proposed a period of 250 years (Heidarzadeh et al. [2008]). However, a 9.0 Mw earthquake may or may not occur with a return period longer than 1,000 years [2008].
For Arakan, the great event that occurred in 1762 with an estimated Mw of 8.8 has a return period of 200 years (Cummins [2007]). The return periods for earthquakes of magnitudes 8.5 and 9.0 were estimated as 100 and 500 years, respectively (Socquet et al. [2006]). Aung et al. [2008] said that such an earthquake with an Mw of 8.8 in Arakan might have a return period of more than 1,000 years.
Researchers of the tsunami deposits after the great event in 2004 agreed that such an event might have a return period of 550700 years (Jankaew et al. [2008]) or 600 years (Monecke et al. [2008]). The return period of an event of smaller magnitude (Mw 8.5) in the same region was estimated at 200 years (Løvholt et al. [2006]). Latief et al. [2008] considered four main subduction segments as tsunamigenic sources in Aceh, Seumelue, Andaman and Nias and proposed a hazard curve that correlates the earthquake return periods and the potential moment magnitudes. Their results agreed with
those of Jankaew et al. [2008], Monecke et al.
[2008] and Løvholt et al. [2006] were used in this study. Burbidge et al. [2008] derived hazard curves representing earthquake return periods as a function of magnitude in Java, Sumatra, Nankai,
Seram and South Chile. The present study used their results for the earthquake return periods in Java and nearby regions. The information about earthquake magnitudes and return periods derived from previous studies is summarized in Table 4.
Table 2 Positions and zoning information for each studied country
Table 3 Number of simulation scenarios for each earthquake magnitude in each region
Country Zone Lowerleft (°E, °N) Upperright (°E, °N)
Australia Australia 110.0, 25.0 143.0, 11.0
Bangladesh Bangladesh 89.0, 20.7 92.3, 23.5
East Timor East Timor 125.0, 9.5 127.5, 8.25
India
India (East) 79.5, 10.0 89.0, 20.7
India (West) 68.2, 7.5 79.5, 24.0
India (Nicobar) 91.5, 6.0 95.0, 15.0
Indonesia
Sumatra (North) 94.5, 3.5 100.0, 6.0
Sumatra (South) 100.0, 6.2 106.0, 3.0
Java 106.0, 11.5 125.0, 9.5
Papua (West) 127.5, 9.0 141.0, 0.0
Iran Iran 56.6, 25.0 61.62, 27.25
Malaysia Malaysia 100.0, 3.05 102.0, 6.4
Maldives Maldives 71.0, 1.0 75.0, 7.5
Mauritius Mauritius 57.2, 20.6 57.9, 19.8
Myanmar Myanmar (North) 92.3, 15.0 95.0, 20.7
Myanmar (South) 95.0, 10.0 99.0, 18.0
Oman Oman 55.0, 17.0 60.0, 25.0
Oman (North) 56.0, 25.6 56.6, 26.5
Pakistan Pakistan 61.62, 23.7 68.17, 25.5
Seychelles Seychelles 55.0, 5.0 56.0, 4.0
Reunion Reunion 55.1, 21.5 56.0, 20.7
Sri Lanka Sri Lanka 79.5, 5.5 82.5, 10.0
Thailand Thailand 94.5, 6.4 100.0, 10.0
UAE UAE 56.25, 25.0 56.4, 25.6
Region
Number of simulation scenario for each earthquake magnitude
Total Mw 9.3 Mw 9.0 Mw 8.9 Mw 8.7 Mw 8.5 Mw 8.2 Mw 7.6
Makran 4 5 6 7 8 9 39
Arakan 2 3 4 5 6 7 27
Andaman 7 11 12 13 14 15 16 88
Sumatra 20 24 25 26 27 28 29 179
Java 10 11 12 13 14 15 75
Banda 11 12 13 14 15 16 81
Total 27 62 68 74 80 86 95 489
Table 4 Summary of earthquake magnitude and return periods for each region
Fig. 2 The location of 16 faults divided into 100km lengths in the Andaman region
Mw
Earthquake return period (year)
Makran A Arakan B,C,D Andaman E,F,G Sumatra E,F,G Java H Banda H
9.3 N/A N/A 600 600 N/A N/A
9.0 N/A 500 450 450 1,000 1,200
8.9 N/A 350 400 400 800 1000
8.7 N/A 200 325 325 500 600
8.5 1,000 100 250 250 300 400
8.2 400 40 170 170 150 200
7.6 65 5 65 65 40 50
A Heidarzadeh et al., 2008
B Aung et al., 2008
C Socquet et al., 2006
D Cummins, 2007
E Jankaew et al., 2008
F Monecke et al., 2008
G Latief et al., 2008
H Burbidge et al., 2008
2.3 Global bathymetry and population data This study used global bathymetry data for a 1 arcminute grid (approximately 2 km) provided by the General Bathymetric Chart of the Oceans (GEBCO, [2009]) and global population data called LandScan for a 30 arc
second grid (approximately 1 km) provided by the Oak Ridge National Laboratory [2009]. The GEBCO data are largely based on the most recent set of bathymetric contours contained within the GEBCO Digital Atlas and are now widely used in many numerical tsunami simulations including
areas in the Indian Ocean such as in southeast Asia (Thio et al., 2007), Thailand (Løvholt et al., 2006 and Suppasri et al., 2011) Indonesia (Koshimura et al., 2009 and Muhari et al., 2011), Sri Lanka (Goto et al., 2011) and Iran and Pakistan (Heidarzadeh et al., 2008, Yanagisawa et al., 2009 and Heidarzadeh and Kijko, 2010).
The LandScan data are the finestresolution global population distribution data available and represent an ambient population which averaged over 24 hours (Oak Ridge National Laboratory [2009]).
ĴįġŎŦŵũŰť
3.1 Tsunami numerical simulation method A method proposed by Mansinha and Smylie [1971] was used to calculate the seafloor d e f o r m a t i o n s f r o m t h e e a r t h q u a k e f a u l t parameters, as mentioned in the previous section.
In general, seafloor deformation is the initial tsunami pro le for a tsunami simulation because it is assumed that the water column over the sea oor cannot escape within a short duration of earthquake generation (IUGG/IOC TIME Project, [1997]). A series of tsunami scenarios were simulated using the TUNAMI model developed at Tohoku University (IUGG/IOC TIME Project, [1997]), which is widely used in many countries.
The model contains sets of linear shallowwater
wave equations that are solved using a finite difference scheme in spherical coordinates that neglects effects from bottom friction and fault rupture velocity. The inputs for the model were the fault parameters and the global bathymetry data from GEBCO, as mentioned in the previous section. Results from the simulation at this stage is maximum tsunami heights along shoreline of the study areas.
3.2 Tsunami exposure searching method
The maximum tsunami height along the coastlines simulated using the numerical simulation was on a 2 km grid, and the LandScan global population data were available on a 1 km grid. Two problems had to be solved: (1) searching and estimating the tsunami runup height along the coast and (2) creating a different grid resolution. This study followed the method proposed by Suppasri et al. [2012b] and Suppasri et al. [2012c] to identify population exposure and count the population numbers along coastlines.
The method relied on a numerical lter to search a coastline grid. The inland runup height next to a coastal grid was estimated by averaging the surrounding tsunami heights along the shoreline and then project the average height inland as the runup height (Fig. 3). The Global population grid was overlaid on the estimated runup height grid. The possible exposure of a population was
Fig. 3 Calculation description of tsunami height alone shoreline and runup height for (a) actual condition and (b) far eld tsunami simulation and projected runup height
Estimated runup height Actual runup height
Tsunami height along shoreline Land
Sea Land Sea
Table 5 Proposed hazard level based on the tsunami height and population density Category Population
per km2 = 1 < 5 < 10 < 50 < 100 < 500 < 1,000 < 5,000 < 10,000 > 10,000
Height (m) Level 1 2 3 4 5 6 7 8 9 10
< 0.125 1 1 2 3 4 5 6 7 8 9 10
< 0.25 2 2 4 6 8 10 12 14 16 18 20
< 0.5 3 3 6 9 12 15 18 21 24 27 30
< 1 4 4 8 12 16 20 24 28 32 36 40
< 2 5 5 10 15 20 25 30 35 40 45 50
< 4 6 6 12 18 24 30 36 42 48 54 60
<8 7 7 14 21 28 35 42 49 56 63 70
< 16 8 8 16 24 32 40 48 56 64 72 80
< 32 9 9 18 27 36 45 54 63 72 81 90
> 32 10 10 20 30 40 50 60 70 80 90 100
counted and estimated along the tsunamiprone coastlines where the estimated runup height is higher than the land elevation using 1 km grid distances due to the resolution of the global population data.
3.3 Population exposure assessment method Because a populationȧs exposure depends on the tsunami hazard and population exposure, this study proposed a new hazard assessment criteria based on tsunami hazard and exposed population as shown in Table 5. For the calculation of the hazard level, we used a hazard level from one to ten for both the tsunami runup height and exposed population per square kilometer, respectively. The categories for the tsunami runup height were less than 0.125 m to greater than 32 m. The values for the number of people per square kilometer were from 1 to greater than 10,000.
The total hazard level is a product of the levels from the tsunami runup height and exposed population per square kilometer. Therefore, the maximum hazard level is 10 ȿ 10 = 100 using these criteria, which is easy to understand and compare. In addition, the hazard levels of 110, 1130 and 31100 are assumed to represent a low, medium and high hazard, respectively, because each level contains approximately onethird of the total distribution of levels. For example, a 0.5 m tsunami runup with an affected population of
10 (hazard level = 3 ȿ 3 = 9) will be considered as low hazard, a 2 m tsunami with an affected population of 100 (hazard level = 5 ȿ 5 = 25) will be medium hazard, and a 8 m tsunami with an affected population of 1,000 (hazard level = 7 ȿ 7 = 49) will be high hazard.
ĵįġœŦŴŶŭŵŴ
4.1 Tsunami hazard curves
Tsunami hazard curves can be obtained by plotting the simulated maximum tsunami height against the earthquake magnitude or return period. Fig. 4a shows an example from Sri Lanka, which is affected by tsunamis from several directions, e.g., from Makran in the west and from ArakanAndamanSumatraJava in the east. The maximum simulated tsunami height caused by an Mw 9.0 earthquake was approximately 10 m in Andaman. Tsunami generated by earthquakes in Arakan and Sumatra do not propagate in a straight direction to Sri Lanka, leading to a maximum tsunami height of approximately 35 m. The maximum tsunami height driven by earthquakes from Makran was only approximately 1 m in Java that are far away and are not in the direct route of wave propagation. The simulated tsunami height became smaller as the earthquake magnitude decreased and was less than 1 m for an Mw 7.6 earthquake for all of the studied regions.
Figs. 4b4d show other examples in Mauritius, N o r t h S u m a t r a a n d N o r t h w e s t A u s t r a l i a . Mauritius is located in the Southwest Indian Ocean, where no effect of tsunamis from Arakan and Banda would occur due to its geographic position. Sumatra can also be affected by tsunamis from throughout the region except for the Makran region because of its geographical location. Tsunamis affecting Australia could stem from Andaman in the northwest to Banda in the north. Mauritius and Australia have similar trends with maximum tsunami heights for Mw 8 and 9
class earthquakes of 1 m and 10 m, respectively.
However, the same class of earthquake might cause tsunami heights from 3 to 30 m for Sumatra, Indonesia.
Figs. 5a5d show the tsunami hazard curves for the aforementioned regions when plotting the earthquake return period. For example, the maximum tsunami height in the next 100 and 500 years might be approximately 1 m and 710 m, respectively, for Sri Lanka, Mauritius and Northwest Australia but would be 3 m and more than 20 m in North Sumatra, Indonesia.
Fig. 4 Examples of tsunami hazard curves as a function of earthquake magnitude (Mw) in (a) Sri Lanka, (b) Mauritius, (c) North Sumatra, Indonesia and (d) Northwest Australia
Comparison of the simulation results from this study and other studies is discussed here.
The maximum tsunami height of 1114 m was obtained by this study in Makran region including Iran and Pakistan, where 710 m, 1215m and more than 10 m were reported by Page et al.
[1979], Heidarzadeh et al. [2008] and Yanagisawa et al. [2009] respectively. Cummins [2007]
estimated the maximum offshore tsunami height up to 10 m based on Mw 8.8 earthquake while this study got around 78 m in the same coastal area in Myanmar from Mw 8.7 and 8.9 earthquakes. In Thailand, the simulated maximum tsunami height by this study was about 0.3 and 3 m by Mw 7.6 and 8.5 earthquakes in Andaman where Løvholt et al. [2006] estimated as 0.20.5 and 12 m by
Fig. 5 Examples of tsunami hazard curves as a function of earthquake return period in (a) Sri Lanka, (b) Mauritius, (c) North Sumatra, Indonesia and (d) Northwest Australia
Mw 7.5 and 8.5 earthquakes in the same source region respectively. These are similar to a study by Suppasri et al. [2012c] that estimated the maximum tsunami height as 0.30.4 and 23 m for Mw 7.6 and 8.5 earthquakes accordingly.
There are some regions in Indonesia to be compared namely Sumatra, Java and Sulawesi.
For Aceh province in the North Sumatra region, this study estimated about 3, 10 and more than 10 m for the case of Mw 7.6, 8.5 and > 9.0 earthquakes while Thio et al. [2007] and Latief et al. [2008] estimated as 12, 78 and 10 m or more respectively. A study by Hartanto [2013]
reported the possible maximum height in Padang in the central Sumatra as about 1 m and 714 m for Mw 8.1 and 8.9 earthquakes respectively. For
Java region, our results also agreed with other studies as the estimated the maximum tsunami height is about 12 m by Mw 7.7 earthquake when compared with Cipta [2008] and more than 10 m by Mw 8.8 earthquake when compared with Prasetya [2009]. In Sulawesi, earthquake in Java generated the maximum tsunami height of less than 2 m in any case which agreed with the results from Thio et al. [2007]. In the northwestern Australia, the simulation results from this study is about 12 m height from earthquake in Andaman and Sumatra however, it can be up to 10 m or more in some cases from the earthquake sources in Java and Banda. On the other hand, Berbidge et al. [2008] showed in their results that the maximum simulated offshore wave height was about 2 m or more which the runup can be many times greater than this value.
4 . 2 M a x i m u m t s u n a m i h e i g h t , e x p o s u re population and hazard map
Further analysis of the results of the maximum tsunami height and exposure levels of the studied
populations is discussed here. Fig. 6 shows an example of a plot of the simulated maximum tsunami height and total accumulated exposure of the population within a 1 km inundation distance by country for an Mw 9.0 earthquake. For more than half of the countries in the study area, it is possible to have a maximum tsunami height equal or greater than 10 m with an exposed population of over 100,000 (Fig. 6), with the exception of countries that are far from the tsunami sources, such as small islands in the southwest Indian Ocean.
We can classify these countries into four groups based on their population exposure using a tsunami generated by an Mw 9.0 earthquake as an example. The two countries with the highest hazard, considering separately the highest class of tsunami height and exposed population, are Indonesia and India, which form the rst group.
The simulated tsunami height was more than 20 m, and the exposed population reached 47 million for these two countries. The second group was primarily populated countries, such Fig. 6 Simulated maximum tsunami height and total accumulated exposure of the local population for a Mw
9.0 earthquake by country
as Bangladesh, Maldives, Myanmar, Oman, Pakistan and Sri Lanka, where the simulated tsunami height was approximately 10 m with an exposed population of slightly less than a million. The third group is similar to the second group with a similar simulated tsunami height but a comparatively lower expose population level of approximately 0.1 million: Australia, East Timor, Iran and Thailand. The last group is composed of countries, including Malaysia, Mauritius, Reunion, Seychelles and UAE, that are far from tsunami sources and might experience tsunami less than 5 m with exposed populations of approximately 0.1 million.
A tsunami hazard map showing the maximum tsunami height simulated for each scenario with the same earthquake magnitude was overlaid on the other maps to determine the maximum tsunami height based on the given scenarios in each grid. For example, there were 62 scenarios for an Mw 9.0 earthquake, and Fig. 7 shows the hazard map as a result of overlaying 62 maps. The map shows a possible worst case of the maximum
of the maximum simulated tsunami heights for an Mw 9.0 earthquake. Large tsunami heights were found along the coastlines of the Indian Ocean, except the west coast of India. Fig. 7 also shows the distribution of the population data in the study area. Large populations are found throughout India and on Java in Indonesia.
Comparisons of the simulated maximum tsunami heights (by Mw 9.0 or 9.3 earthquakes) and recorded tsunami heights (NOAA database, [ 2 0 1 2 ] ) f r o m t h e 1 9 4 5 M a k r a n a n d 2 0 0 4 Indian Ocean tsunami are shown in Table 6.
The simulated results show similar or higher maximum tsunami heights than the recorded data in most of the studied countries. At the very least, we showed that the simulated maximum tsunami heights for each country are reliable and compatible with historical records. The results also might be applicable for those countries that still have no recent tsunami experience or historical tsunami record to guide their preparation.
Fig. 7 Total 62 maximum tsunami height maps for a Mw 9.0 earthquake overlaid with the population distri bution in the study area
4.3 Regional population hazard levels
A hazard level for each coastal grid was calculated based on the criteria given in section 3.3. This value is a representative of the maximum value among values in other grids for each country. Fig. 8 shows an example of the maximum hazard level for each zone for 7.6 9.3 Mw earthquakes in Andaman. If we compare the results from the Mw 9class (Mw 8.79.3) earthquakes, the hazard levels of Bangladesh, India, Indonesia (Sumatra), Maldives, Myanmar, Sri Lanka and Thailand were similar because their average values ranged from 50 to 70. The hazard level of 5070 means, for example, that a tsunami height of 28 m may occur in an area with a population of more than 10,000 people/
km2 or a tsunami larger than 32 m may occur in an area with a population ranging from 100 1,000 people/km2. Other regions, such as Australia, Indonesia (Java), Iran, Pakistan, Oman and islands in the Southwest Indian Ocean, suffer fewer effects from tsunami in Andaman due to
their locations.
T h e m a x i m u m h a z a r d l e v e l c a l c u l a t e d for each region from each tsunami source is useful when comparing the tsunami hazard to population among countries. An example for Sri Lanka is shown in Fig. 9, which demonstrates the maximum tsunami height from Mw 9.0 earthquakes, the population distribution and the maximum hazard level for each coastal grid.
These results also help to make a comparison based on the population hazard information within a country.
4.4 Assumptions and limitations
In terms of the fault parameters, this study only limited the fault position related parameters such as strike, dip, slip and depth for only one pattern based on the mechanism of historical earthquakes proposed by previous studies for each unit fault along the Indian Ocean. Also the fault geometry was limited to every 100 km length of the fault for a convenience in setting the
Fig. 8 Maximum population hazard level for each zone by tsunamis generated from 7.69.3 Mw earth quakes in Andaman
Fig. 9 Distribution of the calculated population hazard levels by tsunamis generated from 9.0 Mw earth quakes in Sri Lanka
calculation. Therefore, earthquakes in the future may occur with fault parameters differ from what assumed in this study or may not follow the empirical relationship between the earthquake moment magnitude and the fault geometry and the dislocation. For the far eld simulation point of view, because of the scope that is to focus on the regional or macro scale, we used the linear shallowwater wave equations to estimate the maximum tsunami height along the shoreline and inland runup height in a coarse computational grid which might may not as accurate as the results of the simulation that includes the nonlinear effect for the tsunami inundation over the land in a very nd grid. In addition, although we only count the number of exposed population in a grid that the runup height is higher than the land elevation, the effect of day or night time population could not be represented in the present data.
ĶįġńŰůŤŭŶŴŪŰůŴ
Based on the maximum tsunami population
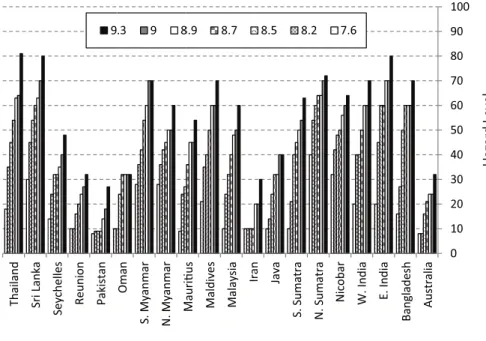
hazard level for each of the regions and countries stemming from Mw 9.0 earthquakes in all of the possible tsunamigenic regions, we summarized the regions as shown in Figs. 1012 and Table 6. Figs. 1012 summarize an example overview of the tsunami hazard (Fig. 10), population exposure (Fig. 11) and hazard level (Fig. 12) of probable tsunamis from 62 scenarios of Mw
9.0 earthquakes in the Indian Ocean. Most of the studied countries might be affected by a tsunami larger than 4 m generated by an Mw 9.0 earthquake (Fig. 10). In India, Indonesia and Thailand, the simulated tsunami heights are larger than 16 m. The potential tsunami exposures (PTE) of the population distributions in the study area vary, with the highest PTE in India, Indonesia and Myanmar, with PTE populations larger than one million (Fig. 11). Finally, a comparison of the population hazard levels considering both runup height and exposed population is shown in Fig. 12. Large simulated tsunami heights in highly populated areas, such as Bangladesh, Indonesia and Pakistan, are shown to cause
the highest hazards. Details of the calculated tsunami population hazard levels from an Mw
9.0 earthquake for each of the studied regions are summarized in Table 6. The findings from
this study can be a decision support tool to help with zoning and to compare the regional tsunami hazards among the countries surrounding the Indian Ocean.
Fig. 12 Zoning of countries based on the calculated population hazard level Fig. 10 Zoning of countries based on the simulated maximum tsunami height
Fig. 11 Zoning of countries based on the total number of potential tsunami exposures
Table 6 Summary of all of the results in all of the studied zones and countries: the maximum tsunami height (historical database and simulations) for an Mw9.0 earth quake and the maximum risk level of the areas LocationMax. tsunami height (m)Maximum tsunami population hazard level CountryZoneMax. from database (region) Max. simulated by this study ( source region)
Makran > 1000 yrsArakan 500 yrsAndaman 450 YrsSumatra 450 yrsJava 1000 yrsBanda > 1000 yrsMAX RegionCountry MAX AustraliaAustralia 0.90
15.74 (Java)244056565656 BangladeshBangladesh9.13 (Arakan)806040358080 East TimorEast Timor16.46 (Banda)36707070 India
E. India 9.56
20.16 (Andaman)7070603570 70W. India6.66 (Andaman)6060604060 Nicobar34.78 (Andaman)3660482060 Indonesia
N. Sumatra 50.9
34.28 (Sumatra)327072402472 80
S. Sumatra37.09 (Sumatra)5480604080 Java31.06 (Banda)56807280 W. Papua24.21 (Banda)407070 Borneo1.12 (Banda)243232 Sulawesi11.97 (Banda)406464 IranIran12.42 (Makran)70207070 MalaysiaMalaysia4.005.46 (Sumatra)3050405050 MaldivesMaldives 4.438.82 (Andaman)40186050326060 MauritiusMauritius7.40 (Sumatra)184554545454 MyanmarN. Myanmar2.9015.77 (Arakan)70503270 70 S. Myanmar19.65 (Andaman)40704070 OmanOman1.6513.23 (Makran)70322470 70 N. Oman3.46 (Makran)4848 PakistanPakistan15.2413.90 (Makran)72187272 PhilippinesPhilippines0.91 (Banda)404040 ReunionReunion3.74 (Sumatra)2750405050 SeychellesSeychelles1.392.33 (Sumatra)4040404040 Sri LankaSri Lanka11.314.25 (Andaman)40487060407070 ThailandThailand19.5736.78 (Andaman)4864546464 UAEUAE5.21 (Makran)636363
łŤŬůŰŸŭŦťŨŮŦůŵŴ
This study was sponsored by the Willis Research Network as part of the Pan Asian/
Oceanian Tsunami Risk Modeling and Mapping P r o j e c t . T h e a u t h o r s a p p r e c i a t e t h e k i n d cooperation of Ms. Tae Asada throughout the study. The authors also express profound gratitude for very useful comments and suggestions from Dr. Dale DomineyHowes from the University of New South Wales.
œŦŧŦųŦůŤŦŴ
Alam, E., DomineyHowes, D., ChaguéGoff, C.
and Goff, J. [2012] ȨTsunamis of the northeast Indian Ocean with a particular focus on the Bay of Bengal – a synthesis and review,ȩ Earth Science Reviews, 114, 175193.
A u n g , T. T. , S a t a k e , K . , O k a m u r a , Y.
and Shishikura, M. [2008] Geologic evidence for three great earthquakes in the past 3400 years Off Myanmar,ȩ Journal of Earthquake and Tsunami, 2, 259–265.
Burbidge, D., Cummins, P. R., Mleczko, R. and Thio, H. K. [2008] ȨProbabilistic tsunami hazard assessment for Western Australia,ȩ Pure and Applied Geophysics, 165, 2059–2088.
Byrne, D. E., Sykes, L. R. and Davis, D. M.
[1992] ȨGreat thrust earthquakes and aseismic slip along the plate boundary of the Makran subduction zone,ȩ Journal of Geophysical Research, 97, 449–478.
Cipta, A. [2008] ȨStudy on tsunami numerical modeling for making tsunami hazard maps in Indonesia,ȩ Bulletin of IISEE, 43, 127132.
Cummins, P.R. [2007] ȨThe potential for giant tsunamigenic earthquakes in the northern Bay of Bengal,ȩ Nature, 449, 75–78.
DomineyHowes, D., Cummins, P. and Burbidge, D. [2007] ȨHistoric records of teletsunami in the Indian Ocean and insights from numerical modeling,ȩ Natural Hazards, 42, 117.
General Bathymetric Chart of the Oceans (GEBCO), GEBCO_08 grid: http://www.
gebco.net/ (20 February 2009)
Goto, K., Takahashi, J., Oie, T. and Imamura, F. [2011] ȨRemarkable bathymetric change in the nearshore zone by the 2004 Indian Ocean tsunami: Kirinda Harbor, Sri Lanka,ȩ Geomorphology, 127 (12) 107116.
Hartanto, D. [2013] ȨTsunami simulations off the west coast of Sumatra using dispersive and nondispersive waves,ȩ Bulletin of IISEE, 47, 109114.
Heidarzadeh, M., Pirooa, M. D., Zaker, N. H., Yalciner, A. C., Mokhtari, M. and Esmaeily, A. [2008] ȨHistorical tsunami in the Makran subduction zone off the southern coasts of Iran and Pakistan and results of numerical modeling,ȩ Ocean Engineering, 35, 774–786.
Heidarzadeh, M. and Kijko, A. [2010] ȨA probabilistic tsunami hazard assessment for the Makran subduction zone at the northwestern Indian Ocean,ȩ Natural Hazards, 56(3), 577 593.
IUGG/IOC TIME Project, Numerical Method o f Ts u n a m i S i m u l a t i o n w i t h t h e L e a p Frog Scheme, UNESCO Intergovernmental Oceanographic Commission Manuals and Guides, 35 (1997), 126p.
Jankaew, K., Atwater, B.F., Sawai, Y., Choowong, M., Charoentitirat, T., Martin, M.E. and Prendergast, A. ȨMedieval forewarning of the 2004 Indian Ocean tsunami in Thailand,ȩ Nature, 455 (2008), 1228–1231.
Koshimura, S., Oie, T., Yanagisawa, H., and Imamura, F. [2009] ȨDeveloping fragility curves for tsunami damage estimation using numerical model and posttsunami data from Banda Aceh, Indonesia,ȩ Coastal Engineering Journal, 51, 243–273.
Latief, H., Sengara, I.W., Kusuma, S.B. [2008]
ȨProbabilistic seismic and tsunami hazard analysis model for input to tsunami warning a n d d i s a s t e r m i t i g a t i o n s t r a t e g i e s ,ȩ I n
proceedings of the International Conference on Tsunami Warning (ICTW) Bali, Indonesia.
Løvholt, F., Bungum, H., Harbitz, C. B., Glimsdal, S., Lindholm, C.D. and Pedersen, G. [2006] ȨEarthquake related tsunami hazard along the western coast of Thailand,ȩ Natural Hazards and Earth System Sciences, 6, 979–
997.
Mansinha, L. and Smylie, D.E. [1971] ȨThe displacement elds of inclined faults. Bulletin of the Seismological Society of America,ȩ 61, 1433–1440.
Monecke, K., Finger, W., Klarer, D., Kongko, W., McAdoo, B.G., Moore, A.L., Sudrajat, S.U. [2008] ȨA 1,000–year sediment record of tsunami recurrence in northern Sumatra,ȩ Nature, 455, 1232–1234.
Muhari, A., Imamura, F., Koshimura, S. and Post, J. [2011] ȨExamination of three practical run up models for assessing tsunami impact on highly populated areas, Natural Hazards and Earth System Sciences, 11, 31073123.
National Geophysical Data Center (NGDC), Tsunami database: http://www.ngdc.noaa.gov/
hazard/tsu_db.shtml (6 August 2012)
Oak Ridge National Laboratory, LandScan2008, http://www.ornl.gov/sci/landscan/ (13 October 2009)
Okal, E.A. and Synolakis, C.E. [2008] ȨFar eld tsunami hazard from megathrust earthquakes in the Indian Ocean,ȩ Geophysical Journal International, 172 (2008) 9951015.
Page, W.D., Alt, J. N., Cluff, L. S. and Plafker, G.
[1979] ȨEvidence for the recurrence of large magnitude earthquakes along the Makran coast of Iran and Pakistan,ȩ Tectonophysics, 52, 533–547.
P a p a z a c h o s , B . C . , S c o r d i l i s , E . M . , Panagiotopoulos, D. G., Papazachos, C. B.
and Karakaisis, G. F. [2004] ȨGlobal relations between seismic fault parameters and moment magnitude of earthquakes,ȩ Bulletin of the Geological Society of Greece ,vol. 36, Proc. of
the 10th International Congress, Thessaloniki, Greek.
Prasetya, T. [2009] ȨNumerical simulation for the assessment of tsunami scenarios in southern Yogyakarta, central Java Island, Indonesia,ȩ Bulletin of IISEE, 44, 121126.
Socquet, A., Vigny, C., ChamotRooke, N. and Simons W. [2006] ȨIndia and Sunda plates motion and deformation along their boundary in Myanmar determined by GPS,ȩ Journal of Geophysical Research, 111, B05406.
Suppasri, A., Koshimura, S. and Imamura, F.
[2011] ȨDeveloping tsunami fragility curves based on the satellite remote sensing and the numerical modeling of the 2004 Indian Ocean tsunami in Thailand,ȩ Natural Hazards and Earth System Sciences, 11, 173–189.
Suppasri, A., Futami, T., Tabuchi, S. and mamura, F. [2012a] ȨMapping of historical tsunamis in the Indian and Southwest Pacific Oceans,ȩ International Journal of Disaster Risk Reduction, 1, 6271.
Suppasri, A., Imamura, F. and Koshimura, S. [2012b] ȨTsunami hazard and casualty estimation in a coastal area that neighbors the Indian Ocean and South China Sea,ȩ Journal of Earthquake and Tsunami, 6, 1250010.
Suppasri, A., Imamura, F. and Koshimura, S.
[2012c] ȨProbabilistic tsunami hazard analysis and risk to coastal populations in Thailand,ȩ Journal of Earthquake and Tsunami, 6, 1250011.
Thio, H. K., Somerville, P. and Ichinose, G.
ȨProbabilistic analysis of strong ground motion and tsunami hazards in southeast Asia,ȩ Journal of Earthquake and Tsunami, 1 (2), 119 137.
Yanagisawa, H., Koshimura, S., Imamura, F., Watabe, H., and Egashira, T. [2009] ȨTsunami hazard assessment along the coast of Pakistan based on the 1945 Makran tsunami,ȩ Journal of Japan Society of Civil Engineers, Ser. B2 (Coastal Engineering), 65, 1, 306310.