科学・技術・産業データの接続と 産業の科学集約度の測定
2017 年 3 月
文部科学省 科学技術・学術政策研究所 第1研究グループ
池内健太 元橋一之 田村龍一 塚田尚稔
本DISCUSSION PAPERは、所内での討論に用いるとともに、関係の方々からの御意見を頂く ことを目的に作成したものである。
また、本DISCUSSION PAPERの内容は、執筆者の見解に基づいてまとめられたものであり、
必ずしも機関の公式の見解を示すものではないことに留意されたい。
【執筆者】
池内健太 独立行政法人経済産業研究所 研究員
文部科学省科学技術・学術政策研究所 客員研究官 元橋一之 東京大学大学院工学系研究科 教授
文部科学省科学技術・学術政策研究所 客員研究官 田村龍一 一橋大学イノベーション研究センター 特任講師
文部科学省科学技術・学術政策研究所 客員研究官 塚田尚稔 文部科学省科学技術・学術政策研究所 主任研究官
【 】
本報告書の引用を行う際には、以下を参考に出典を明記願います。
池内健太・元橋一之・田村龍一・塚田尚稔 (2017) 「科学・技術・産業データの接続と産業の科 学集約度の測定」,NISTEP DISCUSSION PAPER,No.142,文部科学省科学技術・学術政策研 究所.
科学・技術・産業データの接続と産業の科学集約度の測定
文部科学省 科学技術・学術政策研究所 第1研究グループ 要旨
本論文では、科学論文(科学知識)、特許(技術知識)、及び経済センサス(産業)のデータを 組み合わせて、日本の産業の科学集約度を測るための新しい指標を提示した。この指標は、特許 による非特許文献の引用情報を用いた既存のサイエンス・リンケージ指標では捉えることができ ない、大学等のアカデミアが出願する特許によって生じる科学と産業界の相互作用を反映してい る。アカデミアの特許出願活動が活発になり、サイエンス・ベース産業以外の分野でも、アカデ ミアの科学知識が活用されるようになった。さらに、ここ 10年ほどの間に、全ての学術分野に おいて、その科学知識が産業のイノベーションでますます利用されるようになった。サイエンス への公的支援は産業のイノベーションを促進するための重要な政策であり、学術界と産業界の相 互交流を促進する政策が企業による科学知識の更なる活用に必要とされていることを、我々の研 究は再確認した。
First Theory-Oriented Research Group, National Institute of Science and Technology Policy (NISTEP), MEXT
ABSTRACT
This paper presents new indicators measuring the science intensity of industry in Japan, linking a scientific paper database (science), patent information (technology), and economic census data (industry). The new indicators reflect the interaction between science and industry, via academic patenting activities, which cannot be measured by an existing indicator of science linkage - non-patent literature (NPL) citations by patents. As the academic sector gets more involved in patenting activities, its scientific knowledge is utilized by industries that are not categorized as science-based. Additionally, it was revealed that scientific knowledge has been increasingly used for industrial innovation over the last 10 years, across all academic disciplines. Our study reiterates that public support of science is essential for industrial innovation.
JEL Code: O31, O33
Keywords: science intensity, academic patents, inventor disambiguation, industrial innovation
本DISCUSSION PAPERは、文部科学省科学技術・学術政策研究所(NISTEP)と独立行政法人経済
産業研究所(RIETI)との共同研究プロジェクトの成果の一部である。
概要
i
1.
はじめに
産業のイノベーション・プロセスにおいて科学的知識の重要性が高まっている。ゲノム・
サイエンスが医薬品産業の研究開発プロセスを大きく変化させ、また、LSI製造プロセスの 微細化にはナノ・スケールでの物質の物性に関する理解が不可欠となった。情報技術の進歩 が社会経済に大きなインパクトを与えるようになったことや、ビッグデータ分析がビジネ スやマネジメントについてのより深い理解に貢献するようになったことなども典型的な例 として挙げられるだろう。
高等教育機関や公的研究機関などのアカデミアは財政制約が厳しい中でも大規模な公的 資金に補助されている。こうした公的資金による研究開発の経済へのインパクトを理解す ることへの政策的関心が高まっており、この論文では産業のイノベーションにおけるアカ デミアの貢献度を計測した。
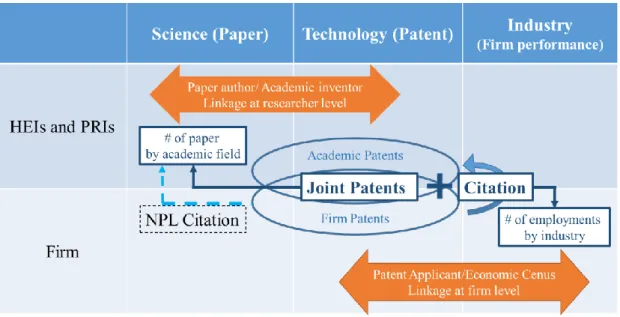
アカデミアの多くの研究者は論文だけでなく特許も生み出しており、科学的知識だけで なく、産業上利用可能な技術的知識も保有している。大多数の特許は企業によって出願され ているが、特許出願につながる研究開発の過程ではアカデミアで生産された知識が重要な 役割を果たしていると考えられる。以下では、科学、技術、産業、及びアカデミアと企業の 間のリンケージを理解するための概念フレームワークを提示し、科学、技術、及び産業に関 するデータベースを接続して試みた新しい計測手法について説明する(図1参照)。
図1 概念フレームワーク
ii
2.
データ
特許のサイエンス・リンケージ指標として、伝統的には非特許文献引用数(特許による学 術論文の引用数)が用いられてきた。今回、我々が注目したのは、アカデミアの研究者がも つ科学的・技術的知識が、アカデミアと企業による共同研究(企業とアカデミアの共同出願 特許)や、アカデミアの技術的知識が特許という形で公開されて企業の研究開発に活用され る(企業特許がアカデミアの特許を引用)という経路で生じる知識フローであり、その規模 を測る指標を作成するために、論文データベース(エルゼビア社のScopus)、特許データベ ース、および経済センサスを活用した。
アカデミアの研究者の人的資本に体化されている科学と技術のリンケージを捉えるため に論文データと特許データを研究者個人単位で接続して、アカデミアの研究者がもつ学術 分野別の論文数や技術分野別の特許数を求めた。また、特許の出願人と経済センサスの企業 情報を接続することで、特許の書誌情報と、企業の研究者数、従業員数や産業分類の情報な どを併せて利用することが可能となった。
このデータセットを用いて、アカデミアで生産された科学的知識が産業界でどの程度活 用されているのかを表す指標(科学集約度)を、企業の従業員100人当たりに活用された知 識ソースにまつわる学術論文数という単位で、知識フローの経路別(共同研究、アカデミア 特許の引用、その両方)に算出した。また、同時に、知識フローの径路別に、各学術分野の 論文のうちで産業界において活用された論文のシェアも算出した。我々は、データセットを
2000-2003年(第1期)、2004-2007年(第2期)、2008-2011年(第3期)に分けて、同じ期
のなかで生じた知識フローを今回の集計対象としている1。
3.
科学と産業のリンケージ指標
図2には、科学集約度の第1期、第2期、第3期の推移を示した。第1期から第2期にか けては、共同研究、アカデミア特許引用を経路とする指標のどちらも値が大きく上昇してい る。これは大学法人化などで大学における特許出願が活発化したことが影響しているもの と考えられる。しかしながら、第2期から第3期にかけては、科学集約度は全体で3.6から 3.0に下落している。下落幅の約2/3はアカデミア特許引用の減少による。これは、第2期 において、特許出願するだけの価値があると考えられる大学等の研究成果が集中的に特許 化され、それに伴いアカデミア特許引用も一時的に大きく増加したが、第3期は大学におい
1 NISTEPが購入したScopusは1996年以降に刊行された論文情報を収録している。あま り過去にさかのぼった論文情報を利用することができないため、同じ期における知識フローに 注目することとなった。
iii
て特許化に向いた研究成果が短期的にはやや枯渇した可能性があると考えられる。共同研 究の減少はリーマンショック後の不況のために企業が研究開発投資を抑えたことが影響し ている可能性があるだろう。
産業分野別の科学集約度(図3)をみると、リーマンショックの影響もあり、情報通信機 器(ICT Machinery)などでは第 3期に大きく低下している。しかし、科学知識の重要性上 昇のためか、化学分野のように第1 期から第 3期にかけて一貫して上昇している分野もあ る。今後、産業分野ごとの変化の要因も探っていく必要があるだろう。
図 4 には、アカデミアの学術論文のうちで共同研究やアカデミア特許引用を通して産業 界で活用された学術論文のシェアの推移を示している。全体としては第 1 期から第 2期に かけて大幅に上昇しており、やはり大学等の特許取得の影響で産業活用度が進んだといえ るだろう。しかし、第2期から第3期にかけては10%ほど低下している。これは上記の産 業分野別の科学集約度の傾向とも整合的といえるだろう。この時期は、アカデミアの論文数 はほぼ横這いであるが、特許出願数は低下している。第2期はそれまで大学に蓄積されてき た研究成果の特許化が進んだが、第3期はこの件数が少なくなった(特に大学の単独出願)。 これは産業界が潜在的に引用可能なアカデミア特許数が減少したことを意味している。た だし、アカデミアと企業の共同出願特許は減っていない。
学術分野別にみると(図 5)、材料科学や化学工学などの分野では上昇傾向にある。コン ピューター・サイエンス分野は、その学術成果のエレクトロニクス産業における活用が減少 したためか、産業活用度が低下している。産業分野別の科学集約度と比較すると、分野によ る偏りは少ない。Social ScienceやArts and Humanitiesなどの、いわゆる文系に分類されてい る学問分野も貢献度を高めている。
iv 図2 科学集約度の推移
図3 産業分野別の科学集約度
1.5
2.4 2.3
0.2
0.3
0.2
0.5
0.8
0.5 2.1
3.6
3.0
0.0 0.5 1.0 1.5 2.0 2.5 3.0 3.5 4.0
2000-2003 2004-2007 2008-2011
via Patent Citation only (EACH period) via Joint Invention &
Patent Citation via Joint Invention only
0 10 20 30 40 50 60
Chemicals (excl. Pharm.) Pharmaceuticals Oil and Coal Products ICT Machinery Electronics Machinery Primary Metals Electronics Devices Clay and Stones Technology Services General Machinery Electicity, Gas and Utilities Telecom Service,… Transportation Machinery Plastic, Lumber and Leather Apparel and Textile Other Manufacturing Food and Tabacco Products Pulp, Paper and Printing ICT Services Metal Products Retail and Wholesale Real Estate and Rental… Mining and Construction Agriculture, Fishery etc. Wood and Funiture Other Services Transportation and… Personal Services Financial Services 2000-2003 2004-2008 2008-2011
v 図4 産業界で活用された学術論文のシェアの推移
図5 学術分野別:産業界で活用された学術論文のシェア
5.9%
8.1% 8.2%
3.3%
4.7%
3.4%
0.4%
0.6%
0.4%
9.5%
13.4%
12.1%
0.0%
2.0%
4.0%
6.0%
8.0%
10.0%
12.0%
14.0%
16.0%
2000-2003 2004-2007 2008-2011
via Patent Citation only (EACH period) via Joint Invention &
Patent Citation via Joint Invention only
0%
5%
10%
15%
20%
25%
30%
Materials Science Chemical Engineering Chemistry Engineering Computer Science Physics and Astronomy Energy Multidisciplinary Biochemistry, Genetics and Molecular… Immunology and Microbiology Arts and Humanities Pharmacology, Toxicology and… Agricultural and Biological Sciences Environmental Science Decision Sciences Dentistry Mathematics Neuroscience Social Sciences Veterinary Business, Management and Accounting Medicine Earth and Planetary Sciences Nursing Health Professions Psychology Economics, Econometrics and Finance 2000-2003 2004-2008 2008-2011
vi
4.
結果と含意
日本では 1990年代後半から産学連携の促進を目指して、いわゆる TLO 法や日本版バイ ドール法などの制度を整備したことにより、アカデミアと企業の共同研究が盛んになった。
また、2004 年には国立大学が法人化して大学が特許の出願人になることが可能になったた め、国立大学からの特許出願が増加した。産業界における科学集約度の変化は、これらの制 度変更の影響を反映している。アカデミアから企業への知識フローの経路とそれぞれの規 模の変化を表していると考えらえる。
2000 年代初頭と比較すると、総合的に見た科学集約度は多くの産業で上昇しつつある。
経済全体でサイエンス化が進みつつあり、企業のイノベーションに科学的知識を活用する ことの重要性が増しているためと考えられる。
学術分野としては、材料科学、化学、化学工学、計算機科学、物理学、工学などがサイエ ンス化に大きな貢献をしているが、近年は数学をはじめ、幅広い学問分野の影響が強くなっ ており、学術研究の産業への外部効果が高まっているといえるだろう。
科学的知識が経済全体の産業イノベーションに大きく貢献するならば、高等教育機関や 公的研究機関などのアカデミアへの公的支出は支持されるべきだろう。また、アカデミアと 企業の直接的な相互交流はサイエンス・リンケージを高める重要な経路であるため、企業の 大学内研究施設や大学発ベンチャー企業の支援などを含めて、アカデミアと企業の協力関 係をさらに促進すべきだろう。
参考文献
Li, GC., R. Lai, A. D’Amour, D.M. Doolin, Y. Sun, V.I. Torvik, A.Z. Yu, L. Fleming (2014)
“Disambiguation and co-authorship networks of the US patent inventor database (1975–2010),”
Research Policy, 43(6), 941-955.
Motohashi, K. and S. Muramatsu (2012) “Examining the university industry collaboration policy in Japan: Patent analysis,” Technology in Society, 34(2), 149-162.
Narin F. and Noma E. (1985) “Is technology becoming science?” Scientometrics, 7, 368-381.
Schmoch, U. (1997) “Indicators and relations between science and technology,” Scientometrics, 38(1), 103-116.
Tamada, S., Y. Naito, F. Kodama, K. Gemba, and J. Suzuki (2006) “Significant difference of dependence upon scientific knowledge among different technologies,” Scientometrics, 68(2), 289-302.
本文(英語)
1
1. Introduction
A scientific foundation has become increasingly integral to the industrial innovation process. For example, genome science has substantially changed the research and development (R&D) process of the pharmaceutical industry. Miniaturization of the large- scale integrated circuit (LSI) fabrication process requires an understanding of the nano- level physicality of its materials. Furthermore, advancements in information technology have a significant impact on society and the economy; in particular, “big data” analysis contributes to the scientific understanding of business and management activities. Since science sectors, such as universities and public research institutes (PRIs), are heavily subsidized by public money, there is a growing interest in measuring the scientific aspects of industrial innovation and performance to understand the economic impact of public R&D, despite severe constraints on public spending in general.
Traditionally, the degree of scientific basis, or science intensity of industry has been measured using non-patent literature (research papers) citations made by patents (Narin and Noma, 1985; Schmoch, 1997). This indicator captures the extent to which patents (technology for industrial use) are based on the scientific content of research papers. It is observed that science linkage varies in the technology area; science intensity is particularly high in the biotechnology field (Looy et al., 2003). Alternatively, the science- technology linkage can be captured using patent-publication pairs, i.e., overlapping content regarding the research output/invention between patents and research papers. This requires the simultaneous disclosure of research results in both patents and research papers (Lissoni et al., 2013), or text-mining techniques to identify the degree of content overlap between these two kinds of literature (Magerman et al., 2015). This information can provide an exact match between science and technology; however, limited availability of samples makes it unsuitable for aggregated indicators of science-technology linkage at the macro level.
Both these indicators reflect only one aspect of science linkages, that is, non-patent literature (NPL) citations shows the degree of disembodied scientific knowledge that flows into patents, while the patent-publication pair indicates co-occurrence of scientific and invention activities within the same research. In this paper, we proposed new indicators, based on a novel dataset combining science, technology, and industry. More specifically, we linked the data of research papers (Scopus by Elsevier) and patent data (Institute of Intellectual Property (IIP) patent database) at the author/inventor level to see how academic discipline and technology are interlinked at the individual (academic)
2
researcher level. This dataset provides the linkage between science and technology embodied in human capital (academic inventors). Both industry citations to the patents invented by academic inventors and the joint patent inventions between firms and such academic inventors reflect new channels of scientific knowledge flow from academia to industry, compared to those measured by conventional indicators such as NPL citations in patents. Unlike past studies regarding paper-patent linkage at the researcher level for particular technologies, such as biotechnology (Murray, 2002) and nanotechnology (Meyer, 2006), this study covers all technological fields by constructing a large-scale database.
Furthermore, the concordance between technology (patents) and industry classification has been created by linking patent database (IIP patent data) and Japanese economic census data at the firm level. Consequently, we developed concordance tables comprising academic field (science), patent (technology), and industrial performance (industry) to investigate how the scientification of industry and economy has progressed over time, while existing indicators, such as NPL citations in patents and the publication- patent pair, only show linkages between science and technology.
The remainder of this paper is structured as follows. Section 2 explains the methodology of linking three datasets - Scopus data for scientific publications, the IIP patent database for patents, and the economic census for industrial activities at the firm level. Section 3 presents the conceptual framework for analyzing the scientification of industry, and explains the methodology of our new indicators. Section 4 presents the trend of the scientification of industry over the last 10 years based on the new indicators. Finally, Section 5 presents a summary of new findings and some policy implications.
2. Dataset Construction Methodology
2-1. Author/Inventor level linkage of Scopus and the IIP Patent database
In this subsection, the major task is disambiguation of academic inventors from the patent database. We use the IIP Patent database, which contains all patent application information from the Japan Patent Office (JPO) (Goto and Motohashi, 1997). In the patent database, the name and address of inventors are available. However, there is no information to identify whether the same inventor has multiple patents. The name of inventor is strong information, but we need to disambiguate the different persons with the same name.
3
We apply Li et al.’s (2014) methodology for disambiguation of inventors in USPTO (United States Patent and Trademark Office) patents. Their methodology is originally based on the Authority disambiguation approach developed by Torvik et al. (2005), and Torvik and Smalheiser (2009). We disambiguate all Japanese inventors of patents applied for between 1995 and 2013, derived from the IIP patent database. We exclude non- Japanese inventors, whose names do not contain Chinese characters (Kanji), and/or whose address is outside Japan. A total of 12.4 million inventor-patent records are obtained for analysis, which contain 1.2 million unique combinations of the inventor’s name and address, and applicant’s name.
The methodology consists of four steps. (1) Blocking: Inventor-patent records are divided into several subsets according to inventors’ names, and similarity is computed between pairs of records within each block. (2) Training sets: We construct matched and unmatched training sets for pairs of matched and unmatched inventors’ full names defined as “rare.” Using a telephone directory, for the period 2000-2012, we define a list of “rare”
names that appear only once or do not appear at all in the telephone directory. (3) Ratio:
We define a “similarity profile (vector),” 𝐱 = (𝑥1 ⋯ 𝑥𝑛), which represents the degree of similarity in inventor and patent attributes between two inventor-patent records, for all inventor-patent record pairs within blocks. For inventor attributes, inventor’s name and address are used. For patent attributes, applicant’s name and ID, the main technology class at the four-digit level of the International Patent Classification (IPC), and the list of co-inventors’ names are used. Applicant names and IDs are both normalized using the National Institute of Science and Technology Policy (NISTEP) Dictionary of Corporate Names, and the NISTEP Dictionary of Names of Universities and Public Organizations, both developed by the National Institute of Science and Technology Policy and publicly available from its website2. The inventor address attribute is also normalized and divided into prefecture (to-do-hu-ken), city (shi-ku-cho-son), district (chi-mei), and street (ban- chi and go) using a commercial geocoding software provided by Kokusai Kogyo Co., Ltd., Address-normalizing converter and geocoding tool. We then calculate the likelihood
“ratio” for each similarity profile from the training set as the ratio of times that a similarity profile appeared in the match set compared to the non-match set. (4) Pairwise matches:
the (posterior) probability of a match between inventor-patent records based on Bayes theorem using the similarity profile and corresponding likelihood ratios. Following Li et al. (2014), we set the prior probability as the inverse of the number of pairs in the block.
2 http://www.nistep.go.jp
4
The minimum threshold for the probability matching pair is set to 0.5. Further detailed explanation regarding the data and method used for patent-inventor disambiguation are described in Appendix 1.
Table 1 presents the results of inventor disambiguation and its estimation accuracy.
We identified 1.71 million inventors from 12.4 million inventor-patent records, which means that the average number of patents per inventor is 7.1. Next, we check the precision of our inventor disambiguation results with the KAKEN Database of Grants-in-Aid for Scientific Research developed by the National Institute of Informatics. In the KAKEN database, all receivers of public research funds from the Japan Society for the Promotion of Science (JSPS) are registered and a reliable identifier for each researcher is available.
For the twelve thousand inventor-patent instances of six thousand inventors extracted from the KAKEN database, we calculate the splitting and lumping error of our disambiguation results following Li et al. (2014). The results show that a splitting error of 2.41% and lumping error of 0.29%. These values indicate that our results are better than Li et al.’s (2014) which has a splitting error of 3.26% and lumping error of 2.34%.
(Table 1)
From the inventor disambiguation results, we extract 62,983 inventors as academia.3 Next, we match these academic inventors with the authors of scientific papers. From the list of scientific papers, derived from the Elsevier Scopus database, we use the papers written by authors whose country of affiliation is Japan. Although the inventor/author’s name and the affiliation are matched, both inventor and applicant names are recorded in Japanese in the IIP patent database but are recorded in English in the Scopus database.
The IIP patent database, however, can be easily mapped with the PATSTAT Database (Worldwide Patent Statistical Database) of the European Patent Office (EPO). Hence, we replace the original inventor name recorded in Japanese with the information of its corresponding record in the PATSTAT. For affiliation information, we use the NISTEP Dictionary of Names of Universities and Public Organizations, and its converter for the
3 The affiliates of inventors are identified by their address information. For example, if an inventor has the same address as the applicant address for the same patent, the inventor is supposedly working for the applicant’s organization. If this is not the case, inventors in a single applicant patent are assigned to the applicant organization. Finally, we conduct text mining for the inventor’s address to identify his/her affiliation (or individual) with other inventors. Here, academic inventors include those working for universities and public research organizations.
5
Scopus database. Among the more than 9.7 million author-affiliation-paper instances in the Scopus database, we could successfully map the affiliation identifier, developed by NISTEP, for 5.3 million Japanese instances. As a result, 30,432 inventors (48.3%) among the 62,983 academic inventors are successfully matched with the authors in the Scopus database based on inventor/author name and applicant/affiliation identifier. However, since the Scopus author ID and the disambiguated inventors do not completely match each other, we combine the inventor/author IDs iteratively until they are uniquely matched. Finally, almost 2,000 inventor IDs are integrated with each other and we obtain 28,433 matched inventors/authors.
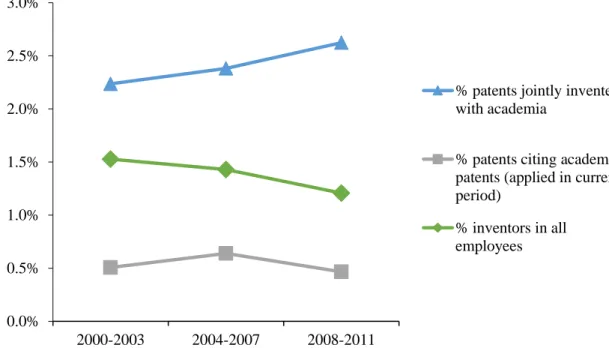
Figure 1 illustrates the number of inventors and academic authors in Japan during the period from 2008 to 2011 based on the matching results. 563 thousand inventors and 382 thousand authors who published a paper in an academic journal were included in the Scopus database. Among the patent inventors, 30.5 thousand inventors are affiliated to academic institutions and 15.6 thousand inventors published at least one paper in Scopus journals.4 In other words, there are 14.9 thousand inventors without any publications in the Scopus database. It is unusual that academic researchers have patents, but no published papers, so we suspect that a substantial number of them have scientific publications, not listed in Scopus, such as research papers in the Japanese language.
(Figure 1)
Table 2 shows the time trend of the information presented in Figure 1. The proportion of academia among inventors increased from 3.2% in the period 2000-2003 to 5.4% in the period 2008-2011. The proportion of academic authors with patent inventions also
4 We could match 37,718 authors in the Scopus database with 30,732 patent inventors. We found a splitting error in the matching results. Several authors are matched to a same inventor or one author is matched with several inventors. Therefore, we merge the authors’ identification numbers and the disambiguated inventors until such splitting errors disappeared. As the result, we finally identify 28,443 unique authors/inventors. Assuming the splitting error, we correct the number of authors identified by Author IDs in Scopus and the number of inventors identified by our disambiguation procedure. The correction rate for the number of authors is 0.754 (= 28,443/37,718), and for the number of inventors is 0.926 (=
28,443/30,732). According to the author identification numbers from Scopus, the number of authors active in the periods 2000 to 2003, 2004 to 2007 and 2008 to 2011 with Japanese affiliations in the Scopus database are 419,086, 472,004, and 506,116, respectively. Multiplying the correction rate 0.754 with those numbers, the corrected numbers of unique authors is 316,031, 355,936, and 381,660, respectively.
Similarly, the number of active inventors in the periods 2000 to 2003, 2004 to 2007, and 2008 to 2011 is 721,054, 667,474, and 602,180, respectively. Multiplying the correction rate 0.926 with those numbers, the corrected numbers are 667,348, 617,759, and 557,328, respectively.
6
increased from 3.0% in 2000-2003 to 4.1% in 2008-2011. Furthermore, the proportion of academic authors to total inventors doubled from 1.4% to 2.8% during the 12-year period.
(Table 2)
2-2. Firm level linkage of the IIP patent database and Economic Census
We aim to link patent information from the IIP Patent Database with establishment census data at the firm level. To this end, we develop a methodology that makes a one-to-one link between patent applicants and organizations in the census data based on establishments’ names and addresses. Firm level linkage is then identified as the linkage to any type of organization defined in the census except for incorporated administrative agencies, unincorporated associations, and other miscellaneous incorporated entities. As in Section 2-1, we focus on non-individual patent applications in which both applicant and inventor addresses are in Japan. The number of the applications from 1964 to 2013 is 10,253,009, and the total number of applicants during this period is 11,038,633. As for the establishment census, the following five datasets are used: the Establishment and Enterprise Census published in 2001, 2004, and 2006, and the Economic Census of Japan published in 2009 and 2012. We link the application data with each of these census datasets. This approach allows us to find the linkage with an applicant organization that existed when either one of the census surveys was conducted. Table 3 shows the total number of establishments in each census dataset and the breakdown by establishment type defined as follows: (1) the head office of a firm with multiple establishments (Headquarter) (2) a branch of a firm with multiple establishments (Branch), and (3) a single unit establishment (Single Est.).
(Table 3)
Since we focus on patent applications by non-individual Japanese applicants, patents are applied from any one of these establishments in Japan. Considering that patent applications are usually managed by an entire organization rather than an individual establishment, we link applicants to the establishments that are the headquarters. To do this, we use a unique organization identifier assigned to all establishments the
7
organization owns. Thus, our methodology links applicant information with the headquarter of a multi-establishment firm, or a single-establishment firm.
In implementing the linking methodology outlined above, we employ name and address information that are available in both the applicant records of IIP patent database and the establishment records of a census. Several issues arise when using these pieces of information. First, the names and addresses of applicants may contain spelling errors, and their format may differ between the applicant and establishment records. To solve for the issue of the same entities being deemed as different due to these notational variations (false negative problem), we develop a series of text processing programs to convert the raw name/address data to its standardized representation. Second, both applicant and establishment addresses undergo changes due to the consolidation of local administrative units such as municipalities. To cope with address changes of this kind, we use the commercial software from Kokusai Kogyo to convert the original addresses to the latest address format (as of 2014). Lastly, while an applicant address is written in a single line, an establishment address in a census is recorded as a collection of five geographical components (prefecture, city or wards, district, street, and any others that follow such as a building name or a room number). To make these different address formats comparable, we develop a text-scanning program to break the single line of an applicant address into these five parts. We then define a list of prefectural names, city (ward) names, district names, and street names to be the standardized representation of address against which the applicant and establishment addresses are compared. The methodology uses these standardized names and addresses to establish a one-to-one link from an applicant to an establishment in operation as of the application date. The implementation consists of the following three steps.
For each patent application, the first step begins by identifying from each census dataset a sample of organizations and their establishments that are in operation as of the patent application date. This requires detailed information about the opening and closing dates of an establishment under the ownership of the organization, which is not available to us. Instead, we observe the first and last census survey years during which the establishment is recorded. Given that that these dates are censored, we define an active period of an establishment as a period spanning from the census year preceding the one in which it is first recorded, to the census year succeeding the one in which it is last recorded5. In each survey, we sample organizations that have at least one establishment
5 Establishments in the 2001 census are assumed as active from the beginning of the application period
8
whose active period includes the patent application date. In the second step, establishments whose names exactly match with, or include, the applicant name are collected to form a set of “candidate” establishments. In the third step, the address of each candidate establishment is matched with the applicant’s address by their components (prefecture, city or ward, district, and street). The extent of overlaps between the four components yields the (geographical) “match level” for each establishment, which indicates geographical accuracy between the addresses of the establishment and the applicant. The procedure links the applicant to the establishment having the finest match level. Next, we look at the organizational identifier of the establishment, and relink it to the headquarter establishment having the same organizational identifier, if it is a branch.
The procedure is completed by linking the applicant with an organization that owns the establishment.
For each patent applicant, we apply this procedure to five census datasets, and obtain five match levels. The applicant is successfully matched with an organization if a single headquarter establishment of the organization is linked in the second step. Otherwise, the procedure fails to create a match. These failures can occur in the following three cases.
(1) In the first step, the candidate establishment set is empty. (2) In the second step, the largest geographical part of the establishment addresses (prefecture) does not match that of the applicant address. (3) In the third step, multiple organizations have been found at the finest match level and thus a single result cannot be identified.
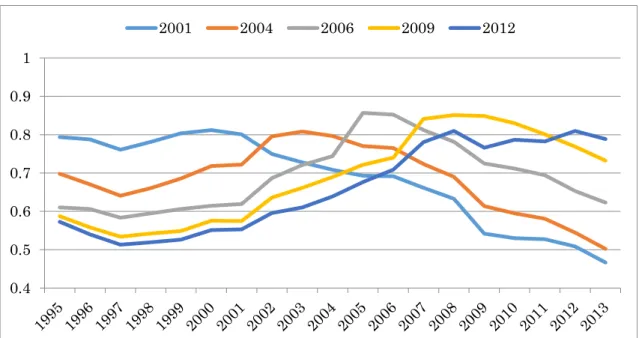
The results from the linking procedure for patent applications between 1964 and 2013 are shown in Table 4. The detailed results for all organizations, including the breakdown by the match levels, are given in Table A2 in Appendix 2. In any census dataset, the linking procedure finds that about 1.4 % of all organizations and 1.5 % of all firms applied for patents. The rate of applicants uniquely linked to organizations in the census data (“Matching Rate”) is highest for the 2001 census data, and decreases for subsequent census datasets. Since we use only establishments that are in operation around a patent application date, the decreasing pattern may reflect that the procedure tends to fail for applications distant from the census survey year.
(Table 4)
(1964), and those in the 2012 census are assumed as active until the end of the application period (2013).
9
To observe this in detail, we analyze the matching rates by application year. Figure 2 shows the results for all organizations. As seen in Figure 2 (a), yearly matching rates exhibit decreasing patterns with their peaks situated around the survey years. Therefore, our linking procedure works well for patent applications around the census year.
(Figure 2a and 2b)
Viewing the results of the whole application period, shown in Figure 2 (b), the matching rates are observed to be low overall for old patent applications, except for the 2001 census data. We also confirm that the procedure using the later years’ census yields lower matching rates for older patent applications. Regarding the 2001 census, it is noted that all establishments in the census are assumed to be active from 1964 in the first step of the procedure (see footnote 2). Therefore, the result may contain over-matched applicant-establishment links6.
Lastly, we assess the quality of the linking procedure. As shown in Figure 2, the matching rates are high for patents applied around the census years, and low for patent applications away from the census years. Therefore, matching rates may not be a consistent indicator of the quality of the linking procedure. Instead, we look at patent applications and applicants that failed to establish a link among all census datasets. These applicants include organizations that applied for patents and did not exist before 2001, those that existed only between the census years, or those mistakenly judged as failures by implementation errors. Table 5 shows these failure cases for the whole application period. While a considerable number of patent applicants (86,119) have not been found in the census data, their applications account for about 12% of the total patent applications.
Therefore, it can be concluded that a majority of patent applications are successfully linked to organizations included in either one of the census datasets.
(Table 5)
6 Yearly matching rates for firms exhibit similar decreasing patterns (See Figure A2 in Appendix 2).
10
3. New Indicators of Science and Industry Linkage 3-1. Framework of indicators
Figure 3 illustrates the relationship between the dataset and the indicators. In the previous section, the methodology of two kinds of data linkages are presented, i.e., academic researcher level linkage between Scopus research papers and the IIP patent database patent applications (subsection 2.1), and firm level linkage between patent applicants (IIP patent database) and economic census data (subsection 2.2). NPL citations of patents, a typical method used to measure science linkage in the existing literature, is based on a firm’s patent citations of scientific publications in the academic sector.7 In this paper, we propose new indicators for science-industry linkage, using the interactions between the industry and the academia in patenting activities, i.e., joint inventive activities (captured by joint patent inventions) and firms’ patent citations to academic patents. Such interaction information regarding the patenting activities of both sectors, together with the datasets created in the previous section, allow us to link the scientific activities of the academic sector (number of papers by academic field) to industrial activities of the firm sector (number of employment).
(Figure 3)
Our new indicators can capture the mechanism of involving scientific knowledge in industrial innovation via patenting. Universities and PRIs, heavily funded by public R&D, are principally research organizations providing scientific publications as an output of their research. However, there is a growing global trend of patent applications from these institutes (OECD, 2013). In Japan, national universities, which used to be government organizations, became independent agencies in 2014. This institutional reform allows them to claim patent rights, and university patent applications have increased significantly (Motohashi and Muramatsu, 2012). Therefore, a patent-based science linkage indicator has become increasingly important. Additionally, due to the nature of the patent system,
7 Additionally, there are some scientific papers, published by industry researchers (outside the higher education institutes (HEIs) and PRIs sectors), but its contribution to total publications is relatively small.
In 2010, the number of papers involving industry researchers in Scopus is only about 12,000 (4,500 papers by solely industry researchers and 7,400 papers of joint publication of academia and industry), out of 95,000 total papers.
11
patent citation information is more reliable than NPL citations. NPL includes not only scientific papers, but also non-scientific materials such as technical documents, while patent information reflects a uniform set of technological contents, based on formal institutions under the patent law. Therefore, our new indicator will provide reliable information on science linkage indicators compared to NPL, although it cannot completely substitute NPL due to the differences in their concepts.
3-2. Implementation
As mentioned above, we propose new indicators for science-industry linkage, based on the information on firms’ joint patent inventions with academia, and on firms’ patent citations to academic patents. These two channels of linkage between science and industry are not measured by the existing indicator, NPL citations of industry patents. Similar to the indicators based on NPL citations, our indicators are also measured by the number of scientific publications utilized by firms, i.e., the number of publications by academic inventors with whom the firm jointly developed a patent and/or whose patent the firm cites in its patent.
We divided the whole observation period (2000-2011) into three sub-periods, 2000- 2003, 2004-2007, and 2008-2011. Next, we assume that all patents invented by an academic researcher within a particular sub-period are related to scientific papers published within the same period. This approach is different from previous studies that find equivalent patents and papers by analyzing their contents in detail (Lissoni et. al, 2012; Magerman et al., 2015). Our goal is to develop indicators of science intensity for all industries, based on large-scale datasets, so that the effort of analyzing the contents of patents and papers individually is not feasible. Additionally, since the scientific exploration of academics has broad scope, it would be reasonable to assume that the contents of patents and papers by the same researcher are related to some degree.
Next, the linkage between academic researchers and firms is measured based on academic patents, either jointly applied with a firm or cited by a firm’s patent within the same sub-period. We do not consider citations beyond the sub-period to ensure the same citation window across sub-periods.8 Therefore, it should be noted that our indicator reflects only the recent interactions between science and industry, while NPL indicators consider all citations of scientific papers.
8 We could use a longer citation window, but the data is limited, since SCOPUS information is available only from 1995, and is not reliable before 2000.
12
Suppose that 𝑖 is an industry; 𝑠 is a science field; 𝑡 is a technology class; 𝑓 ∈ 𝐹𝑖(𝑑) is a firm active in an industry 𝑖 in period 𝑑; 𝑗 ∈ 𝑉𝑓(𝑑) is an industrial inventor affiliated to firm 𝑓 in period 𝑑 ; 𝑟 is an academic researcher active in period 𝑑 ; 𝑝𝑗,𝑟Joint(𝑑) is the number of patents jointly invented by inventor 𝑗 and researcher 𝑟 in period 𝑑; 𝑝𝑗,𝑟Cite(𝑑) is the number of patents invented by the academic researcher 𝑟 in period 𝑑 cited in patents invented by inventor 𝑗 in period 𝑑 ; and 𝑛𝑟,𝑠(𝑑) is the number of academic publications of researcher 𝑟 in a science field 𝑠 in period 𝑑.
First, we define the amount of new scientific knowledge (SK) utilized by inventors in firms through joint inventions with academia (Joint) and/or academic patent citations (Cite). Using our dataset, linking patent inventors and authors of scientific publications makes it possible to identify scientific publications of academic patent inventors. We measure SK utilized by inventors in firms based on the number of academic publications (𝑛) made by their joint inventors or inventors of patents they cite. Specifically, we define the amount of new SK in the science field 𝑠 created by academic researchers utilized by industrial inventor 𝑗 via (1) only joint inventions with academic inventors (SK𝑗,𝑠JointOnly);
(2) only patent citation to patents developed by academic inventors (SK𝑗,𝑠CiteOnly); and (3) both joint invention and patent citation (SK𝑗,𝑠JointCite) as:
SK𝑗,𝑠JointOnly(𝑑) = ∑ I[𝑝𝑗,𝑟Joint(𝑑) > 0]×I[𝑝𝑗,𝑟Cite(𝑑) = 0]×𝑛𝑟,𝑠(𝑑)
𝑟∈𝑅
SK𝑗,𝑠CiteOnly(𝑑) = ∑ I[𝑝𝑗,𝑟Joint(𝑑) = 0]×I[𝑝𝑗,𝑟Cite(𝑑) > 0]×𝑛𝑟,𝑠(𝑑)
𝑟∈𝑅
SK𝑗,𝑠JointCite(𝑑) = ∑ I[𝑝𝑗,𝑟Joint(𝑑) > 0]×I[𝑝𝑗,𝑟Cite(𝑑) > 0]×𝑛𝑟,𝑠(𝑑)
𝑟∈𝑅
where:
𝑅 : Set of all academic inventors (including academic inventors unmatched with authors in Scopus).
𝑛𝑟,𝑠 (d): Number of academic publications of researchers 𝑟 in science field s in period 𝑑.
𝑝𝑗,𝑟Joint(𝑑) : Number of patents jointly invented by inventor 𝑗 and researcher 𝑟 in
13
period 𝑑.
𝑝𝑗,𝑟Cite(𝑑) : Number of patents invented by academic inventor 𝑟 in period 𝑑 and cited by patents invented by industrial inventor 𝑗 in period 𝑑.
Since we could not match all academic inventors to authors in the Scopus database, the number of academic publications by unmatched academic inventors is unknown.
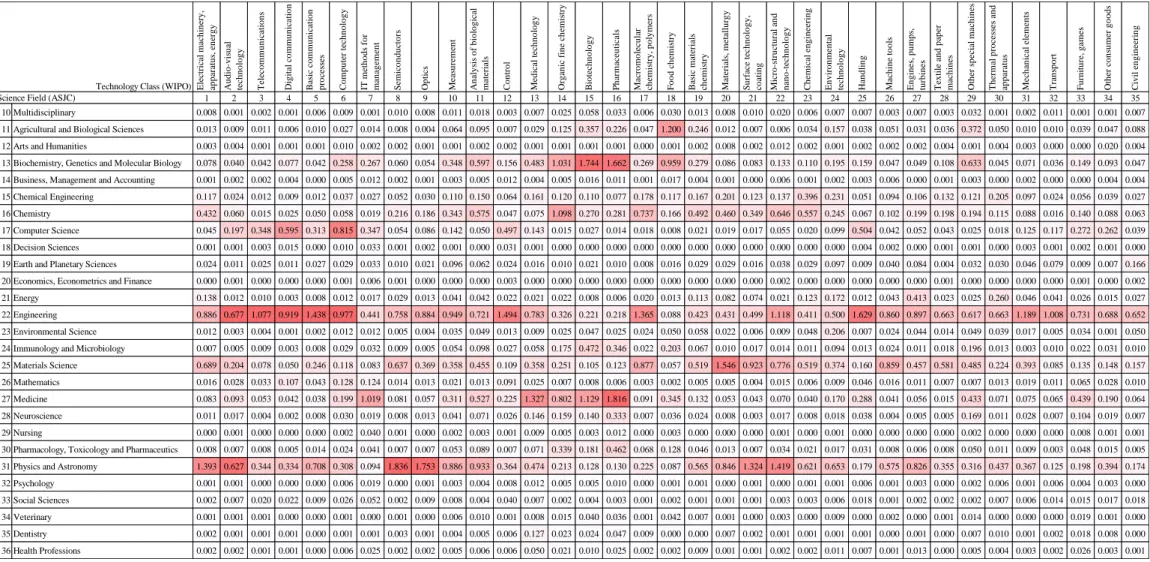
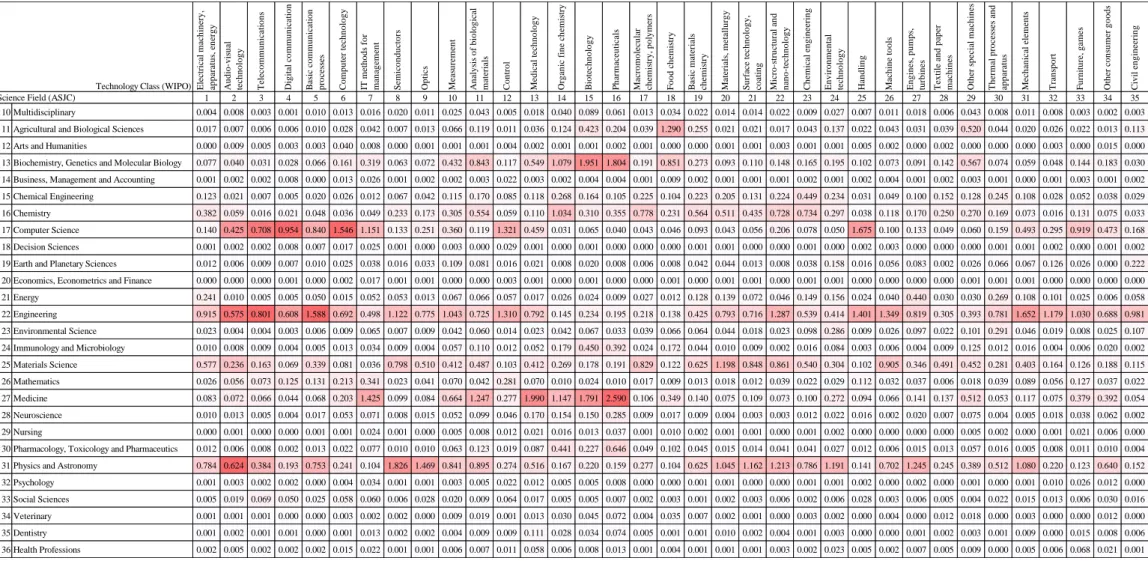
Therefore, we impute 𝑛𝑟,𝑠(𝑑) for academic inventors unmatched with Scopus based on the relationship between patents and publications of academic inventors matched with Scopus database. Denoting 𝑅𝑀 and 𝑅𝑈 as the set of researchers matched and unmatched with the Scopus database respectively, we estimate the number of academic publications by unmatched researcher 𝑟′∈ 𝑅𝑈 in science field 𝑠 published in period 𝑑, by,
𝑛̂𝑟′,𝑠(𝑑) = ∑ 𝑝𝑟All′,𝑡(𝑑)×𝑛̅𝑡,𝑠(𝑑)
𝑡∈𝑇
, 𝑟′∈ 𝑅𝑈
where 𝑝𝑟All′,𝑡(𝑑) is the number of patents invented by academic researcher 𝑟′ in period 𝑡 and 𝑛̅𝑡,𝑠(𝑑) represents the average number of academic publications in science field 𝑠 published in period 𝑑 per patent of technology class 𝑡 invented in period 𝑑 which is defined by:
𝑛̅𝑡,𝑠(𝑑) =
∑ 𝑛𝑟,𝑠(𝑑)×𝑝𝑟,𝑡All(𝑑) 𝑝𝑟All(𝑑)
𝑟∈𝑅𝑀
∑𝑟∈𝑅𝑀𝑝𝑟,𝑡All(𝑑) Tables 6a to 6c show the estimated value of 𝑛̅𝑡,𝑠(𝑑).
(Table 6a, 6b and 6c)
Next, we define the industry-level scientific intensity as the total SK in science field 𝑠 utilized by industrial inventors affiliated to firms in industry 𝑖 divided by the number of inventors (𝐼𝑁𝑉𝑖(𝑑)) or the number of employees (𝐸𝑀𝑃𝑖(𝑑)) in the industry:
SIINV𝑖𝑋(𝑑) = ∑𝑓∈𝐹𝑖(𝑑)∑𝑗∈𝑉𝑓(𝑑)[SK𝑗,𝑠𝑋(𝑑)]
𝐼𝑁𝑉𝑖(𝑑) for 𝑋 = JointOnly, JointCite, CiteOnly.
14
SIEMP𝑖𝑋(𝑑) =∑𝑓∈𝐹𝑖(𝑑)∑𝑗∈𝑉𝑓(𝑑)[SK𝑗,𝑠𝑋(𝑑)]
𝐸𝑀𝑃𝑖(𝑑) = SIINV𝑖𝑋(𝑑)× 𝐼𝑁𝑉𝑖(𝑑) 𝐸𝑀𝑃𝑖(𝑑)
for 𝑋 = JointOnly, JointCite, CiteOnly.
where 𝐼𝑁𝑉𝑖(𝑑) is the number of inventors affiliated to firms in industry 𝑖 and 𝐸𝑀𝑃𝑖(𝑑) is the total number of employees affiliated to firms in industry 𝑖.
Finally, we define an indicator from the viewpoint of science as the amount of utilized scientific knowledge (USK) in science field 𝑠 of academic researcher 𝑟 by industrial inventors via only joint invention with industrial inventors, via only citations by industrial patents, and via both joint inventions and citations as:
USK𝑟,𝑠JointOnly(𝑑) = I[𝑝𝑟Joint(𝑑) > 0]×I[𝑝𝑟Cite(𝑑) = 0]×𝑛𝑟,𝑠(𝑑),
USK𝑟,𝑠CiteOnly(𝑑) = I[𝑝𝑟Joint(𝑑) = 0]×I[𝑝𝑟Cite(𝑑) > 0]×𝑛𝑟,𝑠(𝑑), and
USK𝑟,𝑠JointCite(𝑑) = I[𝑝𝑟Joint(𝑑) > 0]×I[𝑝𝑟Cite(𝑑) > 0]×𝑛𝑟,𝑠(𝑑).
where 𝑝𝑟Joint(𝑑) is the number of patents jointly invented by academic researcher 𝑟 and industrial inventors, and 𝑝𝑟Cite(𝑑) is the number of patents invented by academic researcher 𝑟 cited by industrial inventors. Using the USK, we define the utilization rate of science knowledge (URSK) in field 𝑠 as:
URSK𝑠𝑋(𝑑) =∑𝑟∈𝑅USK𝑟,𝑠𝑋 (𝑑)
𝑁𝑠(𝑑) for 𝑋 = JointOnly, JointCite, CiteOnly.
where 𝑁𝑠(𝑑) is the number of total scientific publications (including the publications of non-inventor pure scientists). Thus, this indicator measures the share of the number of academic inventors’ science publications linked to industrial inventors through patenting activities in all academic publications.
4. Results
4-1. Empirical findings
Figure 4 shows the aggregated trend of academic involvement in industry innovation. It shows that both the shares of academia-industry joint applications and patents citing academic patents increased from 2000-2003 (Time I) to 2004-2007 (Time II). In subsequent periods (from Time II to Time III, 2008-2011), the share of joint applications
15
increased further, while the share of patents citing academic patents decreased.
Additionally, the number of inventors per employee (reflecting R&D intensity) decreased over time in the industry sector.
(Figure 4)
Figures 5-7 present the aggregated indicators described in the previous section.
Specifically, Figure 5 and 6 shows the investor-based science intensity (SIINV) and employee-based science intensity (SIEMP) respectively, and Figure 7 shows the industry breakdown of SIEMP as indicators of science intensity in industry.
The SIINV increased from Time I to Time II, by increasing both joint inventions and academic patent citations. After the incorporation of Japan’s national universities in 2004, academic patent applications increased substantially. Moreover, industry-university collaboration activities have been promoted for over 10 years, which has contributed to the increase in science intensity indicators after 2004. However, the total intensity did not change at 249 from Time II to Time III. Looking at the indicators, science intensity due to academic patent citations decreases, while that due to joint inventions increased. It should be noted that the citation indicator is calculated by taking into account only cited (academic) patents applied within the same period. Therefore, a decrease in this indicator means that the academic patents in Time III are less likely to be cited by industry, as compared to those in Time II.9
(Figure 5)
The SIEMP (science intensity by total employment) decreased from Time II to Time III. The difference in the rate of decline between SIEMP (20%, from 3.6 to 3.0) and SIINV (0% unchanged from 249) is due to the decreasing ratio of number of inventors to total employment. During Time III, firms cut their R&D spending, responding to the economic downturn after the financial crisis in 2008, which is the reason decreased inventive
9 It is possible to consider the information for cited academic patents in previous periods as well, instead of just using the ones cited in the same period as the academic patents. However, our datasets start from 1995, so data truncation prevents us from make a fair inter-temporal comparison if we used all cited academic patents.