Research Report
General Series No.85
A STUDY OF THE JAPANESE NATIONAL CHARACTER :
THE TENTH NATIONWIDE
SURVEY (1998)
English Edition
Yoshiyuki Sakamoto Takahiro Tsuchiya
Takashi Nakamura Tadahiko Maeda
David B. Fouse Research Conrmittee
on the Study of the Japanese National Character
November 2000
The Institute of Statistical Mathematics
any information storage and retrieval system, without permission in writing from the institute,
The Institute of Statistical Mathematics (T6KEI SORI KENKYOZYO)
4'6'7 Minami'Azabu, Minato-ku Tokyo 106-8569, Japan
(c) The Institute of Statistical Mathematics
Research Report
General Series No.85
NATIONAL CHARACTER : THE TENTH NATIONWIDE
SURVEY (1998)
English Edition
Yoshiyuki Sakamoto Takahiro Tsuchiya
Takashi Nakamura Tadahiko Maeda David B. Fouse
Research Conrmittee
on the Study of the Japanese National Character
November 2000
The Institute of Statistical Mathematics
Yoshiyuki Sakamoto (Coordinator), Prof., Inst. Statist, Math.
GiichiroSuzuki, Prof., Inst,Statist.Math.
MasakatsuMurakami, Prof., Inst,Statist.Math.
YasumasaBaba, Prof., Inst.Statist.Math, TakashiNakamura, Prof., Inst.Statist.Math.
RyozoYoshino, Assoc.Prof., Inst.Statist.Math.
TakahiroTsuchiya, Assoc.Prof., Inst.Statist.Math.
Yuejun Zheng, Assist.Prof., Inst. Statist. Math.
Tadahiko Maeda, Assist.Prof., Inst. Statist, Math.
Chikio Hayashi, Prof. Emeritus, Inst. Statist. Math.
Sigeki Nisihira, Prof. Emeritus, Inst. Statist. Math.
Tatsuzo Suzuki, Prof. Emeritus, Inst. Statist, Math,
TsutomuKomazawa, Prof.Emeritus, Inst.Statist.Math.
FumiHayashi, Prof., ToyoEiwaUniversity
All communications concerning this report should be addressed to:
Prof. Y. Sakamoto,
The Institute of Statistical Mathematics
,
4-6-7 Minami-Azabu, Minato-ku, Tokyo 106-8569 JAPAN
(FAX: +81-3-5421-8732, E-mail: [email protected])
CONTENTS
I. OUTLINE OF THE STUDY
g 1 Past and present studies ...,...•.••••••
g2 Sampling and interviewing methods ...,...
S3 References ...,...
1 1
7
II. QUESTIONS AND SIMPLE TABULATIONS
Abbreviation ..,...,...
Criterion for choosing translated questions ...
Notes for tables ..,,...,...
g1 Demographic data and respondents ...,,...
g2 Attitudes toward life and environment ...,...
S3 Religion ...,...,...,...
g4 Children and Family ...••••••••••••-••
g 5 Face-to-face social groups ...,.
g6 Men and women ...••••••••••••••••••- S7 General social problems ...,..,..,...
g 8 Attitudes toward politics ...
g 9 Race and the Japanese people ...
.13 .13 .14 ,15 .22 .53 .57 .63 .79 .91 112 119
APPENDIX
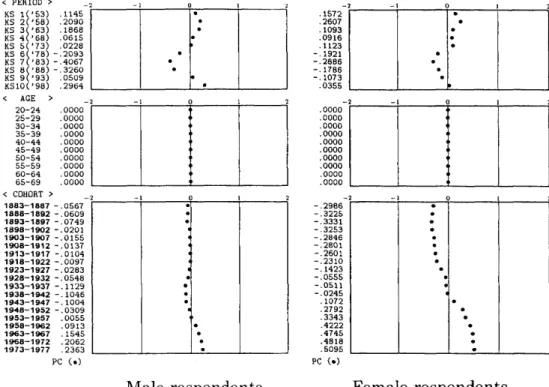
Statistical research of the Japanese national character: General
trends in attitude over the latter half of the twentieth century ...,,...,.... 129
gl Past and Present Studies
The Research Committee originated the study of the Japanese national character with the first nationwide survey in 1953. Since then, a similar statistical survey has been conducted every five years, for a total of ten surveys,
Each survey has been carried out using a face-to-face interviewing method with sam- ples of 3,OOO to 6,OOO Japanese nationals, aged 20 and over. Samples were selected by stratified three-stage sampling.
In each survey, the questionnaire contained approximately 50 items, most of them being similar to those utilized in the previous surveys. However, since 1973 two different types of questionnaires have been used, One consists of items used in preceding surveys
(referred to as `K-type'), the other consists mainly of new items (referred to as `M-type').
Also in the tenth survey, these two types of questionnaire were used, and each question- naire was administered to one half of the total number of respondents. All the questions in the K-type questionnaire had previously appeared in the questionnaires of one or more of the previous surveys, most of them having been common to all surveys. In contrast, the majority of questions in the M-type questionnaire were developed after 1973. These items were formulated for the following reasons:
(a) It was thought that the content of some of the questions might be outdated or no longer adequate, because over 45 years had passed since the original questionnaire items were formulated.
(b) New questions were needed to facilitate the analysis of future attitude trends.
Thus the latest tenth survey has two major objectives. One is to clarify what aspects of people's ways of thinking have changed over the latter half of the twentieth century, based on the analysis of responses to questions asked repeatedly over this period. The other objective is to investigate new aspects of attitude trends in Japan.
g2 SamplingandInterviewi'ngMethods
Selection of the sample of each survey was carried out by the stratified three-stage probability sampling method. First, boroughs, cities, towns and villages were stratified, taking into consideration district, population size (or number of voters) and other factors.
From each stratum one administrative district was randomly chosen, with the probability of selection being proportionate to the size of population (or number of voters). In the tenth survey, 300 administrative districts were thus selected (Stage 1). Second, from each of the randomly selected administrative districts, one voting district was selected in the same way (Stage 2). Finally, from voter lists in the voting districts selected,
respondents were chosen by means of systematic random sampling (Stage 3). A total of 4,200 respondents were drawn for the tenth survey,
Surveys up to the eighth one were carried out with the cooperation of many univer- sities, After those survey districts had been assigned to the universities, members of the Committee visited these universities and gave instructions to student interviewers.
2 L 0UTLINE OF THE STUDY
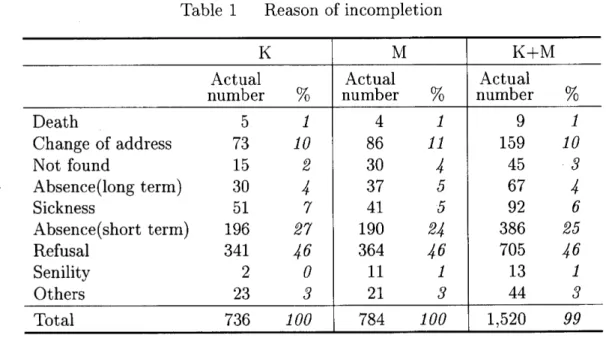
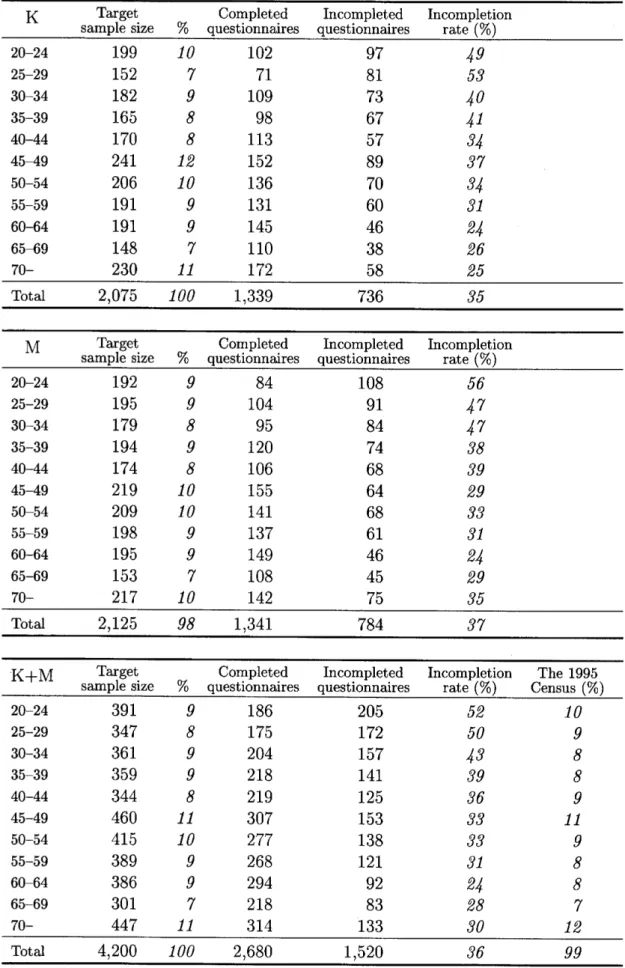
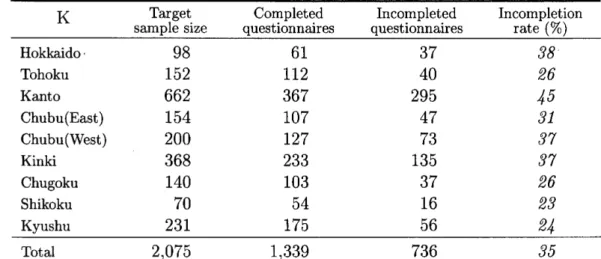
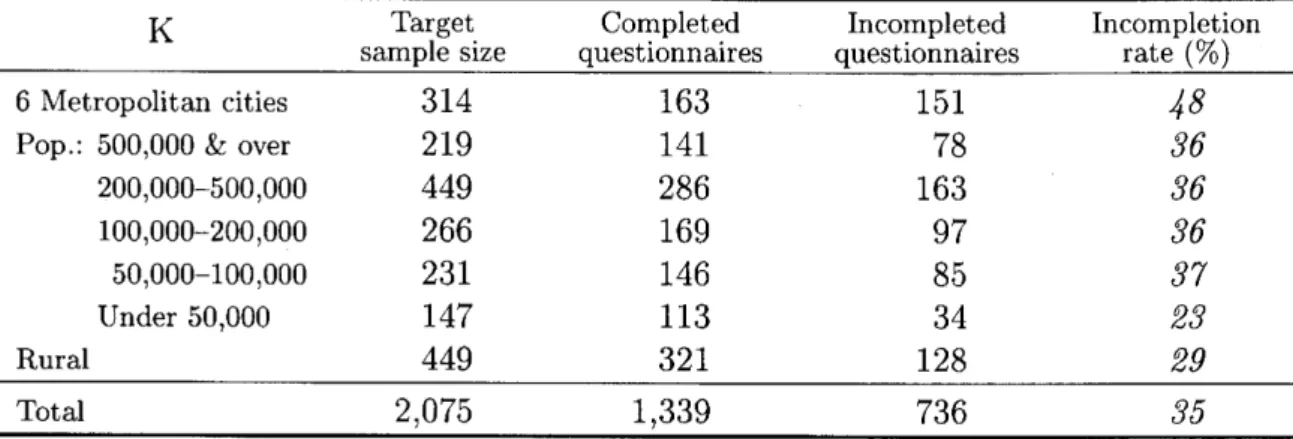
However, the ninth and tenth surveys were conducted with the cooperation of Central Research Services, Inc.. In either case the interviewers were responsible for randomly se- lecting sample from voter lists according to a specified procedure. (There was an average of 14 respondents for each district in the tenth survey.) Interviewers then conducted inter- views in the respondents' homes and recorded the responses on the interview schedules. In the case of the tenth survey, out of the target sample of size 4,200, 2,680 were completed, a completion rate of 64oro, (The details of the incompletion rate are summarized in Tables 1 to 5.)
The questions and simple tabulations of responses in these ten nationwide surveys are summarized in the fo11owing chapter.
As shown on the cover, the authors of this report are Yoshiyuki Sakamoto, Takahiro Tsuchiya, Takashi Nakamura, Tadahiko Maeda and David B, Fouse. David B. Fouse is a student of the School of Mathematical and Physical Science, the Graduate University for Advanced Studies.
Ms. S. Miyazaki, Ms. J. Kurihara and Ms. K. Itoh helped edit this report and typed it. The authors are very gratefu1 for their assistance.
Table 1 Reason of incompletion
K M K+M
Actual Actual Actual
number % number 91o number %
Death 5 1 4 1 9 1
Changeofaddress 73 10 86 11 159 10
Notfound 15 2 30 4 45 3
Absence(longterm) 30 4 37 5 67 4
Sickness 51 7 41 5 92 6
Absence(shortterm) 196 27 190 24 386 25
Refusal 341 46 364 46 705 46
Senility 2 0 11 1 13 1
Others 23 3 21 3 44 3
Total 736 100 784 100 1,520 99
Table 2 Incompletion rate (by gender)
K Targetsample size
Completed 9o questionnaires
Incompleted questlonnqlres
Incompletion rate (%) Male
Female
1,O14 1,061
49 51
615 724
399 337
99 32
Total 2,075 100 1,339 736 35
M Targetsample size
Completed
% questionnaires
Incompleted questionnaires
Incompletion rate (%) Male
Female
1,021 1,104
48 52
601 740
420 364
41 33
Total 2,125 100 1,341 784 37
K+M Targetsample size
Completed
% questionnaires
Incompleted questlonnalres
Incompletion rate (%)
The 1995 Census (%) Male
Female
2,035 2,165
48 52
1,216 1,464
819 701
40 32
49
51
Total 4,200 100 2,680 1,520 36 1OO
4 I. OUTLINE OF THE STUDY
Table 3 Incompletion rate (by age)
K Targetsample size % Completedquestionnaires
Incompleted questionnaires
Incompletion rate (%) 20-24
25-29 30-34 35-39 40-44 45-49 50-54 55-59
6064 6569
70-
199 152 182 165 170 241 206 191 191 148 230
10 7 9 8 8 12 10 9 9 7 11
102 71 109 98 113 152 136 131 145 110 172
97 81 73 67 57 89 70 60 46 38 58
49 53 40 41 34
37
34 31 24 26 25
Total 2,075 100 1,339 736 35
M Targetsample size 9(o Completed
questionnaires
Incompleted questionnaires
Incompletion rate (%) 20-24
25-29 30-34 35-39 40-44 45-49 50-54 55-59 60-64 65-69 70-
192 195 179 194 174 219 209 l98 195 153 217
9 9 8 9 8 10 10 9 9 7 10
84 104 95 120 106 155 141 137 149 108 142
108 91 84 74 68 64 68 61 46 45 75
56 47 47 38 39 29 33 31 24 29 35
Total 2,125 98 1,341 784 97
K+M Targetsample size sp(o Completed
questionnaires
Incompleted questionnaires
Incompletion rate (%)
The 1995 Census (%) 20-24
25-29 30-34 35-39 40-44 45-49 50-54 55-59 6e-64 65-69 70-
391 347 361 359 344 460 415 389 386 301 447
9 8 9 9 8 11 10 9 9 7 11
186 175 204 218 219 307 277 268 294 218 314
205 172 157 141 125 153 138 121 92 83 133
52 50 43 39 36 33 33 31 24 28 30
10 9 8 8 9 11 9 8 8 7 12
Tota[t 4,200 100 2,680 l,520 36 99
Table 4 Incompletion rate (by regional distribution)
K Targetsample size Completed
questionnaires
Incompleted questlonnalres
Incompletion rate (ero)
Hokkaido -
Tohoku Kanto Chubu(East) Chubu(West) Kinki
Chugoku Shikoku Kyushu
98 152 662 154 200 368 140 70 231
61 112 367 107 127 233 103 54 175
37 40 295 47 73 135 37 16 56
98•
26 45 31 37 97 26 23 24
Tot al 2,075 1,339 736 35
M Targetsample size
Completed
questionnaires
Incompleted questionnaires
Incompletion rate (%) Hokkaido
Tohoku Kanto Chubu(East) Chubu(West) Kinki
Chugoku Shikoku Kyushu
99 155 686 157 204 374 144 71 235
68 104 363 108- 140 236 107 48
167
31 51 323 49 64 138 37 23 68
31 39 47
31 31
37 26 32 29
Total 2,125 1,341 784 37
K+M Targetsample size
Completed
questionnaires
Incompleted questlonnalres
Incompletion rate (oro)
Hokkaido Tohoku Kanto Chubu(East) Chubu(West) Kinki
Chugoku Shikoku Kyushu
197 307
1,348
311 404 742 284 141 466
129 216 730 215 267 469 210 102 342
68 91 618 96 137 273 74 39 124
35 30 46
31 34 37 26 28 27
Total 4,200 2,680 1,520 36
6 L OUTLINIEOFTHE STUDY
Table 5 Incompletion rate (by urban vs. rural)
K Targetsample size Completed
questlonnalres
Incompleted questlonnalres
Incompletion rate (%) 6 Metropolitan cities
Pop.: 500,OOO & over 200,OOO-500,OOO 100,OOO-200,OOO 50,OOO-100,OOO Under 50,OOO Rural
314 219 449 266 231 147 449
163 141 286 169 146 113 321
151 78 163 97 85 34 128
48 S6 S6 36 37 23 29
Total 2,075 1,339 736 35
M Targetsample size Completed
questlonnalres
Incompleted questionnaires
Incompletion rate (ero)
6 Metropolitan cities Pop.: 500,OOO & over 200,OOO-500,OOO 100,OOO-200,OOO 50,OOO-100,OOO Under 50,OOO Rural
336 227 461 266 232 147 456
156 133 300 170 156 95 331
180 94 161 96 76 52 125
54 41 35 36 33 35 27
Tot al 2,125 1,341 784 37
K+M Targetsample size Completed
questlonnalres
Incompleted questionnaires
Incompletion rate (%) 6 Metropolitan cities
Pop.: 500,OOO & over 200,OOO-500,OOO 100,OOO-200,OOO 50,OOO-100,OOO Under 50,OOO Rural
650 446 910 532 463 294 905
319 274 586 339 302 208 652
331 172 324 193 161 86 253
51 39 36 36 35 29 28
Total 4,200 2,680 1,520 36
1. Hayashi, C. et al. (1960). A Study of Japanese ]iYational Character, Ann. Inst. Statist.
Math., Sup. I, 1-30.
2. Hayashi, C. et al. (1960). A Study of Japanese National Character-Part II-, Ann. Inst.
Statist. Math., Sup. II, 1•-30.
3. Research Committee on the Study of Japanese National Character (1961). Nipponjin no Kokuminsei (A study of the Japanese National Character), Shiseido, Tokyo. (in Japanese with English summary)
4. Suzuki, T. (1966). A Study of the Japanese National Character-Part III, The Third Survey, Ann. Inst. Statist. Math., Sup. IV, 15-64.
5. Research Committee on the Study ofJapanese National Character (1970). Dai 2 Nipponjin no Kokuminsei (A study of the Japanese National Character, No.2), Shiseido, Tokyo. (in Japanese with English summary)
6. Nisihira, S. (1970). Les Attitudes des Japonais envers la Religion, Ann. Inst. Statist. Math., Sup. 6, 81-94.
7. Suzuki, T. (1970). A Study of the Japanese National Character-Part IV-, Ann. Inst.
Statist. Math., Sup. 6, 1-80.
8. Hayashi, C. (1972). The Japanese National Character, Abstract Guide of XXth Interna- tional Congress of Psychology, 1982 Tokyo, 46-47.
9. Suzuki, T., Hayashi, C., Nisihira, S., Aoyama, H., Nomoto, K., Kuroda, Y. and Kuroda, A.
K. (1972). A Study of Japanese-Americans in Honolulu, Hawaii, Ann. Inst. Statist. Math., Sup. 7, 1-60.
10. Hayashi, C. (1974). Time, Age and Ways of Thinking-From the Kokuminsei Surveys, Journal of Asian and African Studies, Vol. X, No. 1 & 2, 75-85.
11. Hayashi, C. and Suzuki, T. (1974). Quantitative Approach to a Cross-Societal Research;
A Comparative Study of Japanese Character, Part I, Ann. Inst. Statist. Math., Vol. 26, No. 3, 455-516.
12. Nisihira, S. (1974). Changed and Unchanged Characteristics ofthe Japanese, Japan Echo, Vol. I, No. 2, 22-32.
13. Sakamoto, Y. (1974). A Study of the Japanese National Character-Part V, Ann. Jnst.
Statist. Math., Sup. 8, 1-57.
14. Research Committee on the Study ofJapanese National Character (1975). Dai 3 Nipponjin no Kokuminsei (A study of the Japanese National Character, No.3), Shiseido, Tokyo. (in Japanese with English summary)
15. Hayashi, C. (1975). Time, Age and Ways of Thinking-From the Kokuminsei Surveys, in Adult Episode in Japan (ed. Plath, D. W.), E. J. Bril, Leiden, 75-85.
16. Hayashi, C. and Suzuki, T. (1975). Quantitative Approach to a Cross-Societal Research;
A Comparative Study of Japanese Character, Part II, Ann. Inst. Statist. Math., Vol. 27, No. 1, 1-32.
17. Research Committee on the Study of the Japanese National Character (1977). Changing Japanese Value-Statistieal Surveys and Analyses-, Inst. Statist. .NIath.
18. Hayashi, C. (1977). Changes in Japanese Thought during the Past Twenty Years, Text of Seminar in the U. S. (March 1977?, "Nihonjin Kenkyukai Changing Values in Modern Japan", 3-57.
19. Suzuki, T. and Jitodai, T. T. (1977). Migration and Prefectural Identificat/ion in Four Japanese Prefectures, Ann. Inst. Statist. Math., Vol. 29, No. 3, B, 511-525.
8 L OUTLIIZVE OF THE STUDY
20. Suzuki, T. and Kuroda, Y. (1977). A Note on Immigrants to Hawaii, in A Comparative Sociologieal Study on the Adaptation and Attdtude Change of Asian Emigrants (Migration Research Series No. 1), Dept. of Sociology, The University of Tsukuba, 30-39.
21. Hayashi, C. (1978). Japanese Attitude and Party Preference, Japan Echo, Vol. 5, Special Issue, 58-81.
22. Hayashi, C. (1978). Nationality, in Social Psychology in Japan (ed. Misumi, J.), Osaka University, 674-675.
23. Kuroda, Y., Suzuki, T. and Hayashi, C. (1978). A Cross-National Analysis ofthe Japanese Character among Japanese--Americans in Honolulu, Ethnicity, Vol. 5, 42-59.
24. Hayashi, C. (1980). Data Analysis in a Comparative Study, in Data Analysis and Infor- matics (eds. Deday, E. et al., North-Holland, 31-51.
25. Leghorn, R. Y. and Suzuki, T. (1980). Age, Sex and Cohort: Explicating Social Change in Post-War Japan, Proceedings of Kyoto American Studies Summer Se7ninar, Doshisha University, 95-124.
26. Research Committee on the Study of Honolulu Residents (1980). Honolulu Residents and Their Attitudes in Multi-Ethnic Perspective: Toward a Theory of the American National Character, The ISM Monograph 1. The University Press of Hawaii.
27. Suzuki, T. (1980). Pitfalls in Cross-Cultural Survey Research: Comparative Study of Value Systems in Japan and the United States, Proceedings of Symposium on Research Funded by the Toyota Foundation, "The Japanese and the Americans: Significance, Methodology and Possibilities of International Comparative Studies", Toyota Foundation, 97-101.
28. Research Committee on the Study of Japanese National Character (1982). Dai 4 IVipponl'in no Kokuminsei (A study of the Japanese National Character, No.4), Idemitsu Shoten, Tokyo. (in Japanese with English summary)
29. Hayashi, C. (1983). International Understanding through Broadcasting and the Basic Structure of the Social Behavior of People, HBF News Letter, ISSUE No. 16, May, 35- 49.
30. Hayashi, C., Suzuki, T. and Hayashi, F. (1984). Comparative Study ofLifestyle and Quality of Life: Japan and France, Behavio' rmetrika, No. 15, 1-17.
31. Hayashi, C. and Suzuki, T. (1984). Changes in Belief Systems, Quality of Life Issues and Social Conditions over 25 Years in Post-War Japan, Ann. Inst. Statist. Math., Part B, Vol. 36, No. 1, 135-161.
32. The Research Committee on the Study of Japanese Americans in Honolulu, Hawaii (1984).
Honolulu's Japanese Americans in Comparative Perspective, The ISM Monograph 2. The University Press of Hawaii.
33. Suzuki, T. (1984). Ways of Life and Social Milieus in Japan and the United States: A Comparative Study, Behaviormetrika, No. 15, 77-108.
34. Hayashi, C., Hayashi, F., Suzuki, T., Lebart, L. and Kuroda, Y. (1985). Comparative Study of Quality of Life and Multidimensional Data Analysis: Japan, France and the U.
S.(Hawaii), in Fourth International Symposium, Data Analysis and Informatics (Versailles, France, Oct., 1985?, INRIA, 573-583.
35. Leghorn, R. Y. and Suzuki, T. (1985). Age, Sex and Cohort: Explicating Social Change in Post-War Japan, Behavior"zetrika, No. 18, 1-16.
36. Kuroda, Y., Hayashi, C. and Suzuki, T. (1986). The Role of Language in Cross-National Surveys: American and Japanese Respondents, Applied Stochastic Models and Data Anal- ysis, Vol. 2, 43-59.
37. The Research Committee on the Study of Honolulu Residents (1986). The Third Attitudi- nal Survey of Honolulu Residents, The ISM Monograph 3. The University of Hawaii Press.
38. Hayashi, C. (1987). Statistical Study of Japanese National Character, Joztrnal of Japan Statistical Society, Special Issue, 71-95.
39. Kuroda, Y., Kuroda, A. K., Hayashi, C. and Suzuki, T. (1987). The End of Westernization and the Beginning of New Modernization in Japan: Attitudinal Dynamics of the Japanese, 1953-1983, The ATab Journal of the Soeial Scienees, Vol. 2, No. 1, 18-36.
40. Sasaki, M. and Suzuki, T. (1987). Changes in Religious Commitment in the United States, Holland, and Japan, American Jonrnal of Sociology, Vol. 92, No. 5, 1055-1076.
41. TYommsdorff, G., Suzuki,T. und Sasaki, M. (1987). Soziale Ungleichheiten in Japan und der Bundesrepublik Deutschland, Kb'lner Zeitschrift rur Soziologie und Sozialpsychologie, Vol. 39, No. 3, 496d-515.
42. Hayashi, C. (1989). Cultural Link Analysis for Comparative Research-A New Approach to the Exploration of Structure in Ways of Thinking Applied to Cross-National Analysis of General Social Attitude, The SiLrvey Statistician (ISI?, No. 21, 14-15.
43. Kuroda, Y. and Suzuki, T. (1989). Language and Attitude: A Study in Arabic, English, and Japanese on the Role of Language in Cross-Cultural Thinking, in Thinking Across CultzLres: The Third International Conference on Thinking (eds. Topping, D. M., Crowell, D. C. and Kobayashi, V. N.), Lawrence Erlbaum Associates, 147-161.
44. Sasaki, M. and Suzuki, T. (1989). New Directions in the Study of General Social Attitudes:
Ttend and Cross-National Perspectives, Behaviormetrika, No. 26, 9-30.
45. Suzuki, T. (1989). Cultural Link Analysis: Its Application to Social Attitudes-A Study Among Five Nations, Bulletin of the International Statistical Institute, Proceedings of the 47th Session, Paris, 343-379.
46. Hayashi, C. (1990). Statistical Study of Japanese National Character and Its International Comparison among Five Nations, The Survey Statistician (ISI?, No. 23, 14-15.
47. Hayashi, C. and Suzuki, T. (eds.) (1990). Beyond Japanese Social Values-Trend and Cross-National Perspectives, Inst. Statist. Math.
48. Hayashi, C., Suzuki, T. and Leghorn, R. Y. (1991). The Japanese and the Americans- Comparative and Time Series Surveys of the Institute of Statistical Mathematics, Inst.
Statist. Math.
49. Hayashi, C., Suzuki, T. and Sasaki, M. (Eds.) (1991). Japanese/American National ChaTac- ter Conference (Hoover Institution, Stanford University, March 17-18, 1990?, Inst. Statist.
Math.
50. Kuroda, Y. and Suzuki, T. (1991). Arab Students and English: the Role of Implicit Culture, Behaviormetrika, No. 29, 23-44.
51. Kuroda, Y. and Suzuki, T. (1991). A Comparative Analysis ofthe Arab Culture: Arabic, English, and Japanese Languages and Values, Behaviormetrika, No. 30, 35-53.
52. Nisihira, S. et Condominas, C. (1991). L'opinion des Japonais; Socie'te'-Travail-Familte a travers les Sondages-comparaison internationale-, Paris, Sudestasie.
53. Sakamoto, Y. (1991). Categorical Data Analysis by AIC, Kluwer Academic Publishers, Dordrecht, Holland.
54. Research Committee on the Study ofJapanese National Character (1992). Dai 5 IVippon]'in no Kokuminsei (A study of the Japanese National Character, No.5), Idemitsu Shoten, Tokyo. (in Japanese with English summary)
55. Hayashi, C. (1992). Belief Systems and the Japanese Way of Thinking: Interchronological and International Perspectives, in Social, Edueational and Clinieal Psyehology, Proceedings of the 22nd International Congress of Applied Psychology: Volume 3, Lawrence Erlbaum Associates, Publishers, 3-34.
56. Hayashi, C. (1992). Quantitative Social Research-Belief Systems, the Way of Thinking and Sentiments of Five Nations-, Behaviormetrika, Vol. 19, No. 2, 127-170.
10 L 0UTLINE OF THE STUDY
57. Hayashi, C., Suzuki, T. and Sasaki, M. (1992). Data Analysis for Comparative Social Research, International Perspectives, Elsevier, North-Holland.
58. Kuroda, Y. and Suzuki, T. (1992). Tahalil Mugarin Thagafa Al-Arabiye; Al-Lughat Wa Al-Queem Al Arabiye Wa Al-Ankelizidyeh Wa Al-Yabaniye (A Comparative analysis of the Arab culture; Arabic, English and Japanese language and values), Al Mustaqbal Al Arabi (The Arab Future?, No. 16, 14-31.
59. Nisihira, S. (1992). Public Opinion in Japan-Changes and Comparisons, Japanstudien, Band 4, 37-54.
60. Yoshino, R. (1992). An Extension of the Test Theory Without Ansvv'er Key by Batchelder and Romney for Social Survey Research, in Social, Educational and Clinical Psychology, Proceedings of the 22nd International Congress of Applied Psychology: VoliLme 9 (eds.
Motoaki, H., Misumi, J. and Wilpert, B.), Lawrence Erlbaum Associates, Publishers, 108.
61. Yoshino, R. (1992). Superculture as a Frame of Reference for Cross-national Comparisons of National Characters, Behaviormetrika, Vol. 19, No. 1, 23-41.
62. Yoshino, R. (1992). The Unbiased BIGHT Model and Its Application to the Distinction of Responses to a Free-answer Question in a Social Survey, Behaviormetrika, Vol. 19, No. 2, 83-96.
63. Suzuki, T. (1993). Macro Analysis by Means of Cohort Analysis, Behaviormetrika, Vol. 20, No. 1, 77-90.
64. Hayashi, C. (1994). The Japanese National Character, Foreign Press Center.
65. Hayashi, F. (1994). Comparative Analysis ofthe Japanese and Germans: Some Topics on Social Values, Behaviormetrika, Vol. 21, No. 1, 61-78.
66. Murakami, M. (1994). Estimate of the Number of International Children in Japan, Based on rlhrends in Intermarriage, Internationat Journal of Japanese Sociology, No. 3, 29-43.
67. Hayashi, C. (1995). Changing and EndiLring Aspects of Japanese National Character, In- stitute of Social Research, INSS (Institute of Nuclear Safety System).
68. Hayashi, F. and Suzuki, T. (1995). Data Analytic Representation of Characteristics of Various Breakdowns in Cross-Cultural Survey, in Data Science and Its Application (eds.
Hayashi, C. et al.), Harcourt Brace Japan, 235-246.
69. Sakamoto, Y. (1995). A Study of Japanese National Character: Ninth Nationwide Survey, Research Memorandum, No. 572.
70. Yoshino, R. and Khor, D. (1995). Complementary Scaling for Cross-National Analyses of National Character, Behaviormetrika, Vol. 22, No. 2, 155-•184.
71. Sakamoto, Y. et al. (1995). TokiLshz` Nippon-]`in no Kokzeminsei (Special issue: A Study of the Japanese National Character), Proc. Inst. Statist. Math., Vol. 43, No. 1, 1-176. (in Japanese with English summary).
72. Hayashi, C. (1996). Cultural Link Analysis (CLA) for Qualitative Comparative Social Research and its Applications, in euantitative Social Researeh in Germany and Japan (eds. Hayashi, C. and Scheuch, E.), Leske+Budrich, 202-229.
73. Sasaki, M. and Suzuki, T. (1996). Changes in Religious Commitment in The United States, Holland, and Japan, in Comparing Nations and CiLltures (eds. Inkeles, A. and Sasaki, M.), Prentice-Hall, 586-601.
74. Suzuki, T. (1996). Macro Analysis by Means of Cohort Analysis, in Quantitative Social Research in Ger7nany and Japan (eds. Hayashi, C. and Scheuch, E.), Leske+Budrich, 53- 70.
75. Suzuki, T. and Sasaki, M. (1996). The Use and Role of the Data Library for Improving Survey Methods, Paper presented at the WAPOR Regional Conference in Tokyo.
76. Yoshino, R. (1996). Degree of Conformity for the Cross-National Comparative Study of National Character, in Quantitative Social Research in Germany and Japan (eds. Hayashi, C. and ScheUch, E.), Leske+Budrich, 182-206.
77.
78.
79.
80.
81.
82.
Hayashi, C. and Kuroda, Y. (1997). Japanese Culture in Comparative Perspective, Praeger.
Study on Japanese Behavior and Attitude Patterns in JAs, Hokubei Mainichi, Oct.14, 1998.
Studies of Nikkei Character Underway, Nikkei West, Oct.15,1998.
Hayashi, C. (1998). What is Data Science? -Fundamental Concepts and a Heuristic Example, in Data Science, Classification and Related Methods (eds. Hayashi, C. et al.), Springer-Verlag, 40-51.
Hayashi, C. (1998). The Quantitative Study of National Character, Interchronological and International Perspectives, Int. J. of Comparative Sociology, Vol. 39, No. 1, 91-114. (or, in Sasaki, M. (ed.), Values and Attitude Across Nations and Time, Brill, pp.99-114.) Sakamoto, Y. (1999). Statistical Research of the Japanese National Character: General Tirends in Attitude over the Later Halfofthe Twentieth Century, WAPOR 52nd Conference Papers, No. 12 (Paris, France), World Association for Public Opinion Research.
II. QUESTIONS ANDSIMPLETABULATIONS
1. Abbreviation I (1953)
II (1958) M (1963) W (1968) V (1973) U (1978) W (1983)
VllI (1988)
pt (1993) X (1998) JPN K
M
*
USA88
UK87 USA98
The first nationwide survey in 1953 The second nationwide survey in 1958 The third nationwide survey in 1963 The fourth nationwide survey in 1968 The fifth nationwide survey in 1973 The sixth nationwide survey in 1978 The seventh nationwide survey in 1983 The eighth nationwide survey in 1988 The ninth nationwide survey in 1993 The tenth nationwide survey in 1998
The Surveys of Japanese National Character mentioned above K-type questionnaire
M-type questionnaire
The relevant question or category is missing.
The relevant response category has a zero frequency.
The USA 1988 Survey for the "Cultural Link Analysis for Comparative Social Research"
: The UK 1987 Survey for the "Cultural Link Analysis for Comparative Social Research"
: "Personal Values Study"conducted in USA in October 1998
2. Criterion for choosing translated questions
Needless to say, the surveys of Japanese national character were conducted with ques- tions written in Japanese. Therefore, since many ways of English translation are possible, translated questions in this report are tentative. In this report, translated questions were chosen based on the following criteria:
(1) The question in USA88 (or USA98) was adopted if it was not much different in content from the Japanese question. (Therefore, some questions are different from those published previously.)
In addition, if the translated question of UK87 is different from that of USA88 (or USA98), that is given in the footnote. (In this case, the differences are underlined.) (2) A question translated from the original Japanese one was adopted if there is not an appropriate translated question in USA88 (or USA98). However, if the differences are only in the response categories, the question in USA88 (or USA98) is given in the footnote.
3. Notes for tables
Figures in tables indicate relative frequency (percentage) of a category rounded to the nearest integer. Figures in the "totaP column are a simple summation of these percentages that will not sum up to 100 in some cases. Number of completed samples are shown in parentheses in that column. Multiple answer items are enclosed by double lines and summary percentages are omitted.
gl Demographic Data on Respondents
#1.1 Gender
#1.2 Age
e$oZ.
13i::l" 2ourB.e2., 1Egtl-'A 2I)iltl,po 32Eiilespl 42sii6o 581s 6&1Elili
oror78
oororenll AXO
9g1gii
1011aRPgi$o
Total I(1953) 1 47 53 19 15 11 11 10 8 96 5 33 100(2,254)
H(1958) 1101 46 54 15 14 14 10 11 9 77 6 44 101(2,369)
M(1963) --- 46 54 12 13 14 12 10 9 96 6 44 99(2,698)
rv(1968) --- 47 53 12 13 13 13 11 8 77 6 44 98(3,033)
K+M 45 55 14 12 12 12 12 10 87 5 45 101(4,594)
V(1973) -4---M 46---
43
54--57 !113 -i-2-
11
-i-2-
12
1i-13 -i-2-
12
-iP-10 77---
97
--5- 5
45---
45 -
99(3,055) i6i- (iJs-3S)- K+M 44 56 10 12 12 11 11 11 87 6 57 100(3,945)
W(1978)-4---M 44----
43
56--57 -910.i-2-
12
-i-2-
13
13-10-i-i-
11
-1-1-
11
97---
87
--5- 7
57---
46 h
101(2,032) 6g-(i,-g-ig)- K+M 44 56 9 9 12 11 11 11 108 6 57 99(4,429)
vr(1983) -4---M 44---- 45
56--55 -99 "9-
9
-i-2-
13
li-11 -i-i-
10
-i-2-
11
108---
109
--6- 6
57---
57 -
100(2,256) i66Zi,i-7i)-
K+M 45 55 10 8 9 13 10 10 99 8 68 100(3,682)
VIII(1988) -4.-.M 45--- 44
55--56 -911 "8.
8
-i9-8 l3-13 10---11 -i-O.
10
89---
108
--8- 8
69---
68 -
100(1,858) i6i- (i;s-2a)- K+M 46 54 8 7 8 9 13 11 1010 10 77 100(3,738)
or(1993) -4---M 46--- 47
54--53 -88--8.
7
-8-9 -99 -i-3.
12
-i"i-
11
109---
1010
-1.0-
10
67---!-
77 -
99(1,833) i66ZiJgo-6)-
K+M 45 55 7 7 8 8 8 11 1010 11 812 100(2,680)
X(1998) .4---M 46---
45
54--p-55 -86-i8 -8-7 -Z9--8-
8
-1-1-
12
1010---
1110
-1-1-
11
813---
811 -
99(1,339) i6i- (i,-3-4i)-
15
#1.2b Marital status (JPN)
Are you married or single?
1 2 3 4 5
Single
Widowed
Separated or divorced
-t .1
lviarrleu
Other (Specify) 6 D.K.
Dggg.Zp
19.5op-o 2ii!1aosg 4Kee:.opt 5oc.'f2
Total
I(1953) 56 17 8 1 70 * 4 100(2,254)
ll(1958) * M(1963) *
W(1968) *
V(1973) *
W(1978) *
vr(1983) *
va(1988) *
or(1993) *
K+M 14 7 3 77 . o 101(2,680)
X(1998) K40---- M36-
14---
13
8---
7
2---
3
76---
77 --
:---.
- o---
o
100(1,339)-i-OO--
(-i;3-4i)-
Cf. (UK87) 1 Married 2 Single 3 Divorced 4 Separated 5 Widowed
gl DEMOGRAPHIC DATA ON RESPONDENTS
#1.3 Educationalbackground (JPN)
What was the last grade or class you completed in school?
1
2 3 4 5
Elementary (No formal education) Middle
High University Other (Specify)
Dgpeg.
Etc
gg'
3!1.cv,,c,,i 4gg'a..,.-' 59ig"B
Total
I(1953) 55
3335 24 6 2 100(2,254)
ll(1958) 32a
132a 3137 24 7 2 101(2,369)
M(1963) ---
2141 29 8 1 100(2,698)
N(1968) K+M--- 1640 34 10 o 100(3,033)
1530 41 12 2 100(4,594)
V(1973) -K---M29
- --
1530---
1431 --
42--- 40
-il.----13 2--2
- -
100(3,055)
i-OO--(-i,- 5-3g)-
K+M 1032 40 16 2 100(3,945)
W(1978)-K---M
- -"
1032---
1132 --
-4-i--- 39
-ii--h-17 2.-1
- -
100(2,032)
ioo--(iJg-i5)-
K+M
829
43 19 1 100(4,429)va(1983) -4---M
- --
829---
929
--43---
43
-i-9--- 18
-1--1
- -
100(2,256)
ioo--(i,1-7g)-
K+M
824
45 22 1 100(3,682)va(1988) -4---M
- ---
823---
725
--44--- 46
23--- 21
-1---
1 . -
99(1,858)
i-oo--(iJs-24)"-
K+M
522
47 25 1 100(3,738)IX(1993) K40--e-- M34 - --
423---
522
--46-"----"
49
26---h 24
-9--1
- -
99(1,833)
i-Oi-(i,-9-OS)-
K+M
521
46 26 1 99(2,680)X(1998) K38--- M34 - ----
622---
520
--45--- 48
26--- 27
-1---
1 - .
100(1,339) iOi- (-ii4i)-
17
#1.4c Occupation (JPN)
Which describes the kind of work you do?
1
2 3 4 5 6 7 8
Farmers, lumbermen and fishermen Shop and factory proprietors
Professionals
Manaffers and oMcials
v
White-collar workers Blue-collar workers Housewives
Students and no occupation 9 D.K.
Åíggg.zp
1Bos
lel•,ilifl'thie,i•lilig••lgloooas
9g
Total
I(1953) *
ll(1958) * M(1963) *
rv(1968) *
K+M 13 105316162610 1 100(4,594)
V(1973) K---
M30 13 13
,105316162610---d---
115215162710
11 100(3,055)-i'o6-
(-iJs-39)-
W(1978) *
W(1983) *
K+M 7
127516201813 1 99(3,682)
va(1988) Kb---
Mb
78 138515211813---p---.---
127517201813
11 101(1,858)-ioi-
(-i;s-24J
K+M 7 125617241910 1 101(3,738)
IX(1993) K41b--- M35b
77 13561625199---
115617241911
1o 101(1,833)-i-oo'-
(-i,-g-o5)-
K+M 6
125516231815o 100(2,680)
X(1998) K39--- M35
57 115516231816---.---
134516231814
oo 99(1,339) 1-o6-(iJ3'4i)-
Sl DEMOGRAPHIC DATA ON RESPONDEIVTS
#1.5 Urban vs. rural
DgpeZp
i':y'-.O'gKe,ep.v..gO`he i.,.C'tieS"g.ggoo:.ts)o-.ooorotB'"vii.•l'i8"liEiBgiCP-•il
Total
I(1953) --- 101(2,254)
ll(1958)
---
15Vt991344
100(2,369)M(1963) ---
16Y211111138
99(2,698)N(1968) ---K+M
17Y710121132
99(3,033)18Yt9121028
100(4,594)V(1973) K--- M
18Vt10121028---is---<`;'-`l{ll':"---g----ii--io--'-is---
101(3,055) i-o6- (iJs-39J
K+M
15V61015826
100(3,945)W(1978) K---.
M
15V71015825---i6---g-;'-Ii6-;•7---io--'-is----g---i6--
100(2,032) 1-oi-(i,-g-ig)-
K+M
148201114725
99(4,429)W(1983) K--- M
148201214725---
148201114725
100(2,256)--gg--
(i,-i-75)-
K+M
129201114726
99(3,682)wn(1988) K---
M
129201115726---h---
139211113726
100(1,858) i-o6- (i;s'2a)-
K+M
1210211114625
99(3,738)or(1993) K---
M
1210211115625---
1310221114525
100(1,833) i-o6- (iJg-o5)-
K+M
1210221311824
100(2,680)X(1998) K--- M
1211211311824---.---
1210221312725
100(1,339)-i-Oi-
(-i,-3-4i)-
1) Tokyo, Yokohama, Nagoya, Kyoto, Osaka, Kobe
19
#1.6 Regional distribution 1
2 3 4 5 6 7 8 9
Hokkaido Tohoku Kanto Chubu(East) Chubu(West) Kinki
Chugoku Shikoku Kyushu
Dgpezp
ge'E,trff,tr:',?,m.\gx
g.g.:
Total
I(1953)i)
--- 5
141712911Yt16
100(1,370)ll(1958) --- 5
102489148515
98(2,369)M(1963) --- 5
1023910178413
99(2,698)N(1968) --- 5
102599168413
99(3,033)K+M 4
928810187313
100(4,594)V(1973) K---
M
45 928810177313---
928711187312
99(3,055)-i-o6-
(-iJs-3g)'
K+M 4
928811187312
100(3,945)W(1978) K--- M
44 928811187312---
928811186313
100(2,032)Mi-o6-
(-i;g-ig)-
K+M 4
929810177412
100(4,429)vr(1983) K---
M
45 929810177411---"---d---
828810177412
99(2,256)--99--
(ii7i)- K+M 5
8261010177412
99(3,682)n(1988) K--- M
55 8271010177412---d---
926109178412
100(1,858) 1-o6k-iJs'24J
K+M 5
829910157413
100(3,738)pt(1993) K---
M
55 828910158413---'---m--"--
829910167413
100(1,833)-ioi-
(-i,-g-o6)-
K+M 5
827810188413
101(2,680)X(1998) K--- M
55 82789178413---
827810188412
99(1,339)-iOO--
(-ii4i)-
1) for rural population only