2016 年熊本地震前の九州地域の地震活動および余震活動の統計的モニタリング Statistical monitoring of seismicity in Kyushu District before the occurrence of the 2016 Kumamoto earthquakes of M6.5 and M7.3
統計数理研究所 東京大学地震研究所 The Institute of Statistical Mathematics Earthquake Research Institute, University of Tokyo
余震活動の静穏化の有無を解析することによって大きな余震または付近での本震以上の 地震発生の予測の確率利得があがることが期待される1,2)。M7.3 に先行した M6.5 に続く 「前震」と呼ばれている余震系列(第5図)を ETAS モデルによって解析した。また M6.5 の 余震(前震)の深さ分布が M7.3 の深さへの移動が見られる(第 7 図)。M6.8 震源域で 2000 年 M5 の前震本震余震系列(第3図)があるが,これも静穏化している。また 2005 年福岡 県西方沖地震(M7.0)および 2015 年鹿児島県西方沖地震(M7.1)の余震系列を解析して有 意な静穏化を認めた(第4図)。 2010 年以降の熊本地方とその周辺の地震活動(第1図および第2図)を ETAS モデルで 解析した。布田川断層系付近の領域に静穏化を認めたが,その他の領域では ETAS モデルが 良く適合した。またそれらの静穏化領域の地震活動に非定常 ETAS モデル3,4) ( )
(
)
0 { : }( |
)
( )
( )
i c i p M M t i i i S t tt H
t
K t e
αt t
c
θλ
µ
− − < <=
+
∑
− +
をあてはめた(第 2 図の続き)。ここでμ(t) は地震発生場の静的応力変化や断層弱化など に起因する地震発生率の変化を示唆する。K0(ti) は各地震の連鎖性(トリがリング)効果の 大小(余震生産性)を示すが,実際には時刻 tiで起きた地震 i の位置に依存することが分か ってきた。この点過程モデルを今回の群発地震活動(第 2 図の続き)に当てはめた結果も 示す。 最後に熊本地震 M7.3の余震活動(第6図,第 7 左上図)に関して ETAS モデルで余震の 各領域をモニターした結果を示した。また熊本地震の前震余震を通した b 値変化5)や非定 常 ETAS モデル3,4)のパラメータの変化を推定した(第8図)。 本解析にかんして気象庁一元化震源データおよび地震活動解析ソフトウェア TSEIS と XETAS を使用した。 (熊澤貴雄,尾形良彦,鶴岡弘) 参考文献1) Ogata, Y., J. Geophys. Res., 106, (2001), 8729. 2) 尾形良彦,連絡会報, 72 巻(11-7) (2005), 631 頁.
4) 統計数理研究所・気象研究所,連絡会報 94巻 (5-1) 136. 5) 統計数理研究所,連絡会報 73 巻(2005)666.
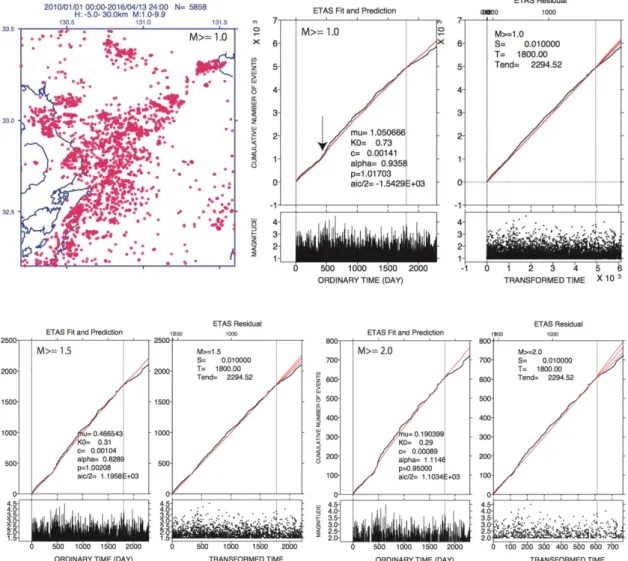
第1図。熊本県中部地域の地震活動。2010 から 2016 年 4 月 14 日 M6.5 熊本地震発生時まで の時間区間で M
≥
1.0 の地震に対して ETAS モデルを適用した解析結果。実時間(パネル対 の左側)と ETAS による変換時間(対の右側)に関する理論累積曲線(赤線)と実際の地 震の累積曲線(黒線)及び MT 図のプロット。矢印は 2011 年 M9.0 東北沖地震発生時。最 も有意な変化点時(右側の灰色の縦線)までのターゲット期間であてはめた ETAS モデル の地震活動度の理論累積曲線 (赤線) と実際の観測数(黒線)。2015 年 9 月以降に相対的静穏 化が見られる。これ以上に下限マグニチュードを上げ場合,同じ変化点(1800 経過日)な らば有意で静穏化といえる。Fig. 1. The seismicity in the central area of Kumamoto prefecture, from 2010 to April 14, 2016 before the M6.5 earthquake of 14 April 2016, with magnitudes M
≥
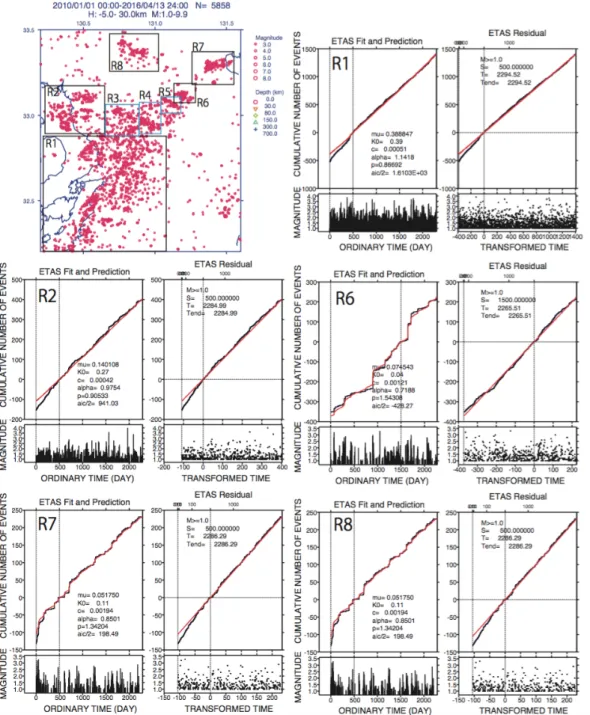
1.0. Each paired panels are the results by the XETAS program. The ETAS model is fitted to the most likely change-point (gray dashed vertical line) if exists, then extrapolated, shown in red curve, superimposed on the observed cumulative curve in black. We see the relative quiescence after September 2015. The downward arrow indicates the occurrence time of the 2011 Tohoku earthquake of M9.0. Quiescence can be still significant with some higher threshold magnitudes at the same change-point (i.e., 1800 elapsed day).第2図。第 1 図の全領域を細分化した各領域の 2010 年から2016 年 4 月 M6.5 地震の直前ま での M
≥
1.0 の地震活動に ETAS モデルをあてはめた。実時間(各対の左側)と ETAS によ る変換時間(対の右側)に関する理論累積曲線(赤線)と実際の地震の累積曲線(黒線) 及び MT 図のプロット。R3, R4, R5 の領域で相対的な静穏化が見られた(第 2 図続き参照) が,その周辺部の領域 R1,R2,R6-R8 領域では正常に推移している。Fig. 2. The ETAS model fitted to M
≥
1.0 earthquakes in each region of R1-R8 separated from total area of Fig. 1. Quiescence is detected in R3, R4, R5 (see Fig.2 continued below), but no significant anomalies found in the rest of the regions. In each of the paired panels, the ETAS estimate of the cumulative curve is superimposed (red curve) on observed (black curve) in the ordinary time (left side of each pair) and the transformed time (right side). The corresponding M-T plots are associated.第2 図の続き。R3, R4, R5 各領域
M
≥
1.0
の地震活動。(左側の2図)変化点の前の期間 であてはめたETAS モデルの理論累積曲線 (赤線) と地震の累積 (黒線)。これらの領域で非定常ETAS モデルを当てはめ常時地震活動度µ の時間変化(赤線)と連鎖地震強度(余
震生産性)K0の時間変化(青線)と空間変化(色表付の点群)を示した(右側の 2 図)。
Continuation of Fig. 2. Seismicity of
M
≥
1.0
in the regions, R3, R4, R5. (Left hand side panels), ETAS estimate of the cumulative curve (red) fitted the data in the target period before thechange-point, and observed cumulative curve (black). (Right hand side panels) The non-stationary ETAS model estimates: μ(t) in red and K0 (t) in blue, with 2 fold error curves. The right side panels
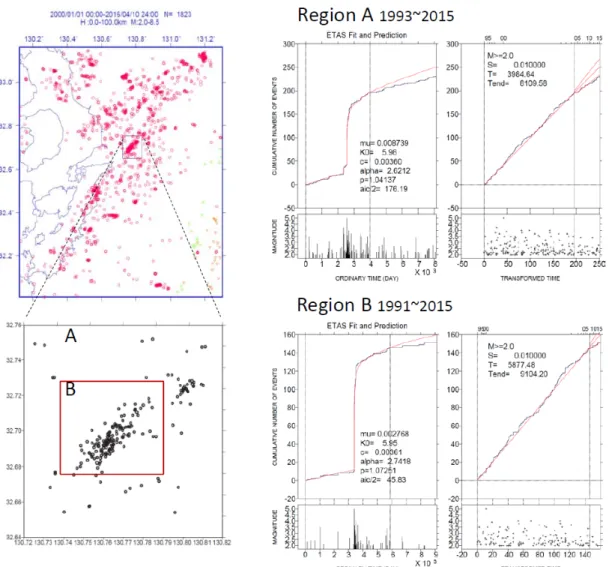
第 3 図。2016 年 M6.5 地震の震源域と同地域に起きた 2000 年の M5.0 地震の M
≥
2.0 の余震 活動は本震後4ヶ月後から M6.5 熊本地震まで相対的に静穏化している。Fig. 3. The aftershock activity (M
≥
2.0) of the M5.0 earthquake that occurred in 2000 in the same region of the M6.5 in 2016. There is relative quiescence from 4 months after the M5.0 main shock up until the M6.5 Kumamoto earthquake.第 4 図。2015 年 11 月 M7.1 鹿児島県西方沖の地震の余震活動(左側 2 対図)および 2005 年 M7.0 福岡県西方沖地震の余震活動(右側 2 対図)の ETAS モデルによる解析結果。各下 限マグニチュード Mcの余震の累積数時間経過(赤は ETAS,黒はデータ)及び M-T 図。上 段パネルで,前者は M
≥
4.5 の余震が 4 カ月以上起きていない。後者は M≥
4.0 の余震は 10 年間起きていない。下段のパネルでは, より小さな下限マグニチュードで上段のパネルと同 じ変化点まで ETAS を当て嵌めた。Fig. 4. Analyzed results by fitting the ETAS modes to the aftershock sequences of the M7.0 Kagoshima-Ken western offshore earthquake in November 2015 (left side) and the M7.0
Fukuoka-Ken western offshore earthquake in 2005 (right side), respectively. The theoretical (red) and empirical (black) cumulative curves of the aftershocks are plotted with the respective threshold magnitudes Mc, with the M-T diagrams. No aftershock of M
≥
4.5 and M≥
4.0 occurred for the last150 days and 10 years in the former and the latter case, respectively. The same change-point is considered for the lower magnitude threshold in the corresponding panel in the bottom row.
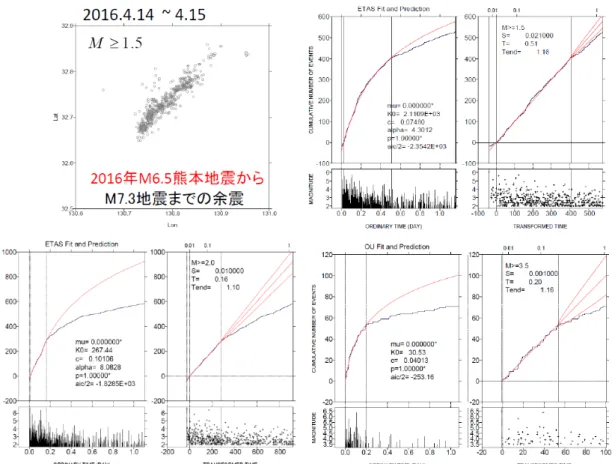
第 5 図。2016 年 M6.5 熊本地震の余震活動の ETAS モデルによる解析結果。それぞれ M
≥
1.5, M≥
2.0, M≥
3.5 の余震の累積数時間経過及び M-T 図。Fig. 5. Analyed results of the M6.5 Kumamoto earthquake of 2016 by the ETAS model. The red theoretical cumulative curves are superimposed on black empirical cumulative of the aftershocks of
第 6 図. M7.3 地震の余震について,熊本 (M
≥
3.0),阿蘇 (M≥
3.0),大分 (M≥
2.0) のそ れぞれの群れに対して ETAS モデルを当てはめた結果。余震減衰係数 p 値はぞれぞれの 地域で異なるが,余震活動は今の所順調に推移しているように見える。
Fig.6. The ETAS model is applied to each aftershock cluster of Kumamoto (M
≥
3.0), Aso (M≥
3.0), and Oita area (M≥
2.0), respectively. The p-values of the decaying rate of aftershock frequency appear different to each other, and fit well, respectively .第 7 図:2016 年熊本地震の全余震系列 (M
≥
3.0) の ETAS モデルによる解析結果。(左 上)熊本・阿蘇・大分を併せた全域のデータに対して ETAS モデルを当てはめて,変換 時間での推移を示した。(右)変換時間に対して深さ分布をプロットした。前震活動が 深い部分に移動し M7.3 本震と同じ深さへと向かっている。M6.8 地震余震の有感の頻度 が M7.3 の余震のものに比べて急激に減衰しているのは恐らく深部移動のせいか,また は第 5 図に見られるような静穏化のせいと考えられる。Fig. 7. Analysis of the entire Kumamoto aftershock sequence (M
≥
3
.0) by the ETAS model. (Top left panels) The ETAS model is applied to the superposed aftershock sequence inKumamoto, Aso, and Oita regions, and the cumulative number of events in the transformed time is plotted. (Right panels) In the depth distribution against the transformed time, the foreshock activity migrated toward as deep as the M7.3 mains hock hypocenter.The frequency of the felt aftershocks (bottom left panel) of the M6.8 event decays rapidly compared to that of the M7.3 aftershocks probably either because of the migration, or the aftershock quiescence (cf. Fig. 5).
第 8 図. (左側パネル)地震の検出率解析5)による G-R マグニチュード頻度分布 b 値(左
上段図)と地震検出率パラメータ(中下段図)の時間変化と 2 倍誤差幅。最大前震(M6.4)
や本震(M7.3)で b 値が階段状に変化している。(右側パネル)第7図で得られた ETAS
モデルを基準に非定常 ETAS モデルを推定したところ,常時活動度
µ
は変化していないが余震生産性パラメータ K0(t) は前震の場合が M7.3 の余震より大きい。
Fig.8. (Left side panels) Earthquake detection rate analysis5). Time changes of the b-values (top left panel) and the detection rate parameters (left middle, left bottom panels) with double error curves, for the entire period of the foreshocks and the aftershocks. The b-value changes stepwise at the largest foreshock of M6.4 and at the main shock of M7.3. (Right side panels) The non-stationary ETAS model3, 4) is applied for the same entire sequence, where the ETAS parameters in Fig. 7 were adopted as the reference. The time variation of the K0 parameter
changes significantly while the background activity