From Economic System Competition to Corporate System Competition
SHIMPO Hirohiko
Table of Contents Introduction
1 East Asian Securities Market 2 Chinese Corporate Governance
3 Corporate Governance in Russia, Singapore, Korea and Taiwan 4 East Asian Corporate Governance and East Asian Community
Keywords: State Monopoly Enterprise, State-Owned Enterprise, Sovereign Wealth Fund, Corporate System Competition, East Asian Community
Abstract
The U.S. financial crisis, which stemmed from the breakdown of the subprime loan, is expanding further and developing into a global fi nancial crisis. This crisis is greatly infl uencing East Asian countries that have experienced rapid growth.
This paper examines East Asian corporate governance just before the crisis. In this paper, East Asia means China, Hong Kong, Russia, Korea, Taiwan and Singapore. That is, East Asia is China, Russia and the previous NIES.
As I discusses in detail, in both China and Russia, large state monopoly enterprises are born one after another as they move toward a market economy. Older state-owned enterprises are converting to large state monopoly enterprises, and the latter have a marked infl uence not only on the country, but also on the entire world economy.
The following are features of state monopoly enterprises:
1. Although a state-owned enterprise is privatized, it maintains approximately two thirds ownership ratio to its public company as a holding company, and as a result substantially continues to control its management.
2. The most effi cient part of all state-owned enterprise resources are transferred to a public company, and state monopoly enterprises continue to maintain monopolistic status in each market.
3. Such a monopolistic position brought about the adhesion and unifi cation with politics, and, in certain cases, corruption.
In East Asia, the market-centered corporate governance in Japan and some other countries, along with the large state monopoly enterprises in China and Russia, is developing a new form of competition.
The previous economic system competition is changing into the corporate system competition. In such conditions, I would like to examine whether or not the East Asian community can be established.
Section 1 summarizes East Asian business activity and its financial markets. Section 2 discusses
Chinese corporate governance, Section 3 discusses corporate governance in Russia, Singapore, Korea and Taiwan. Finally, Section 4 summarizes the relationship between East Asian corporate governance and the East Asian community, and the role of Japanese companies.
Introduction
On September 15, 2008, Lehman Brothers, the fourth-ranked securities firm in the U.S., announced they were applying for Article 11 of the Federal Bankruptcy Act. The U.S. financial crisis, which stemmed from the frozen subprime loan, is expanding further and developing into a global fi nancial crisis.
This crisis is greatly infl uencing East Asian countries that have experienced rapid growth. This paper examines East Asian corporate governance just before this crisis. For purposes of this paper, East Asia means China, Hong Kong, Russia, Korea, Taiwan and Singapore. That is, East Asia is China, Russia and the previous NIES.
I would like to especially note China and Russia. After the Soviet Union socialist system collapsed, Russia was born. China is rapidly advancing toward a market economy while maintaining the old system. This paper’s most important objective is to show the actual conditions of corporate governance in these countries. Russia is a big power in Europe. However, Russia is also a major country in East Asia, bordering Japan and China.
As this paper will discuss in detail, in both China and Russia, large state monopoly enterprises are born one after another as they move toward a market economy. Older, state-owned enterprises will convert to large state monopoly enterprises, and the latter have a marked infl uence not only on the country, but also on the world economy.
In East Asia, the market-centered corporate governance in Japan and other countries, along with the large state monopoly enterprises in China and Russia, is developing a new form of competition. The previous economic system competition is changing into the corporate system competition. In such conditions, I would like to examine whether or not the East Asian community can be established.
Section 1 summarizes East Asian business activity and its financial markets. Section 2 discusses Chinese corporate governance; Section 3 discusses corporate governance in Russia, Singapore, Korea and Taiwan. Finally, Section 4 summarizes East Asian corporate governance and the East Asian community.
1 Securities Markets in East Asia
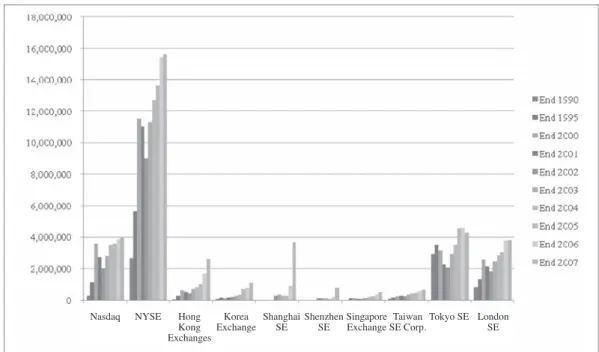
First, I would like to survey the securities market in the world and East Asia. Figure 1 summarizes the aggregate market value of the major securities markets in the world and Asia from 1990 to 2007 based on a report from the World Federation of Exchanges.
The increase in the NYSE is remarkable, while the stagnation of Tokyo is conspicuous among major world markets. However, the huge expansion of the Shanghai and Shenzhen market, which have supported rapid economic growth in China, warrants attention. Both markets were founded in 1990*1. These market’s fi rst data in this report were published in 2002.
Although the Shanghai general index had reached 5,000 at the end of 2007, it fell below 2,000 on September 16, 2008. Even if we subtract the negative infl uence of the U.S. fi nancial crisis, we still see that the bubble was included in the Chinese stock market.
*1 The examination of the history of the Shanghai market, its development before World War II, the abolition by the People’s Republic of China and its comparison with the current market will become an important subject.
The study on Shanghai market is closely related to the research on the historical development of Chinese companies as well.
Figure 1 Domestic Market Capitalization (Main & Parallel Markets) (in USD millions) Source: World Federation of Exchanges
Nasdaq NYSE Hong ExchangesKong
Korea
Exchange Shanghai SE Shenzhen
SE Singapore Exchange Taiwan
SE Corp.Tokyo SE London SE
I will examine how companies in each East Asian country have developed, supporting a growth of such a fi nancial market. Before examining the latest trends, I will survey the features of companies in each East Asian country on January 4, 2000, via the FT Global 500 2000 by The Financial Times Ltd. Its fi nancial data are mainly from the end of 1998. Since these data are based on the aggregate stock market value from early on, we can make the comparative examination for a longer period.
A noteworthy feature of Table 1 is that Chinese and Russian companies are not included in Global 500 companies. In terms of the industrial composition, the fixed-line telecommunication services company occupies the higher rank, and there is no cellular phone services company. Both of the above dramatic changes have been brought about in only eight years. Alternatively, when you exclude fi xed-line telecommunication service companies, the companies in the other four countries and region do not experience much of a change.
2 Chinese Corporate Governance
In Sections 2 and 3, I will survey East Asian business activity through FT Global 500 2008.
This investigation is based on the stock price on March 31, 2008. Its fi nancial data come mainly from the end of 2007. Although the stock price in each country is already falling, it is still high.
Since shareholder capitalism is now developing, the aggregate stock market value standard is the most suitable method to evaluate a company. However, since FT’s data are based on the stock price at one specifi c point in time, some problems may arise in the comparison among companies and the comparison among different periods.
For all listed companies or most of them the corporate governance in each country can be examined. However, I think the better method is to make representative companies’ detailed data transparent, thereby making their real image understandable to more people. Because the representative companies make up such a high ratio, this is a successful means of disseminating critical information. Conversely, summing up all listed companies can be often misleading, as the importance of major players will be overlooked.
The sales standard’s ranking is often used in China and other developing countries. It shows that the scale of an economy and a company is the valuation standard in these countries.
The U.S. has the most companies in the FT Global 500 2008 at 169 (9,617 billion dollars).
Japan follows with 39 companies (1,601 billion dollars). There are 25 Chinese companies, worth
Table 1 Asian Companies in 2000 Rank 2000 Rank 1998
CompanyCountryMarket Capital $mSectorTurnover $mPre tax Profi t $mNet Profi t $mROCECapital Employed $mYearend 51198China Telecom (Hong Kong)HK92,082.50
Fixed-Line Telecommunication Services
3,182.01,133.7833.410.66,513.531/12/1998 90179Hutchison WhampoaHK57,309.80Diversifi ed Industrials6,606.81,435.61,119.410.922,702.231/12/1998 168151Cable & Wireless HKTHK34,905.4
Fixed-Line Telecommunication Services
4,167.41,689.81,479.626.15,283.231/03/1999 205353Cheung Kong (Holdings) LtdHK29,024.8
Real Estate Holding & Development
N/R941.5785.93.813,588.531/12/1998 231448Sun Hung Kai PropertiesHK25,931.4
Real Estate Holding & Development
N/R1,305.01,193.08.318,642.630/06/1999 257307Hang Seng BankHK22,217.5BanksN/R1,025.5872.816.05,539.531/12/1998 261Pacifi c Century CyberworksHK22,034.2Internet36.5-7.9-8.030.531/12/1998 Total283,505.6 115Korea TelecomS Korea47,003.8
Fixed-Line Telecommunication Services
9,083.4218.5174.12.915,654.331/12/1998 146Samsung ElectronicsS Korea40,780.2Semiconductors17,892.4366.0279.011.715,736.031/12/1998 217SK TelecomS Korea28,219.9
Fixed-Line Telecommunication Services
3,158.3252.2134.817.53,247.631/12/1998 270430Korea Electric PowerS Korea20,522.1Electricity12,675.41,505.11,086.87.642,153.631/12/1998 461POSCOS Korea12,205.2Steel12,127.51,148.7848.911.216,327.731/12/1998 Total148,731.2 176139Singapore TelecomSin33,077.3
Fixed-Line Telecommunication Services
2,949.01,571.41,233.322.36,053.931/03/1999 299Development Bank of SingaporeSin18,699.0BanksN/R93.8122.72.25,512.631/12/1998 355Singapore AirlinesSin15,739.2Airlines & Airports4,707.7674.4623.98.38,349.731/03/1999 480Oversea-Chinese BankingSin11,786.4BanksN/R329.7256.68.54,049.531/12/1998 Total79,301.9 125325Taiwan SemiconductorTaiwan44,731.1Semiconductors1,651.9414.9502.712.34,333.431/12/1998 166United Micro ElectronicsTaiwan35,022.8Semiconductors566.9129.6144.41.33,248.731/12/1998 433Asustek ComputerTaiwan12,994.4Electronic Equipment1,153.2375.3379.241.11,067.731/12/1998 473321Cathay Life InsuranceTaiwan11,922.2Life AssuranceN/R583.0491.427,167.631/12/1998 Total104,670.5 Source: FT Global 500 2000.
1,962 billion dollars, exceeding Japanese companies. Thirteen Russian companies are worth 820 billion dollars. In this way, China and Russia have come to hold major companies in the world in a short period of time.
2.1 Chinese Companies in FT Global 500 2008
Table 2 is a list of 25 Chinese companies and ten Hong Kong companies in the FT Global 500 2008. When we examine Chinese companies by industry, we fi nd many fi nance-related businesses:
eight banks, two life insurance companies and one fi nancial institution. Seven are oil and mining companies: two oil and gas producers, three industrial metals and mining and two mining companies. The concentration of the fi nance and mining sectors is remarkable. Top ten companies are especially likely to fall into these two industries.
In China, where the fi nancial market is behind, a large amount of funds is concentrated within the banks, especially since so many people deposit funds into them*2. It is no surprise that the banking sector becomes a representative industry. We often see that state-owned oil and natural resources enterprises are big businesses in many developing countries.
The aggregate market value of China’s top company, PetroChina, is 424 billion dollars.
Second-ranked Indl & Coml Bank of China is valued at 277 billion dollars. They are overwhelming other companies within their respective industries.
Of Hong Kong companies, the aggregate market value of China Mobile is 298 billion dollars, and it makes up approximately one half of the total market value of ten companies. China Mobile is a big business with 69.3% share in mainland China. Subsequently, the composition ratio of General industrials, such as Hutchison Whampoa, and Real estate investment & services such as Sun Hung Kai Properties, is high, and it differs considerably from mainland business composition.
The PE ratio and Dividend Yield of all Chinese and Hong Kong companies in Table 2 are 16.0 and 17.8, and 2.6 and 2.3, respectively. The Dividend Yield is high, following Singapore. As I will examine later, this may mean that these companies give profi ts to their main stockholders, the government and state-owned enterprises. We must note this result from now on.
*2 Regarding the money fl ow in China, refer to the Ministry of Economy, Trade and Industry (2005), Chapter 2, Section 4 “The money fl ow in East Asia, and the fi nancial environment.” Through this data, we reconfi rm the importance of fi nancial institutions.
Table 2 FT's Chinese and Hong Kong Companies Global rank 2008Global rank 2007 Company Country Market value $m
Sector Turnover $m Net income $m Price $
PE ratio Dividend Yield (%)
2PetroChinaChina423,996.2Oil & gas producers118,999.620,752.81.210.84.1 69Indl & Coml Bank of ChinaChina277,235.5BanksN/R11,617.30.720.3 2035China Construction BankChina176,473.5BanksN/R6,601.30.725.00.3 2623Bank of ChinaChina159,478.1BanksN/R8,015.80.413.63.3 3753SinopecChina135,316.6Oil & gas producers148,871.47,682.90.99.72.5 5041China Life InsuranceChina109,528.7Life insuranceN/R5,540.63.417.51.7 52China Shenhua EnergyChina107,653.7Mining11,352.62,933.04.025.3 103264China Merchants BankChina64,469.5BanksN/R2,172.33.523.4 105166Bank of CommunicationsChina63,880.4BanksN/R2,889.21.219.5 140196Ping An InsuranceChina54,247.2Life insuranceN/R7.119.11.4 242China COSCOChina35,247.8Industrial transportation7,267.1289.42.451.61.4 260China CITIC BankChina33,552.9BanksN/R549.80.5 273Aluminum Corp. of ChinaChina32,340.7Industrial metals & mining10,856.31,459.91.613.81.7 288Baoshan Iron & SteelChina30,993.1Industrial metals & mining22,419.81,854.11.816.82.8 311China Coal EnergyChina28,873.3Mining4,307.5452.11.731.30.1 337China United TelecomChina26,782.9Mobile telecommunications11,157.7519.41.351.40.8 363Kweichow MoutaiChina25,265.3Beverages1,031.4429.826.861.6 369CITIC SecuritiesChina24,821.7Financial servicesN/R1,766.97.552.70.4 387China VankeChina23,915.2Real estate investment & servicesN/R690.32.221.30.6 414Air ChinaChina22,270.3Travel & leisure6,800.1602.70.816.611.5 419China Minsheng BankingChina22,115.3BanksN/R902.81.217.10.6 422
Shanghai Pudong Development Bank
China21,985.5BanksN/R783.25.128.10.8 433China Railway GroupChina21,339.7Construction & materials21,884.7291.61.0 452Shanghai International PortChina20,775.1Industrial transportationN/R1.0 490Angang SteelChina19,490.1Industrial metals & mining7,727.61,011.02.313.43.6 Total1,962,048.316.02.6 516China MobileHong Kong298,093.2Mobile telecommunications50,869.612,407.114.924.02.0 101220CNOOCHong Kong65,495.7Oil & gas producers12,675.74,407.31.514.22.5 208202Hutchison WhampoaHong Kong40,344.6General industrials23,620.52,573.99.515.72.3 211309Sun Hung Kai PropertiesHong Kong39,999.4Real estate investment & servicesN/R2,727.615.614.21.9 249326Hang Seng BankHong Kong34,611.7BanksN/R2,344.218.114.84.5 269301Cheung KongHong Kong32,884.5Real estate investment & servicesN/R2,322.714.214.22.0 314China UnicomHong Kong28,702.6Mobile telecommunications13,437.7531.82.149.91.2 359348BOC Hong KongHong Kong25,457.7BanksN/R1,799.92.414.14.5 480CLP HoldingsHong Kong19,818.9Electricity6,526.61,363.28.214.63.9 487Jardine MathesonHong Kong19,601.7General industrials19,445.01,828.031.66.12.1 Total605,010.017.82.3 Note: PE Ratio and Dividend Yield in each total column are calculated only in companies with relevant data. Source: FT Global 500 2008.
Next I will unify these 35 companies and examine the primary stockholders of the top 20 companies. Of these, mainland Chinese companies hold 14 positions and Hong Kong companies make up six.
In order to examine the corporate governance in each country, we have to first determine the stockholders. Until recently there were numerous studies on the decision-making systems of Chinese companies, such as the boards of directors. I would like to emphasize that an examination of the stockholders’ conditions is preferential. This is especially preferred since stockholder capitalism is dominant throughout the world, and the rule of state-owned enterprises lasted so long in China and Russia. And then, it will be necessary to show how the decision-making process inside a company functions and how a unique political system, such as the Communist Party, is participating in decision-making in China.
In Table 3, based on data disclosed by ET Net Limited and the Hong Kong securities exchange and supplemented partly by each company’s annual report, I list the two major stockholders of 20 companies. It is excellent that these data are easily attainable regarding those Chinese and Hong Kong companies. We may conclude that the special existence of Hong Kong, with its long history and open fi nancial market, especially the Hong Kong securities exchange, aided the privatization and development of Chinese companies.
The first feature to note in Table 3 is that the state-owned enterprises are the largest stockholders and have an overwhelming status in almost all companies. The highest ownership ratio is 86.3% of CNPC, the stockholder of PetroChina. The same may be said regarding CHINA MOBILE (HK), with 74.3% stake in the Hong Kong company, China Mobile.
When Chinese companies advanced privatization, the entirety of state-owned enterprises were not privatized, but the most competitive sections were. The state-owned enterprises became holding companies of privatized companies. This is the easiest and quickest method of privatization*3.
However, this form may also leave an unprofitable sector and an inefficient section simultaneously, and in some cases, it is possible to affect a public corporation’s business activity.
Therefore, it becomes important to clarify the interdependent relations between a holding company and a public corporation.
The second feature is that a bank is controlled by the government (MOF OF THE PRC), the
*3 In detail, refer to Imai (2008).
Table 3 Top 20 Chinese and Hong Kong Companies' Stockholder CompanyCountryIndustryStockholder 1%Stockholder 2%Total 12PetroChinaChinaOil & GasCNPC - NON-H SHS#86.3DEUTSCHE BANK AG - H SHS*6.292.56/30/08 25China MobileHong Kong Telecommu- nications
CHINA MOBILE (HK)74.374.312/31/07 36Indl & Coml Bank of ChinaChinaBanksMOF OF THE PRC - NON-H SHS#35.3CENTRAL SAFE INV - NON-H SHS#35.370.66/30/08 420China Construction BankChinaBanksCENTRAL SAFE INV - H SHS*68.0BANK OF AMERICA - H SHS*11.279.27/21/08 526Bank of ChinaChinaBanksCENTRAL SAFE INV - NON-H SHS#67.5RBS GROUP - H SHS*28.495.96/30/08 637SinopecChinaOil & GasCHINA PETROCHEMICAL-NON-H SHS#75.8
ALLIANCEBERNSTEIN L.P6/30/089.084.8 .-H SHS* 76/30/08China Life InsuranceChinaInsuranceCHINA LIFE INSUR - NON-H SHS#68.4J.P. MORGAN CHASE & 507.575.9 CO.-H SHS* CORP-NON-H SHS#81.27.3. MORGAN CHASE & J.P73.912/31/07 GROUP8CoalChinagySHENHUAChina Shenhua Ener52 CO.-H SHS* 9CNOOCHong KongOil & GasCNOOC65.065.012/31/07101 17.66/30/0824.16.4 - NON-H COSCO GROUPCHINA MERCHANTS GP-NON-H SHS#BanksChinaChina Merchants Bank10310 SHS# MOF OF 6/30/0861.020.4THE PRC - NON-H Banks40.7ChinaBank of Communications10511HSBC HOLDINGS(00005) - H SHS* SHS# 48.212/31/0755.67.4 - NON-H SHENZHEN INVInsuranceHSBC HOLDINGS(00005) - H SHS*ChinaAn InsurancePing 14012 SHS# -12/31/0750.0CHEUNG KONG(00001)50.0Conglomer20813Hong KongHutchison Whampoa ates 8/5/0842.5R YILAM F &OKKW42.5 WTEALORCTREDIPropertiesHong KongSun Hung Kai Properties12114 15242China COSCOChina
Transporta- tion
COSCO GROUP - NON-H SHS#53.6J.P. MORGAN CHASE & CO.-H SHS*8.462.012/27/07 16249Hang Seng BankHong KongBanksHSBC HOLDINGS(00005)62.162.112/31/07 17260China CITIC BankChinaBanksCITIC GROUP - NON-H SHS#62.3CIFH(00183) - H SHS*n.a.62.33/31/08 18269Cheung KongHong KongPropertiesDIRECTOR LI KA SHING40.240.27/16/08 19273Aluminum Corp. of ChinaChinaMetalsALUM. CORP OF CHINA-NON-H SHS#41.8TEMPLETON ASSET MGT - H SHS*14.856.612/31/07 20288Baoshan Iron & SteelChinaBaosteel Group Corp.74.0
Bank of Communications—E Fund 50 Index Fund
0.674.6 Source 1: FT Global 500 2008. 2: ET Net Limited and company’s Annual Report.
government fi nancial institutions and a sovereign wealth fund (CENTRAL SAFE INV*4) directly.
The latter will be examined later. The same can be said of three large banks, Indl & Coml Bank of China, China Construction Bank and Bank of China.
The form of privatization in China is very uniform, and will be found in almost all Chinese companies. The only exception in the top 20 companies is the case of China Merchants Bank.
The two major stockholders’ ownership ratio is just 24.1%. However, according to the company’s annual report, the total of the state-owned stock is 45.15%.
Next I will examine the world representative banks, and the position Chinese banks hold within them. Table 4 lists the world representative banks according to The Banker. The current global fi nancial crisis has resulted in the purchase of two banks. The HBOS was acquired by the British bank, Lloyds TSB Group (the 32nd rank of The Banker), and Wachovia Corporation was bought by the U.S. bank, Wells Fargo & Co (the 23rd rank of The Banker).
Notice the high status of Chinese banks. The Chinese banks shown in Table 3, ICBC, Bank of China and China Construction Bank Corporation, are ranked highly. The Bank of China stands fi rst of the 20 banks as ranked by soundness, and China Construction Bank Corporation is fi rst in performance.
However, I would like to call attention to the fact that Chinese banks were not entirely privatized from a former national commercial bank. As a preventive measure against bad loans, in the old national commercial banks public funds were injected and bad loans were partially transferred to assets management companies (AMC). As a result, national commercial banks improved, while the government amassed the problem. In that sense, the Chinese fi nancial system makes transparency diffi cult.
The third feature is that ownership of financial institutions in developed countries is progressing steadily. When the Chinese government wants to privatize within a short time, it cannot help depending upon fi nancial institutions in developed countries with a large amount of funds.
The Chinese companies of which the Hong Kong-based British HSBC is the largest stockholder are the Bank of Communications and Ping An Insurance. In addition to these
*4 This company is the subsidiary of China Investment Corporation (CIC). Incidentally, in each bank’s English annual report, this company is indicated as Huijin.
Table 4 World Representative Banks Strength Size Sound-nessProfi tsPerformance BIS Capital Ratio
Non- Performing Loans to total loans
Tier 1 Capital
Assets
Capital as- sets ratio Pre-tax profi
t
Return on assets Cost/ Income ratio
$m$m% latest$m%%%% 1HSBC HoldingsUnited Kingdom104,9672,354,2664.4624,2121.0349.4213.601.83 2CitigroupUSA89,2262,187,6314.081,7040.0875.2610.701.02 3Royal Bank of ScotlandUnited Kingdom88,8883,807,8922.3319,8360.5254.5511.201.28 4JP Morgan Chase & CoUSA88,7461,562,1475.6822,8051.4658.4312.600.16 5Bank of America CorpUSA83,3721,715,7464.8620,9241.2255.8111.020.64 6Mitsubishi UFJ Financial GroupJapan82,8591,817,5714.5610,1990.5674.7611.261.44 7Crédit Agricole GroupFrance68,7242,263,3103.0312,1100.5368.509.602.70 8ICBCChina66,2711,188,8005.5715,7951.3334.6613.092.74 9Santander Central HispanoSpain58,4791,343,9054.3516,0611.2046.6012.661.08 10Bank of ChinaChina56,210820,1986.8512,4161.5146.5413.343.12 11BNP ParibasFrance55,3532,494,4122.2216,2790.6574.94nana 12Barclays BankUnited Kingdom54,9152,459,1482.2314,1780.5857.3912.102.76 13China Construction Bank CorporationChina52,300903,2915.7913,8021.5341.7912.582.60 14HBOSUnited Kingdom48,8641,336,2993.6610,9680.8246.9311.102.07 15Mizuho Financial GroupJapan48,7521,494,9603.264,9560.3383.6411.691.78 16UniCreditItaly47,8541,504,1343.1813,7720.9254.4010.11na 17ING BankNetherlands43,8271,463,4372.996,5570.4568.6510.320.99 18Sumitomo Mitsui Financial GroupJapan43,7711,072,5624.089,2800.8768.3012.191.80 19Wachovia CorporationUSA43,528782,8965.568,7731.1263.0711.821.21 20Rabobank GroupNetherlands41,931839,8404.994,4870.5367.0410.90na Total3.800.78 Source: The Banker (2008)
institutions, we have the following cases: DEUTSCHE BANK AG (6.25%) in PetroChina, BANK OF AMERICA (11.2%) in China Construction Bank, J.P.MORGAN CHASE & CO. (7.5%) in China Life Insurance and others. They are the second largest stockholders, following a state-owned parent company, and they are very important stockholders of Chinese companies.
In addition, the stockholding by these banks can be conjectured to be the stockholding by the substitute of institutional investors in each country. Since these institutional investors are predicted to take the position of stockholder activism, Chinese companies will be strongly infl uenced.
Finally, I would like to summarize Hong Kong-based companies. The representative Hong Kong companies are Sun Hung Kai Properties (controlled by DIRECTOR WALTER KWOK
& FAMILY) and Cheung Kong (controlled by DIRECTOR LI KA SHING). The latter controls Hutchison Whampoa. Such large, family-run conglomerates are already exceptional in the world.
What is important is that the situation has not changed since I examined in Shimpo (1998, 227-31). In a 1995 investigation by Nihon Keizai Shimbun, Hutchison Whampoa was the third largest Hong Kong company. The ownership ratio of Cheung Kong by LI KA SHING was 33.4%
and the ownership ratio of Hutchison Whampoa by Cheung Kong was 44.1%. Sun Hung Kai Properties was the sixth largest company, and the ownership ratio by DIRECTOR WALTER KWOK & FAMILY was 45.6%. For the former company, two ownership ratios are rising.
2.2 Chinese Companies based on Investigation of China
The examination in Section 2.1 was based on the investigation of the aggregate stock market value by FT. Next, I will consider the investigation of China Enterprise Confederation/ China Enterprise Directors Association, “Top 500 Chinese companies in 2007.” This investigation is based on sales in the 2006 fi scal year, and is mainly an examination of the parent company. I would like to call attention to what is different from the FT rankings. This ranking does not include Hong Kong companies.
Table 5 lists the top 30 companies based upon this examination. Each representative listed company is shown in the right column of each company.
Table 5 shows representative Chinese state-owned enterprises. The three largest state-owned enterprises are China Petrochemical Corporation, China National Petroleum Corporation (CNPC) and State Grid Corporation of China. The State Grid Corporation of China is said to go public under preparation along with China Southern Power Grid Co., Ltd., Agricultural Bank of China and others.
Table 5 Top 30 Chinese Companies by Sales
FT Company Sales in 2006
(ten thousand
yuan) Public Company Ownership Ratio (%) Index 1 6 China Petrochemical Corporation 106,466,742 China Petroleum & Chemical Corporation 75.84 HSI, H-share 2 1 China National Petroleum Corporation (CNPC) 89,380,643 PetroChina Company Lim-ited 86.29 HSI, H-share 3 State Grid Corporation of China 85,452,374
4 3 Industrial and Commercial Bank of China Limited 29,089,700 HSI, H-share 5 2 China Mobile Communications Corpo-ration 28,631,777 China Mobile Limited 74.33 HSI, Red-Chip
6 5 Bank of China 24,219,200 HSI, H-share
7 China Southern Power Grid Co., Ltd. 22,295,670
8 7 China Life Insurance (Group) Company 20,984,606 China Life Insurance(Group) Company 68.37 HSI, H-share 9 China Telecom Group 19,764,546 China Telecom Corporation Limited 70.89 H-share 10 Agricultural Bank of China 19,512,800
11 Sinochem Corporation 18,423,495 Sinofert Holdings Limited 74.00 Red-Chip 12 20 Baosteel Group Corp. 18,068,121 Baoshan Iron & Steel Co., Ltd 73.97 SSE 180 13 China Railway Engineering Corpora-
tion (CRECG) 16,359,641 China Railway Group Lim-ited (China Railway) 58.30 SSE 180
14 4 China Construction Bank 15,159,300 HSI, H-share
15 China Railway Construction Corpora-
tion 14,936,825 China Railway Construction Corporation Limited (CRCC) 63.31 16 China FAW Group Corporation 14,916,914
17 Bailian Group Co., Ltd. 14,823,300 Shanghai Bailian Group CO.,LTD. 44.01 SSE 180 18 China State Construction Engineering
Corporation 14,480,421 China Overseas Land & Investment Ltd 51.84 HSI, Red-Chip 19 Shanghai Automotive Industry
Corporation (Group) 14,358,363 SAIC Motor Corporation Ltd. 83.83 SSE 180
20 COFCO Limited 14,312,948 China Foods Limited 74.25 Red-Chip
21 Dongfeng Motor Corporation 14,168,729 Dongfeng Motor Group Company Limited 66.86 H-share 22 Legend Holdings Ltd. 13,894,689 Lenovo Group Limited 45.13 Red-Chip 23 China Minmetals Corporation 13,475,041 Minmetals Resources Lim-ited 62.39
24 9 China National Offshore Oil Corpora-tion (CNOOC) 13,236,357 CNOOC Limited 64.95 HSI, Red-Chip 25 15 China Ocean Shipping (Group) Com-pany 12,288,250 China COSCO Holdings Company Limited 53.57 H-share
26 China Development Bank 11,718,722
27 China Communications Constructions
Group (Limited) 11,499,171 China Communications Construction Company Ltd. 70.13 H-share 28 Haier Group 10,750,597 Haier Electronics Group Co., Ltd. 74.68
29 19 Aluminum Corporation of China (CHI-NALCO) 10,606,581 Aluminum Corporation of China Limited (CHALCO) 41.82 HSI, H-share 30 China North Industries Group Corpora-
tion (CNGC) 10,595,861
Note: HIS: Hang Seng Index, Red-Chip: Hang Seng China-Affi liated Corporations Index, H-Share: Hang Seng China Enterprises Index.
Source1: China Enterprise Confederation/ China Enterprise Directors Association.
2: Company’s Annual Report and other offi cial documents.
3: Regarding indexes, T&C Financial Research ed. (2008).
Eleven of the FT companies are also found on this list of 30 companies. There is a difference between a company’s aggregate stock market value and its sales standard. Six companies are without an important listed company.
Shown in Table 5 is the parent company’s sales and its shareholding ratio to the listed subsidiary. In Table 5, only the largest stockholder of the listed subsidiary is shown. However, the conclusion obtained in the examination in Table 3 is also applied.
I will examine the companies whose largest stockholder’s ownership ratio is 50% or less. First, Table 3 shows the FT’s 19th ranked Aluminum Corporation of China Limited (CHALCO). For Lenovo Group Limited, the second largest stockholder is IBM CORP, following Legend Holdings Ltd. IBM CORP’s ownership ratio is 4.74% and the remaining ownership is dispersed. However, I cannot confi rm whether the remaining shares are held by local or foreign companies. For Shanghai Bailian Group CO., LTD., I cannot determine the leading stockholder except Bailian Group Co., Ltd. in this company’s data.
Through the previous examination, the stockholding relationship between a parent company and its listed subsidiary becomes considerably clear. However, regarding the entire relationship between them, much is not disclosed. This is called “the holding company risk”*5.
Each market index shows what kind of evaluation these companies have received in the market. Table 5 shows which index each company is included under. The representative companies often compose three Hong Kong indices, the Hang Seng Index (HSI), the Hang Seng China- Affiliated Corporations Index, Red-Chip and the Hang Seng China Enterprises Index, H-share. As the company rank becomes lower, some companies are listed under the SSE180 in the Shanghai market.
In Tables 2 and 3, a manufacturing company is rare. In Table 5, the huge automobile companies, such as China FAW Group Corporation, Shanghai Automotive Industry Corporation (Group) and Dongfeng Motor Corporation fi nally appear. This is because the automobile companies depend so much upon foreign companies. I will examine this problem in detail in the following section.
2.3 Foreign-affi liated Firms in China
In the previous section, the manufacturing industry, one of the most important industries for Chinese economic development, and its relationship with foreign capital was not discussed. In this
*5 Watanabe (2002).
section, I would like to examine this problem, based on MOFCOM’s “Query about Data of Top 500 Sales.”
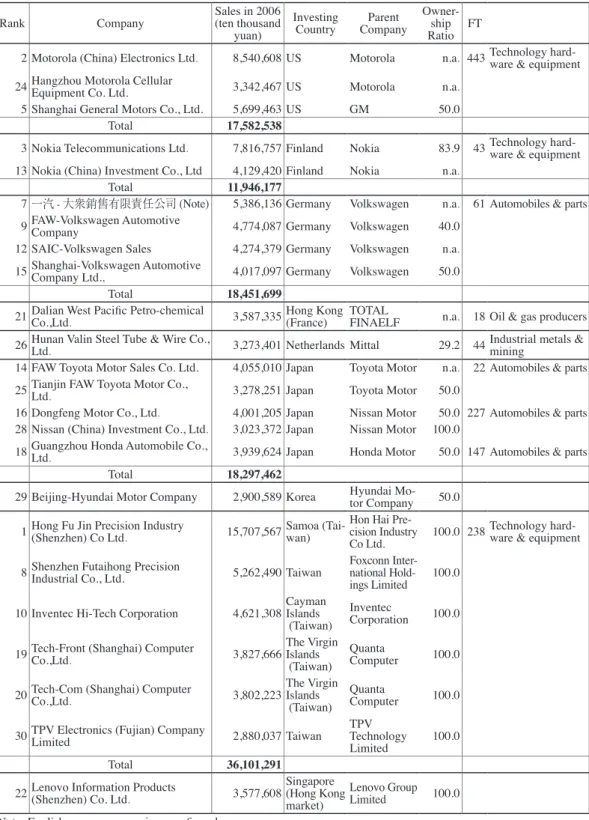
Table 6 regroups the top 30 companies by their investing countries. Although Chinese companies are included in Table 6, I do not examine them in this paper. There are some cases where we cannot get the subsidiary’s data because of size and unavailability of parent company data.
Table 6 shows that Taiwan is the largest investing country. There are six Taiwanese companies on the list, and their sales amount to 361 billion yuan. There are many electronic-related companies, of which Hong Fu Jin Precision Industry (Shenzhen) Co Ltd. has become the largest foreign- affi liated fi rm. The second largest Taiwanese company, Shenzhen Futaihong Precision Industrial Co., Ltd. belongs to Foxconn International Holdings Limited, whose parent company is the Hon Hai Precision Industry Co Ltd. For Taiwanese companies, they own 100% of their subsidiaries, which differs from that of developed countries.
Taiwanese investment in China is, surprisingly, often via tax haven countries. These include Samoa, Cayman Islands, the Virgin Islands and others. The information disclosure by Taiwanese companies is behind. Detailed data for these parent companies are difficult to get, and so it is diffi cult to consider Taiwanese companies as the business of an emerging market economy.
American, German, and Japanese companies follow Taiwanese companies. As an individual foreign company, German Volkswagen has four subsidiaries. Volkswagen has two joint subsidiaries with China FAW Group Corporation, and two joint subsidiaries with Shanghai Automotive Industry Corporation (Group).
In Table 6, China FAW Group Corporation also has two joint subsidiaries with Toyota Motor, and Shanghai Automotive Industry Corporation (Group) has a joint subsidiary with GM.
Dongfeng Motor Corporation, the third largest Chinese automobile company, also has joint subsidiaries. It has established Dongfeng Motor Co., Ltd. with Nissan Motor. Furthermore, Dongfeng Motor Corporation established Dongfeng Peugeot Citroen Automobile Company Ltd with PSA Peugeot Citroen, and Dongfeng Honda Automobile Co., Ltd. with Honda Motor. (China Automotive Industry Yearbook, 75).
Chinese automobile companies can advance technology by linking up with two or more foreign companies, and they can lessen their dependence upon a single foreign company. For foreign companies to advance in the large, closed Chinese market, an alliance with a single
Table 6 Foreign Companies in China, 2006-2007
Rank Company Sales in 2006
(ten thousand
yuan) Investing
Country Parent
Company Owner- ship Ratio FT
2 Motorola (China) Electronics Ltd. 8,540,608 US Motorola n.a. 443 Technology hard-ware & equipment 24 Hangzhou Motorola Cellular Equipment Co. Ltd. 3,342,467 US Motorola n.a.
5 Shanghai General Motors Co., Ltd. 5,699,463 US GM 50.0
Total 17,582,538
3 Nokia Telecommunications Ltd. 7,816,757 Finland Nokia 83.9 43 Technology hard-ware & equipment 13 Nokia (China) Investment Co., Ltd 4,129,420 Finland Nokia n.a.
Total 11,946,177
7一汽 - 大衆銷售有限責任公司 (Note) 5,386,136 Germany Volkswagen n.a. 61 Automobiles & parts 9 FAW-Volkswagen Automotive Company 4,774,087 Germany Volkswagen 40.0
12 SAIC-Volkswagen Sales 4,274,379 Germany Volkswagen n.a.
15 Shanghai-Volkswagen Automotive Company Ltd., 4,017,097 Germany Volkswagen 50.0
Total 18,451,699
21 Dalian West Pacifi c Petro-chemical Co.,Ltd. 3,587,335 Hong Kong (France) TOTAL
FINAELF n.a. 18 Oil & gas producers 26 Hunan Valin Steel Tube & Wire Co., Ltd. 3,273,401 Netherlands Mittal 29.2 44 Industrial metals & mining 14 FAW Toyota Motor Sales Co. Ltd. 4,055,010 Japan Toyota Motor n.a. 22 Automobiles & parts 25 Tianjin FAW Toyota Motor Co., Ltd. 3,278,251 Japan Toyota Motor 50.0
16 Dongfeng Motor Co., Ltd. 4,001,205 Japan Nissan Motor 50.0 227 Automobiles & parts 28 Nissan (China) Investment Co., Ltd. 3,023,372 Japan Nissan Motor 100.0
18 Guangzhou Honda Automobile Co., Ltd. 3,939,624 Japan Honda Motor 50.0 147 Automobiles & parts
Total 18,297,462
29 Beijing-Hyundai Motor Company 2,900,589 Korea Hyundai Mo- tor Company 50.0 1 Hong Fu Jin Precision Industry (Shenzhen) Co Ltd. 15,707,567 Samoa (Tai-wan) Hon Hai Pre-
cision Industry
Co Ltd. 100.0 238 Technology hard-ware & equipment 8 Shenzhen Futaihong Precision Industrial Co., Ltd. 5,262,490 Taiwan Foxconn Inter-
national Hold- ings Limited 100.0 10 Inventec Hi-Tech Corporation 4,621,308Cayman
Islands
(Taiwan) Inventec
Corporation 100.0 19 Tech-Front (Shanghai) Computer Co.,Ltd. 3,827,666The Virgin
Islands
(Taiwan) Quanta
Computer 100.0 20 Tech-Com (Shanghai) Computer Co.,Ltd. 3,802,223The Virgin
Islands
(Taiwan) Quanta
Computer 100.0 30 TPV Electronics (Fujian) Company Limited 2,880,037 Taiwan TPV
Technology
Limited 100.0
Total 36,101,291
22 Lenovo Information Products (Shenzhen) Co. Ltd. 3,577,608Singapore (Hong Kong market)
Lenovo Group Limited 100.0 Note: English company name is unconfi rmed.
Source 1: MOFCOM and The 21st Century China Research Institute.
2: Company’s Annual Report and other offi cial documents.
Chinese company is accompanied by great risk. As such, both sides’ strategy often leads to peculiar relationships.
Thus, many major subsidiaries of Chinese automobile companies are composed of an unlisted joint firm with two or more foreign companies. Furthermore, a listed company within a group is also a member of each group. Such complicated relationships make the actual state of these companies unclear. The above conditions make the position of Chinese automobile companies low in terms of their stock market value.
2.4 Fundamental Features of Chinese Companies
Chinese companies appearing as a result of the policy of reform in 1978 and afterwards are characterized as being State Monopoly Enterprises based on the previous examination. They are distinguished from a State-Owned Enterprise, which the government owns entirely, in the socialist age.
The term State Monopoly Enterprise is not very often currently used. Marxian economists use the term State Monopoly Capitalism when referring to the developing stages of monopoly capitalism. As mentioned below, the term State Monopoly Enterprise is appropriate in characterizing a former socialist country’s company which continues its dominance in the economy on the basis of building a market economy.
The following are features of state monopoly enterprises:
1. Although a state-owned enterprise is privatized, it maintains approximately a two thirds ownership ratio as a holding company, and thus substantially controls its management. Its corporate governance very much differs from the popular market-centered corporate governance in developed countries.
2. The most effi cient part of all state-owned enterprise resources is that they are transferred to a public corporation, and state monopoly enterprises maintain monopolistic status in each market.
This monopoly often becomes not only a domestic monopoly, but a global monopoly as well due to China’s large size.
3. Such a monopolistic position brought about the adhesion and unifi cation with politics, and, in certain cases, corruption.
State monopoly enterprises also have the following features in the age of economic globalization:
1. The overseas institutional investor is often a second largest stockholder after a state-owned
enterprise.
2. In the more advanced industries, such as automobile and electronics, the dependence on foreign companies is varied and strong.
In the fi rst stage of industrialization, a state monopoly enterprise often creates an environment that efficiently promotes economic growth. Take, for example, the postwar period. The role of government, family-run conglomerates*6 and state monopoly enterprises was critical to the East Asian export-oriented industrialization. However, as a state monopoly enterprise grows, the harmful effects, such as organizational bureaucratization and the monopoly’s market control, appear. As people’s lives become richer, criticism of the conditions is brought to light. This is the change that happened in East Asia.
In this process, Chinese corporate governance is shifting from the socialism model, in which a state-owned enterprise governs the overall economy, to the developing country model in which a state-owned enterprise, family-run conglomerates and a foreign company all have great infl uence.
Since both China and Russia seceded from the socialism model, the corporate governance of socialism models will lose much of their infl uence on the world.
I will discuss briefly about the relationship between Chinese corporate governance and its foreign direct investment (FDI). Though China is a host country of FDI, the outward FDI increases rapidly. In another paper, I will examine this situation in detail. Generally, there is close relationship between the corporate governance and FDI. I have already considered about this relationship in the Japanese case in detail.
Table 7 is the list of top 20 Chinese companies by FDI stock in 2007. Unfortunately, the amount of each company’s stock isn’t shown. The state owned enterprises which appear in Table 5 including China National Petroleum Corporation, China Petrochemical Corporation line up. The fi fth-ranked China Resources (Holdings) Co., Ltd. and the sixth-ranked CITIC Group in Table 5 ranked 33rd and 42nd respectively.
In China, state monopoly enterprises have heavy infl uences in the entire economy, and they lead the foreign investment at the same time.
How will Chinese companies change? If the Chinese government is going to further advance
*6 Family-run conglomerates mean Zaibatsu in Japanese.
privatization, it will be diffi cult to fi nd stockholders for the huge Chinese companies. Until now, the development of a private institutional investor has not been enough in China. Thus, the role of an overseas institutional investor will become more important as a stockholder of Chinese companies.
Since the control of the government or a state-owned enterprise also cannot but become relatively weaker, this has been a diffi cult issue for the Chinese government.
Moreover, regarding the dependence upon foreign companies, the Chinese government wants to weaken this dependence and aims at nationalization. However, since the technical innovation in the developed country’s companies has rapidly progressed and the innovation fi eld has expanded, the alliance of Chinese companies with the developed country’s companies is deepening.
Furthermore, if the capital market’s liberalization is advanced, M&A by companies in developed countries will also be actively performed.
In this way, state monopoly enterprises stand at a crossroad. The crossroad is whether to join the global economy, turn back to a closed national economy, so-called socialism again. This depends upon the intentions of the Chinese government and its people. To reach a decision, they will need to ask what the state and political system’s role in supporting a state monopoly enterprise should be.
Table 7 The 40 Largest Chinese Companies Ranked by Outward FDI Stock, 2007
No. Name of Enterprise Rank in Table 5 FT
1 China National Petroleum Corporation 2 1
2 China Petrochemical Corporation 1 6
3 China National Offshore Oil Corporation 24 9
4 China Ocean Shipping (Group) Company 25 15
5 China Resources (Holdings) Co., Ltd.
6 CITIC Group
7 China National Cereals, Oils & Foodstuffs Corp 20
8 China Mobile Communications Corporation 5 2
9 Sinochem Corporation 11
10 China Merchants Group
11 Shum Yip Holdings Company Limited 12 China Shipping (Group) Company
13 China National Aviation Holding Corporation 14 China National Chemical Corporation
15 China State Construction Engineering Corporation 18 16 SinoSteel Corporation
17 China Network Communications Group Corporation
18 Aluminum Corporation of China 29 19
19 GDH Limited
20 China Minmetals Corporation 23
Note: Some errors in the original table are corrected.
Source: http://hzs2.mofcom.gov.cn/accessory/20080928/1222502733006.pdf
The number of studies on Chinese corporate governance, especially on its decision-making process, is increasing. I would like to introduce some of the studies and comment on them.
Hovey (2006) is one of the most comprehensive studies on Chinese corporate governance. He focuses on institutional ownership through Legal Person holding companies, distinguishing a state- owned enterprise and foreign subsidiaries. However, he does not adequately clarify the individual data regarding the institutional ownership through Legal Person holding companies. Li (2008) outlines a governance evaluation system and establishes a corporate governance index.
Based upon the knowledge gained from these studies, I believe the following: We seldom fi nd studies on the actual conditions of a state-owned enterprise, its successor and the relationship between them, especially on the development process of privatization and the comprehensive structural reform in China.
The old argument appears again. The famous Max Weber and others’ comparative discussion on the Western Protestantism, the Eastern Confucianism and the important difference in the economy and the management system between them. As a result, the Eastern or Asian common features, the communitarianism are found (Chen, 29). As I will examine the characteristics of each Asian country’s company in Section 3.3, there is no need of further discussion on this theme.
As I will discuss later, we can’t detect even the pan-Chinese management, the argument on Asian management which targets a wider range will be unrealistic.
3 Corporate Governance in Russia, Singapore, Korea and Taiwan
In Section 3, I will examine the important countries in East Asia other than China. In this paper, I will consider Russia especially. Russia’s political and economic role in East Asia and the world is expanding. Examining Russia is indispensable to the understanding of China, which this paper has already focused on in detail. In the second half of Section 3, I will survey Singapore, Korea and Taiwan.
3.1 Russian Corporate Governance
First, in Table 8, I would like to list the companies from the four countries and regions shown in FT Global 500 2008. Of these, Russian companies number 13, and their aggregate market value is 820 billion dollars.
Of the Russian companies, fi ve are oil and gas, making this industry highly represented. The