2035
PAPER
Special Section on Recent Progress in Measurement and Design Techniques on Antennas, Propagation and Wireless SystemsA Novel SAR-Probe Calibration Method Using a Waveguide Aperture in Tissue-Equivalent Liquid
Nozomu ISHII†,††a),Senior Member, Lira HAMADA††,andSoichi WATANABE††,Members
SUMMARY A novel method for calibrating the probes used in stan- dard measurement systems to evaluate SAR (specific absorption rate) of the radio equipment operating at frequencies over 3 GHz is proposed. As for the proposed method, the electric-field distribution produced by a wave- guide aperture installed in a liquid container is used to calibrate the SAR probe. The field distribution is shown to be the same as that given by a con- ventional calibration method by analytically deriving a closed-form expres- sion for the field produced by the waveguide aperture with the help of the paraxial approximation. Comparing the approximated and measured distri- butions reveals that the closed-form expression is valid for the electric-field distribution near the central axis of the aperture. The calibration factor for a commercial SAR probe is evaluated by the proposed method and agrees well with that provided by the manufacturer of the probe.
key words: specific absorption rate (SAR), probe calibration, tissue- equivalent liquid, waveguide aperture
1. Introduction
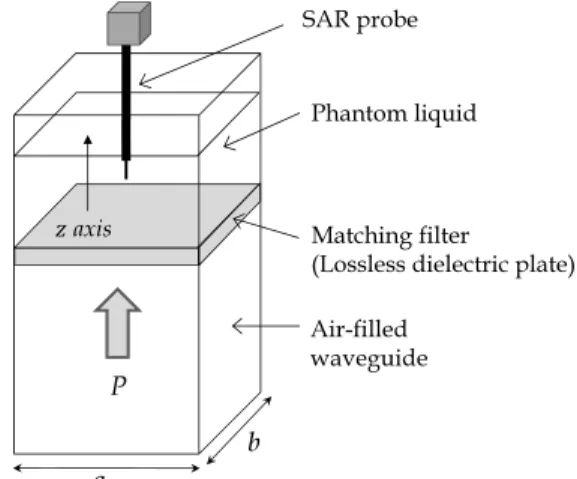
To evaluate the value of SAR (specific absorption rate) of mobile communication devices operating in various fre- quency bands, several methods for calibrating the probes for detecting the electric-field intensity in the phantom liquid surrounded by a container that is used in the standard SAR measurement have been developed [1]. Until now, a cali- bration method using a waveguide as shown in Fig. 1 has been used to calibrate a probe operated in the band ranging from 800 MHz to 3 GHz, that is used for mobile phones. As shown in Fig. 1, input power is supplied to the phantom liq- uid from the air-filled waveguide, and an electric field can be generated in the phantom liquid surrounded by the wave- guide wall and dielectric plate which functions as a match- ing window [1]. The electric-field intensity can be analyti- cally evaluated if the input power is given. The calibration factor, CF, relates the power density of the electromagnetic fields at the sensor of the probe to the dc output voltage of the probe.
In regard to the frequency band used for mobile phones, it is not difficult to construct a measurement system for cal- ibrating the probe in the above-described manner, because the size of the waveguide aperture allows the probe to be inserted in a waveguide filled with a phantom liquid. As for the 400-MHz radio bands in Japan, however, the size
Manuscript received February 3, 2014.
Manuscript revised May 13, 2014.
†The author is with the Faculty of Engineering, Niigata Uni- versity, Niigata-shi, 950-2181 Japan.
††The authors are with the National Institute of Information and Communications Technology, Koganei-shi, 184-8795 Japan.
a) E-mail: [email protected] DOI: 10.1587/transcom.E97.B.2035
Fig. 1 Conventional calibration system for SAR probe using a wave- guide.
of the aperture is so physically large that the measurement system for calibrating the probe with the waveguide cannot be practically constructed. To solve this problem, a new method for calibrating the electric-field probe was proposed [2]. This method uses an extended Friis transmission for- mula for point sources in the Fresnel region. The validity of the method in regard to the lower frequency band, including the 400-MHz bands, was confirmed [2].
In contrast, to calibrate the probe by using the wave- guide for the higher frequency band, including the 5.2-GHz band for wireless LAN, the diameter of the probe should be made smaller because the effect of a probe with larger diam- eter is not negligible as compared with that of the area of the waveguide aperture. It may therefore be a serious problem that the probe’s estimated CF contains larger uncertainty as the volume of the waveguide aperture decreases.
As a solution to this potential problem, Li et al. pro- posed another calibration method; namely, the probe is cali- brated in a liquid container with an air gap above the wave- guide aperture [3]. The distribution of the electric-field in- tensity obtained by FDTD simulation gives close agreement with that obtained by experiment and the value of SAR can be evaluated by approximating the electric-field intensity with a polynomial expression of the distance of the obser- vation point from the base of the container. However, to es- tablish a reliable calibration standard, not only a numerical- simulation approach but also a theoretical formulation is re- quired in view of developing a precise calibration technique.
In addition, obtaining a mathematical expression of the field Copyright c2014 The Institute of Electronics, Information and Communication Engineers
Fig. 2 Waveguide aperture immersed in a homogeneous lossy medium.
intensity in the liquid enables parametric analysis of factors such as temperature dependence of the electrical properties of the liquid. In view of the formulation of the field in the liquid used in the calibration setup described in [3], the ef- fects of the layers composed of the liquid, the dielectric con- tainer shell, and the air have to be included. These effects include multiple reflections between these media and field leakage to the air between the shell and the aperture. These factors that affect the field distribution should be considered as uncertainty sources. To avoid such a complex formula- tion for approximating the electric-field, the authors have been examining the frequency extension of the calibration system for liquid by using an open-ended waveguide as a standard antenna instead of a dipole antenna, as shown in Fig. 2 [4]–[7]. As for this system, since the waveguide is di- rectly inserted into the liquid, the complexity due to the sys- tem structure described in [3] is reduced. The closed-form to express the field distribution near the aperture should be analytically derived, and its asymptotic approximation can be formed asea(x, y)e−γz, whereea(x, y) is the aperture dis- tribution, e−γz is a decaying factor, and γis the propaga- tion constant in the liquid. These facts are the advantages of the proposed method, hereinafter referred to as “waveguide aperture method”, because the expression for the electric field is similar to that used in the conventional calibration method described in [1], hereinafter referred to as “conven- tional waveguide method”. A similar algorithm to the con- ventional waveguide method can therefore be used to find the calibration factor of the probe for the waveguide aper- ture method.
In this paper, first, an approximate expression for the electric field near a waveguide aperture immersed in a liq- uid is derived by using paraxial approximation. This deriva- tion is rather elaborate, but the electric-field distribution ra- diated by the aperture to calibrate the probe can be given as a closed-form expression. Next, the derived expression is validated by measuring the corresponding electric-field dis- tribution in front of the aperture in the liquid. Moreover, it is demonstrated that the probe can be calibrated by using the waveguide aperture method, where the same algorithm as that for the conventional waveguide method can be used.
Fig. 3 Probe-calibration system using a waveguide aperture.
2. Waveguide Aperture Method
2.1 System Configuration
Figure 3 shows a probe-calibration system using a wave- guide aperture. This system is similar to the conventional system described in [1], except that the waveguide aperture is used as a reference antenna. In this system, the electric field is produced by the aperture and detected by the SAR probe in the phantom liquid surrounded by a container. The aperture is a truncated cross-section of a straight rectangu- lar waveguide with dimensions ofa×b, as shown in Fig. 2.
A rectangular dielectric slab is inserted into a rectangular waveguide to fit its aperture for the matching window, which functions as a quarter-wave transformer between the air re- gion of the waveguide and phantom liquid. Moreover, the net input power to the aperture can be evaluated by mea- suring the magnitude of the reflection coefficient with a di- rectional coupler and power meters, and the position of the probe, which is attached to the detecting unit, can be con- trolled by a robot arm. The dc output voltage of the probe, V, is approximately proportional to the squared electric-field intensity,E2, which can be estimated from a closed-form ex- pression including net input power, the electrical constants of the liquid, and the geometric parameters of the aperture.
The calibration factor of the probe can be determined as CF = V/E2. Ideally, the probe should be aligned along the central axis of the aperture to reduce the uncertainty of the measurement. The closed-form expression to estimate the electric-field near the aperture is given as ea(x, y)e−γz, which is the same expression as that for the conventional waveguide method, as mentioned before. It is analytically derived as follows.
2.2 An Expression to Represent the Field Near the Wave- guide Aperture in the Liquid
The coordinates and dimensions of the waveguide aperture in the liquid as a homogeneous lossy media are shown in
2037
Fig. 2. The aperture occupies an area of|x| ≤a/2,|y| ≤b/2, z = 0, the origin of the coordinate, O, is selected as the center of the aperture, and thezaxis is perpendicular to the aperture. In the formulation, an electric field, ea(x, y), is assumed to exist on the aperture; otherwise, no electric field is assumed to exist. In practice, the dielectric slab for the matching window is inserted into the waveguide. Only the TE10 mode is used to know the important behavior of the eletctric-field intensity near the aperture. For|x|<a/2 and
|y|<b/2, the aperture distribution is assumed to be given as ea(x, y)=yˆey(x, y)
=yEˆ 0sinam
x+a
2
cosbn
y+b
2
, (1)
where E0 is a constant, am = mπ/a and bn = nπ/b for m = 1,2,· · · andn = 0,1,2,· · ·, and ˆy denotes the unit vector in theydirection. The field produced by this aperture distribution is given as [8]
E(x, y,z)=(ˆθsinφ+φˆcosθcosφ) γ
2π b/2
−b/2
a/2
−a/2
ey(x, y)e−γR
R dxdy, (2) where R is the distance between the observation point (x, y,z) and the source point on the aperture (x, y,0) and is given as
R=
(x−x)2+(y−y)2+z2,
and ˆθand ˆφdenote the unit vectors in theθandφdirections.
It follows that under the paraxial approximation, (x−x)2+ (y−y)2 z2, the distance,R, can be approximated as
R≈z+(x−x)2+(y−y)2
2z .
The field can thus be approximated as E(x, y,z)≈yˆγe−γz
2πz b/2
−b/2
a/2
−a/2ey(x, y) exp
−γ(x−x)2+(y−y)2
2z dxdy (3)
After the substitution of Eq. (1) into Eq. (3) and some ma- nipulations,E(x, y,z) can be expressed as
E(x, y,z)≈yˆ E0
16jexp
−
γ+a2m+b2n 2γ
z
·
ejam(x+a/2){F(a/2−x,−am)+F(a/2+x,am)}
−e−jam(x+a/2){F(a/2−x,am)+F(a/2+x,−am)}
·
ejbn(y+b/2){F(b/2−y,−bn)+F(b/2+y,bn)}
+e−jbn(y+b/2){F(b/2−y,bn)+F(b/2+y,−bn)} , (4) where
F(p,q)=erf
p γ
2z+jq z
2γ
. (5)
erf(w) is the error function with a complex argument,w, de- fined as [9]
erf(w)= 2
√π w
0
e−t2dt.
The argument of the error function in Eq. (5) can be reduced to
p γ
2z+ jq z
2γ =p γ
2z
1+ jq 2γpz
(6) At this point, the following condition is assumed,
jq 2γpz≤ z
|γ|max am
a ,bn
b
1,
becausep=a/2∓xandq=±amorp=b/2∓yandq=±bn
are permitted as clear from Eq. (4). The above condition is rewritten as
z |γ|min a
am
, b bn
= |γ|
π min a2
m,b2 n
, (7)
forn0 and z |γ|a2
mπ , (8)
forn=0, where min(s,t) is a function to select the smaller value from real numberssandt. The above condition means thatz, which corresponds to the minimum distance from the aperture, is small enough to satisfy conditions (7) or (8).
Therefore, near the waveguide aperture,F(p,q) can be ap- proximated as
F(p,q)≈erf
p γ
2z
≈1− e−p2γ/2z
√πp
γ/2z ≈1, where an asymptotic formula, namely,
erf(w)≈1− e−w2
√πw for|w| → ∞, |arg(w)|< 3π 4 , is used for the error function [9]. For example, the at- tenuation and phase constants in the liquid used for SAR evaluation at 5.2 GHz are given as α = 143 nepers/m and β = 669 rad/m, respectively [10]. The dimensions of the waveguide aperture are selected as a = 47.55 mm and b = 22.15 mm in our experiment as explained later. The condition (8) is thus changed to z 0.49 m, that is, the above approximation is valid for the region near the wave- guide aperture, namely,z<25 mm, as chosen later. It is thus valid for the liquid used in the SAR evaluation if the obser- vation point is close to the aperture,F(p,q) can be regarded as 1, and Eq. (4) is approximated as
E(x, y,z)≈yEˆ 0exp
−
γ+a2m+b2n 2γ
z
·sinam
x+a
2
cosbn
y+b
2
, (9)
for the TEmnor TMmnmodes and E(x, y,z)≈yEˆ 0exp
−
γ+ π2 2γa2
z cos
πx a
, (10)
for the TE10mode. Under the condition,|γ|2(a2m+b2n)/2, in the case of liquid, Eqs. (9) and (10) can be also reduced to
E(x, y,z)≈yˆE0sinam
x+a
2
cosbn
y+b
2
e−γz
=ea(x, y)e−γz, (11)
for the TEmnor TMmnmode and E(x, y,z)≈yEˆ 0cos
πx a
e−γz. (12)
for the TE10mode The above condition is valid because, for example, |γ|/(π/a) = 4.5×10⁴ 1 or |γ| |π2/2γa2| for the TE10 mode for the liquid used in SAR evaluation at 5.2 GHz.
Thus, the electric field is near the waveguide aperture can be formed asea(x, y)e−γr, whereea(x, y) is aperture dis- tribution, and e−γr is a decaying factor for liquid, as ex- pected.
2.3 Distance Dependence of Electric-Field Intensity Pro- duced by Waveguide-Aperture and Calibration Factor CF of the probe can be determined by measuring the dc volt- age of the probe as it is moved along the central axis of the waveguide aperture, orzaxis, mounted in a liquid container, as shown in Fig. 3. The net power input into the aperture via the air-filled waveguide, Pnet, can also be computed from the surface integral of the power density on the aperture.
For TE10mode, it can be calculated as Pnet=
b/2
−b/2
a/2
−a/2
Re 1
η
|ea(x, y)|2dxdy= |E0|2σab 4α .
(13) In the above calculation, the relationship Re(1/η) = σ/2α is used, whereηandσare the intrinsic impedance and con- ductivity of the liquid, respectively. Equation (12) gives the squared electric-field intensity near the aperture as
|E(x, y,z)|2≈4αPnet
σab cos2 πx
a
e−2αz. (14) The above expression is valid for the case that the obser- vation point is located near the central axis of the aperture because the paraxial approximation for the distance, R, is enforced. This means that the procedure of the conventional waveguide method can be employed for the waveguide aper- ture method to determine the electric-field intensity near the
aperture since a fitting function, that is, an exponentially de- caying function for the wavegude aperture method is appli- cable to that for the conventional waveguide method [1]. In addition, the dB representation of squared electric-field in- tensity along the central axis of the aperture is given as
|E(0,0,z)|2dB≈10 log10 4αPnet
σab
−8.686αz, (15) which is a linear function ofzwith negative slope.
The calibration factor for the near-field region of the probe, CFnear(z), defined as the ratio of the probe output voltage, V(z), to the square of the electric-field intensity along the central axis of the aperture, |E(0,0,z)|2, is given as
CFnear(z)= V(z)
|E(0,0,z)|2 [μV/(V/m)2]. (16) Atz→ ∞, CFnear(z) converges with CF, which is constant and defined as the ratio of the output voltage to the square of the electric-field intensity for the far-field region of the probe.
3. Measured Field Distribution in Front of Waveguide Aperture and Calibration Factor for Probe
3.1 Practical Calibration System for Waveguide Aperture Method
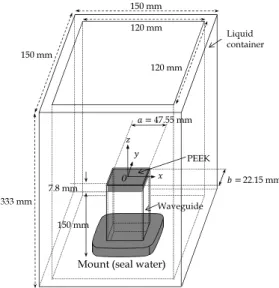
Figure 4 shows a liquid container and waveguide aperture mounted on an air-filled waveguide for probe calibration at 5.2 GHz. The waveguide aperture consists of a dielec- tric slab of PEEK which has a dielectric constant of 3.4 and thickness of 4 mm. The aperture size of the waveguide is about 47.55 by 22.15 mm (WRI-48). The liquid con- tainer has a cross-section of 150 mm2 and a height of about 330 mm. Parameters used for our probe-calibration system
Fig. 4 Waveguide aperture for the 5.2-GHz band set in the liquid container.
2039
Table 1 Important parameters for probe-calibration system using wave- guide aperture.
Frequency 5.200 GHz
Waveguide Aperture WRI-48 (a=47.55 mm,b=22.149 mm) Matching Window PEEK 4 mm, εr=3.4,σ=0 S/m Liquid Container 150 mm×150 mm×330 mm
Phantom Liquid HT5200 (NTT-AT) εr=36,σ=4.66 S/m
Detector DAE4 (SPEAG)
Measurement System DASY5.2 (SPEAG) Equipment Under Test EX3DV4 (SPEAG)
Manufacturer CAL Factor : 4.94 [μV/(V/m)2] NTT-AT: NTT Advanced Technology, Japan SPEAG: Schmidt & Partner AG, Switzerland
Fig. 5 Normalized electric-field intensity along linesy=0 mm andz= 5 mm, where “FDTD” denotes the values simulated by the FDTD simulator (SEMCAD), and “Approximated” denotes the values calculated by using ea=e1cos(πx/a), wheree1is a constant.
are listed in Table 1. The dielectric constants of the liquid were measured asεr =35.49 andσ =4.58 S/m by use of the coaxial probe method.
Along the vertical axis at the center of the aperture, the electric field intensity can be related to the dc output volt- age of the probe by applying the conventional waveguide method. The configuration of our probe-calibration system can be made to calibrate the probe used in another operating frequency band by changing the reference antenna as shown in Fig. 4.
3.2 Measured Transversal Field Distribution Produced by the Waveguide Aperture
To measure the electric field intensity in a plane parallel to the aperture, the probe can be moved in thexandydirec- tions at 5 mm above the aperture.
Figure 5 shows normalized voltage of the probe as a function of the probe’s position, x, where dots denote measured voltage, solid line denotes the FDTD simulation (SEMCAD) results, and the dashed line denotes an approx- imated sinusoidal curve, given by Eq. (12), which can be determined by a curve fitting. Clearly, the measurement and simulation results agree well.
Figure 6 shows normalized voltage of the probe as a function of the probe’s position,y, where dots denote mea-
Fig. 6 Normalized electric-field intensity along linesx=0 mm andz= 5 mm, where “FDTD” denotes the values simulated by the FDTD simulator (SEMCAD) and “Approximated” denotes the values calculated by using ea=e1cos(πx/a), wheree1is a constant.
sured voltage, the solid line denotes the FDTD simulation results, and the dashed line denotes the approximated curve, which is shaped like a gate function. The measured and sim- ulated curves agree well. As clear from this figure, the mea- sured curve is almost the same as the approximated curve except the edge of the waveguide aperture. This means the waveguide aperture method is almost the same as the con- ventional waveguide method for the electric field intensity except a slight difference near the edge of the aperture.
Figures 7(a) and (b) show two-dimensional distri- butions of the measured and simulated electric fields at plane z = 5 mm. The simulation and measurement re- sults agree well. Moreover, near the edge of the aper- ture, the electric-field distribution slightly differs from the rectangular-waveguide TE10cross-sectional distribution.
Figure 7(c) shows the relative difference between the mea- sured and approximated electric-field intensities. Near the center of the aperture, the difference is so small that the al- gorithm as that used in the conventional waveguide method can be used.
3.3 Measured Longitudinal Field Distribution Produced by the Waveguide Aperture
Figure 8 shows measured and simulated electric field inten- sities in the dB representation as a function of the distance from the aperture. In the figure, dots and dashed line denote measured and simulated distributions, respectively. The at- tenuation constant of the liquid estimated from a regression line for measured field intensity is given as 132 nepers/m.
The slopes of the two lines seem to agree well. This ex- perimental evidence quantitatively confirms the exponential decay of the electric-field intensity near the aperture.
3.4 Example of Evaluating Calibration Factor
Table 2 lists estimated calibration factors for a SAR probe.
The voltage output from the probe, V(z), is measured as a function of distancez. According to the relationships given
Fig. 7 Two-dimensional electric-field distribution atz=5 mm.
in (15) and (16), the calibration factor for the probe is eval- uated by curve fitting ranging fromz =5 mm to 12.5 mm.
The above process is repeated five times, and the averaged value of the calibration factor is 4.91μV/(V/m)2. In the same range, the variation is less than 0.25% or 0.01 dB.
The difference between the fitted and measured curves as a function of distancezfor the experiment is 0.1 dB or less for 2.5 mm≤z≤12.5 mm, as shown in Fig. 9. The differ- ence is larger aszgets closer to zero, because the coupling effect between the probe and the aperture of the waveguide
Fig. 8 Electric-field intensity distribution along thezaxis.
Table 2 Estimated values of calibration factor for SAR probe (SPEAG EX3DV4) at 5.2 GHz.
1st 2nd 3rd 4th 5th Ave.
CF [μV/(V/m)2] 4.92 4.90 4.93 4.93 4.88 4.91 Error [%] 0.10 −0.28 0.43 0.43 −0.68 0.25
Fig. 9 Relative difference between fitted and measured electric field in- tensities along thezaxis.
cannot be ignored. Moreover, the difference is larger asz gets larger forz> 12.5 mm, because of weak reception of the probe, which is concerned with its dynamic range. Thus, the fitting range should be selected in accordance with the frequency band under test to more accurately calibrate the probe.
The difference of the average calibration factor from that provided by the manufacturer, 4.96μV/(V/m)2, is
−0.57%. The latter calibration factor provided by the man- ufacturer is evaluated by using the conventional waveguide method [1] and has an expanded uncertainty of±13.1% (k= 2), wherekis the converge factor. In consideration of this uncertainty, the proposed waveguide aperture method gives quite a close calibration factor to that given by the conven- tional waveguide method, and the effectiveness of the pro- posed waveguide aperture method is validated.
4. Conclusions
A novel method for calibrating an SAR probe is proposed,
2041
formulated, and experimentally shown to provide accurate probe calibration in the 5-GHz band. The proposed method is based on the fact that a waveguide aperture immersed in a phantom liquid can produce an exponentially decaying field in its vicinity in the same manner as the conventional wave- guide method for calibrating an SAR probe. The above fact was analytically derived by applying the approximation to the field integral. Moreover, the algorithm for the conven- tional method can also be used for the proposed waveguide aperture method, without modification, to obtain the calibra- tion factor for the SAR probe as long as the probe scans near center of the aperture. The proposed method is validated by the fact that the estimated calibration factor closely agrees with that provided by the manufacturer of the probe.
As for further study, the uncertainty of the calibration factor for the probe obtained by the proposed method should be practically estimated. It would be caused by systematic errors related to the formulation of the electric-field intensity produced by the waveguide aperture immersed in the liquid as well as the uncertainties related to the dielectric constant, conductivity of the liquid, probe positioning, and field ho- mogeneity, in the simular manner as the conventional wave- guide method.
Acknowledgments
A part of this research was financially supported by the Min- istry of Internal Affairs and Communications of Japan.
References
[1] IEC International Standard 62209-1, “Human exposure to radio frequency fields from hand-held and body-mounted wireless com- munication devices — Human models, instrumentation, and proce- dures — Part 1: Procedure to determine the specific absorption rate (SAR) for hand-held devices used in close proximity to the ear (fre- quency range of 300 MHz to 3 GHz),” Feb. 2005.
[2] N. Ishii, Y. Miyota, K. Sato, L. Hamada, and S. Watanabe, “SAR- probe calibration system using reference dipole antenna in tissue- equivalent liquid,” IEICE Trans. Commun., vol.E95-B, no.1, pp.60–
68, Jan. 2012.
[3] Q. Li, O.P. Gandhi, and G. Kang, “An open-ended waveguide system for SAR system validation or probe calibration for frequencies above 3 GHz,” Phys. Med. Biol., vol.49, pp.4173–4186, 2004.
[4] L. Hamada, Y. Miyota, K. Sato, N. Ishii, and S. Watanabe, “A SAR- probe calibration system using a reference waveguide antenna in tissue-equivalent liquid,” Abstracts for the 32nd Bioelectromagnet- ics Society Annual Meeting, PA-33, Seoul, Korea, June 2010.
[5] N. Ishii, Y. Miyota, K. Sato, L. Hamada, and S. Watanabe, “Field distribution by open waveguide in the tissue-equivalent liquid,”
Proc. 2010 Asia-Pacific Radio Science Conference, KAE-4, To- yama, Japan, Sept. 2010.
[6] N. Ishii, Y. Miyota, L. Hamada, and S. Watanabe, “Effect of higher modes on waveguide aperture covered by a dielectric slab in the liq- uid,” Proc. ISAP 2011, FrF1-2, Jeju, South Korea, Oct. 2011.
[7] N. Ishii, L. Hamada, and S. Watanabe, “An experimental validation of a SAR-probe calibration system using a reference waveguide an- tenna in tissue-equivalent liquid,” Abstracts for the 34th Bioelec- tromagnetics Society Annual Meeting, O4.6, pp.34–36, Brisbane, Australia, June 2012.
[8] R.E. Collin and F.J. Zucher ed., Antenna Theory part 1, chapter 3, McGraw-Hill, 1969.
[9] M. Abramowitz and I. Stegun, Handbook of Mathematical Func- tions with Formulas, Graphs, and Mathematical Tables, Dover, 1965.
[10] IEC International Standard 62209-2, “Human exposure to radio frequency fields from hand-held and body-mounted wireless com- munication devices — Human models, instrumentation, and proce- dures — Part 2: Procedure to determine the specific absorption rate (SAR) for wireless communication devices used in close proximity to the human body (frequency range of 30 MHz to 6 GHz),” March 2010.
Nozomu Ishii received B.S., M.S., and Ph.D. degrees from Hokkaido University, Sap- poro, Japan, in 1989, 1991, and 1996, respec- tively. In 1991, he joined the faculty of En- gineering at Hokkaido University. Since 1998, he has been with the faculty of Engineering at Niigata University, Japan, where he is currently an Associate Professor of the Department of the Biocybernetics. His current interests are in the area of small antennas and antenna analysis and measurement. He is a member of the IEEE.
Lira Hamada received Ph.D. degree from Chiba University, Chiba, Japan, in 2000. From 2000 to 2005, she was with the Department of Elec- tronics Engineering, University of Electro-Communications, Chofu, To- kyo, Japan. Since 2005, she has been with the National Institute of Infor- mation and Communications Technology (NICT), Koganei, Tokyo, Japan.
She is responsible for the measurement and calibration technique for the SAR evaluation system. Dr. Hamada is a member of the IEE of Japan, the IEEE, and the Bioelectromagnetics Society.
Soichi Watanabe received B.E., M.E., and D.E., degrees in electrical engineering from To- kyo Metropolitan University, Tokyo, Japan, in 1991, 1993, and 1996, respectively. He is cur- rently with the National Institute of Informa- tion and Communications Technology (NICT), Tokyo Japan. His main interest is research on biomedical electromagnetic compatibility.
Dr. Watanabe is a member of the Institute of Electrical Engineers (IEE), Japan, the IEEE, and the Bioelectromagnetics Society. He was the re- cipient of several awards, including the 1996 International Scientific Radio Union (URSI) Young Scientist Award and 1997 Best Paper Award pre- sented by the IEICE.