Corporate Ownership and Performance in Twentieth Century Japan
May 7, 2009
Hideaki Miyajima (Waseda University) Shinya Kawamoto (Waseda University)
Yusuke Omi (Central Research Institute of Electic Power Industry) Nao Saito (Waseda University)
1-6-1 Nishiwaseda, Shinjuku-ku, Tokyo 169-8050, Japan Tel: +81-3-5286-2460 ; Fax: +81-3-5286-2470
Abstract
In this paper, we examined the effect that governance structures have on corporate performance using our newly constructed corporate database for 20th century Japan. We show that the ownership structure was an important determinant of corporate performance during the interwar period. Especially, ownership by large shareholders and managerial ownership had a significant effect in this period. By contrast, in the high-growth era and after the oil crises, ownership structure also influenced corporate performance, but to a much smaller degree than in the prewar period. Ownership structure was not an important determinant of corporate performance when economy grew rapidly. However, corporate performance grew more sensitive to ownership structure in the bubble period (the late 1980s) and after the collapse of the bubble, as the negative effects of stable shareholding and shareholding by banks became apparent. These Japanese experiences suggest that ownership structure influences corporate performance but not necessarily on a consistent basis.
Keywords: ROE, ROA, entrenchment, alignment, large shareholders, managerial ownership, insider ownership
JEL classification: C23, G32, N25
Corresponding author. Shinya Kawamoto, Waseda Institute of Advanced Study Tel.: +81-3-5286-2108
E-mail address: [email protected]
∗ This paper is prepared for a book title by Corporate Performance in the 20th Century (tentative) edited by Youssef Cassis and Andrea Colli, Cambridge University Press. We wish to thank Takuya Kawanish, Toru Imajo and Masato Shimizu for excellent comment and help on this project. Discussion with Julian Franks, Colin Mayer and Yishay Yafeh is extremely helpful. This research is supported by the 21th Centre of Excellence Program of the Ministry of Literature in Japan.
1. Introduction
The Japanese economy that realized high growth in the twentieth century also experienced a variety of dramatic upheavals. Japan industrialized rapidly since the late 19th century, and achieved industrialization of heavy industries during World War I. In turn, Japan suffered from perpetual economic crises from the 1920s to the early 1930s, and then operated under wartime planned economy from 1937. The postwar reforms had a wide-ranging impact on the Japanese economy. From 1955 to 1970, Japan enjoyed an unprecedented long-run economic boom (during the “high growth era”), and the country became an economic powerhouse. The collapse of the “bubble economy” at the end of the 1980s mired the country in a serious slump during the 1990s.
Much has been written about Japan’s economic performance in the twentieth century (Patrick and Rosovsky 1976, Nakamura 1988). However, previous researchers, particularly those dealing with the prewar Japanese economy, have used macro-level data, and when they have turned to micro-level data, they have usually focused on a limited number of firms in specific industries. Furthermore, there are only a few studies that examine both the prewar and postwar Japanese economy from a historical perspective. And no scholar has used time series profitability data, for example.
On the other hand, there is a growing literature on the evolution of the corporate system in 20th century Japan (Aoki and Patrick 1994, Okazaki and Okuno-Fujiwara 1999, Hoshi and Kashyap 2001, Morck and Nakamura 2005, Franks, Mayer and Miyajima 2008). The prewar corporate system was market- oriented, and different from the postwar corporate system, but was transformed under the wartime planned economy and postwar reforms, which established a homogenous structure with insider boards, main banks, and stabilized shareholding. In the 1990s, this unique Japanese type of system underwent further major changes.1 Nontheless considerable research has been conducted on the Japanese corporate system, scholars have still not fully determined whether and how the corporate system influences corporate performance.
The ultimate goal of our research is to illuminate the interrelation between corporate governance and performance. As we take up this challenge, there is, of course, a long list of
1 On current changes of J-type corporate system, see Dore (2000), Inagami and Whittaker (2005) and chapters in Aoki, Jackson and Miyajima (2007).
possible issues that could be addressed, ranging from the effect of competition, the role of debt, bank intervention, and internal governance to boards of directors and compensation schemes.
In this paper, we have chosen to focus on ownership structure and its influence on corporate performance.
There were large literatures concerning on the relationship between ownership structure and corporate performance. Since Berle and Means (1932), who focused on the agency problem caused by the dispersion of ownership, the view that a dispersed ownership structure leads to inferior performance has gained wide support. However, empirical studies do not necessarily support this relationship between ownership structure and performance. For example, Demsetz and Lehn (1985) advocated that a particular ownership structure may have hardly any affect on corporate performance, because the optimal ownership structure is determined through the rational behavior of each economic player. Albeit this skepticism, many subsequent investigations have shed light on the nonlinear relationship between ownership structure and corporate performance. Burkart, Gromb and Panunzi (1997) indicated that increases in ownership by outside shareholders contribute to enhancing corporate performance through monitoring, while extremely strict monitoring by a large shareholder might diminish managerial incentives. Furthermore, Morck, Shliefer and Vishny (1988) presented evidence that managerial ownership could mitigate the conflict between shareholders and managers (alignment effects), and might interdict monitoring from outside of the firm, which would adversely affect performance (entrenchment effects)2. In addition to these topics, the exploitation of minority shareholders by controlling shareholders in family-owned companies or hierarchical organizations has become one of the most spotlighted issues in recent years3.
Analysis of Japanese firms in the 20th century could provide important insights into these questions. As Franks, Mayer and Miyajima (2008) emphasized, the ownership structure of Japanese firms in the prewar period had been quite diverse; privately held companies with concentrated ownership structures such as zaibatsu-affiliated companies coexisted with public
2 See also McConnell and Servaes (1990, 1995) and the excellent survey of this literature by Demsetz and Villalonga (2001).
3 Represented works are Classen, Djankow, Fan and Lang (2000), Johnson, Boone, Breach and Friedmam (2000), Morck, Wolfenzon and Yeung (2005).
companies with dispersed ownership structures. Therefore, prewar Japanese firms with their diversified ownership structures provide a desirable sample for analyzing the relationship between ownership structure and corporate performance. In addition, postwar Japanese firms, which have been characterized by a less concentrated ownership structure and the importance of banks and corporations as shareholders, are a useful sample for estimating the effects of managerial entrenchment and the exploitation of minority shareholders by controlling shareholders.
Furthermore, previous research in this area has employed methods of short-term analysis, and has not investigated how dynamic factors such as the business cycle or long-term economic development have determined the corporate ownership structures that are adopted.
The analysis of this paper aims to shed light on the relationship between ownership structure and corporate performance in large Japanese firms from a historical perspective.
The paper is organized as follows. In Section 2, we briefly describe our original database and illustrate the long-term transition in the performance of large Japanese firms.
Although many researchers have constructed macroeconomic indicators for prewar Japan since Ohkawa and Rosovsky (1973), firm-level indicators have not been established yet. Therefore, this section can be seen as a pioneering effort in this field.
Section 3 provides stylized facts concerning the evolution of the ownership structure of Japanese firms. Much has been written on the ownership structure of Japanese firms in the postwar period (Aoki 1988, Odagiri 1992, Sheard 1994, Hoshi and Kashyap 2001, Miyajima and Kuroki 2007), while the fundamental facts about the ownership structure in the prewar period have not become widely studied4. Based on Franks, Mayer and Miyajima (2008) recent work, and combining with our own data, we present the long-term evolution in the ownership of Japanese firms throughout the 20th century.
Section 4 and 5 provide econometric analysis of the relationship between ownership structure and corporate performance for the prewar and postwar periods respectively. In the literature of Japanese economic history, as for the prewar period, the effects of zaibatsu affiliation have received previous attention5, so our analysis will focus on the different effects
4 Morck and Nakamura (2005) is one of the few studies into this area of inquiry.
5 Frankl (1999) and Okazaki (2001) examine the function of zaibatsu, using firm-level micro data.
of shareholding by managers and large shareholders including holding companies. On the other hand, as for the postwar period, we will clarify that stable shareholders have no positive effects on corporate performance, that shareholding by banks has had different effects over time, and that shareholding by corporations has had a constantly positive effect on corporate performance until the 1990s. All of our results raise questions regarding the findings of previous research into the roles of the various types of shareholders described above6.
Section 6 contains concluding remarks.
2. Corporate Performance in 20th-Century Japan 2.1 Data
Let us begin by providing an overview of the long-term transition of corporate performance in 20th-century Japan. Focusing mainly on profitability as a corporate performance indicator, we adopt ROA (operating profits divided by total assets) as the most comprehensive measure of capital efficiency, but for the prewar period, also employ ROE (after-tax profits divided by equity)7. In addition to these profitability measures, we also employ a growth measure, the growth rate of total assets, because there is a possible trade-off between short-term profitability and long-term corporate growth.
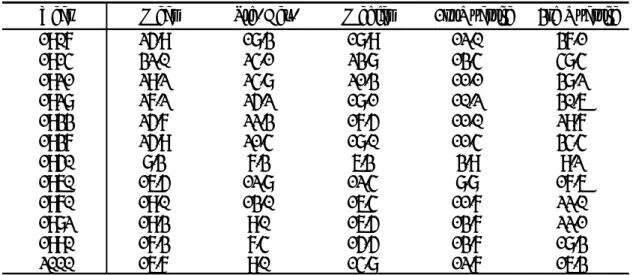
Attempts to illustrate corporate performance over a century create difficulties with sample selection. We treat this problem by using three different datasets, displayed in Table 1.
--- INSERT
Table 1ABOUT HERE ---
The first dataset covers the period from 1914 to 1942, and consists of the 200 largest manufacturing firms (asset-base) for at least one of the following years -- 1918, 1930 and 1937, with all the necessary data items8. This dataset is an unbalanced panel, which encompasses both entries to and exits from the market. We acquired the necessary data from “Kabushiki Gaisha Nenkan” by Toyo Keizai Inc., “Honpo Jigyo Seiseki Bunseki” by the Mitsubishi
6 Porter (1992), Lichtenburg and Pushner (1994) and Yafeh and Yosha (2003) stress its positive effects, while Weinstein and Yafeh (1998), Hanazaki and Horiuchi (2000), Morck, Nakamura and Shivdasani (2000) stress its negative effect.
7 This is because the financial accounting system in Japan was disseminated inadequately in the prewar period and desirable data such as operating profits, ordinary profits, and value added are not available.
8 We constructed the list of the largest firms from Appendix A-1 and A-2 in Fruin (1992) for 1918 and 1930, and “Honpo Jigyo Seiseki Bunseki” for 1937.
Economic Research Institute, and other sources. The number of sample firms reached 67 for 1915, 102 for 1920, 206 for 1930, and 193 for 1940. The financial accounting system in Japan was inadequately disseminated in the prewar period, and financial statements of sample firms did not follow a single format, so we made adjustments in the interests of uniformity as much as we could.
The second dataset covers the 1950s and 1960s, the period just after the postwar reforms, and is used to bridge the prewar and the postwar periods. This dataset is composed of 126 firms that are ranked among the 100 largest firms (asset-base) for either 1937 or 1955, or in both years, with all the necessary data items. The number of the sample firms decreases gradually as they exit from the market. We obtained the necessary data from “Jojo Gaisha Soran” by the Tokyo Stock Exchange.
The third dataset mainly covers the period from 1956, and consists of 353 large manufacturing firms whose sales in 1990 were more than 50 billion yen. This dataset is an unbalanced panel which includes only entries of the sample firms to the market. The data used to construct this dataset was taken from “Corporate Finance Data” by the Development Bank of Japan and “Nikkei Economic Electronic Databank System (NEEDS)” by Nikkei Inc.
2.2 Stylizing Fact on Corporate Performance
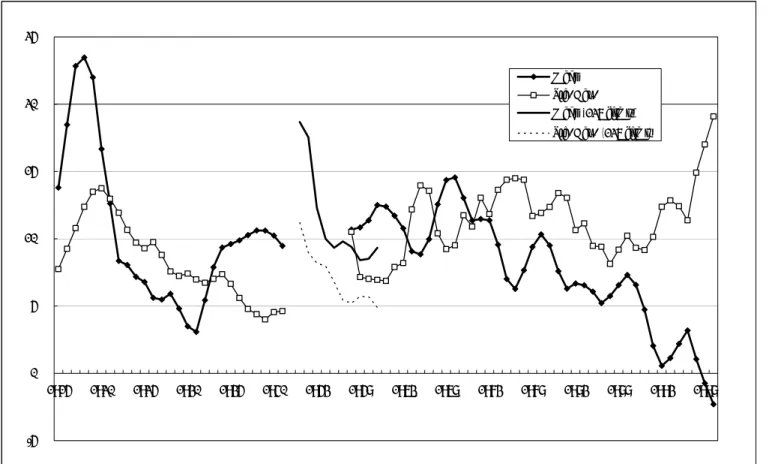
Figure 1 shows the average and standard deviation of ROE calculated using the newly constructed database. Figure 2 provides the ROA for the postwar period, and Figure 3 provides the growth rate of assets from 1916 to 1998. Since ROE and the growth rate of total assets are sometimes extremely volatile, we adopted a three-year moving average of those indexes after eliminating the outliers, which we defined as varying from the average by three standard deviations.
--- INSERT
Figure 1, 2, 3ABOUT HERE ---
From these figures, which are initial attempts to reveal long-term trends in the corporate performance of large Japanese firms with cross-sectional diversity, we can observe the following facts.
(1) After enjoying an unprecedented booming economy from World War I, Japanese firms
experienced dismal performance from 1920 to 1932, when the standard deviation of ROE commonly surpassed the average. The growth rate of total assets also indicates a similar tendency. From the postwar depression in 1920 to the Showa depression (1929-1932), Japanese firms exhibited both low profitability, and immense variance among firms. By contrast, however, since 1933, when the economic recovery was observed, both ROE and the growth rate of total assets rose sharply and their standard deviations contracted simultaneously.
(2) The corporate performance of Japanese firms in the wartime period (1938-1942) is characterized by relatively high rates of profitability with less volatility. Under wartime planned economy, where macroeconomic conditions were marked by excess demand and resource constraints, government suppressed the high profits of the armaments industry while ensuring a certain level of profits for constrained, civilian industries. In the early 1950s, following the postwar reform and return to the market economy, Japanese firms had high but volatile rates of profitability because of unexpected factors such as the need for corporate reconstruction and reorganization9, special procurements during the Korean War, and the subsequent slowdown following the armistice.
(3) In the high-growth era (1955-1970), Japanese firms exhibited both quite high profitability and growth; ROA on average varied from 8 to 13 percent, whereas the growth rate of total assets exhibited from 15 to 20persent. As for ROE, the only indicator that covers both the prewar and postwar periods, the average for the high-growth era exceeds the peak in the prewar period (1934-1936). In addition, one of the most distinctive characteristics for the high-growth era is the extremely small variance in all indicators such as ROA, ROE, and the growth rate of assets. For instance, the coefficient of variation (standard deviation / average) of ROE for this period was 0.83, and that of the growth rate of total assets was 0.70. High economic growth meant high profitability and high growth rates for many Japanese firms.
(4) From 1974 to 1990, the period that follows the 1973 oil shock and includes the
“bubble” economy of the late 1980s, the ROA of sample firms declined continuously through several business cycles. The ROA on average remained at low levels even during the economic boom and “bubble” of the 1980s, and this trend is also true of ROE. We should
9 The abrupt declines of ROE and ROA in the early 1950s can be attributed in part to the revaluation of fixed assets and the capitalization of ensuing revaluation profits, which increased total assets and equity.
For more on this topic, see Miyajima (2004).
observe that disparities in firm performance, especially in the case of ROE, surged just after the first oil shock but have remained at a low level ever since. On the other hand, the growth rate of assets rose to a peak of 12 percent in 1989. In summary, during the “bubble” period, corporate investments reached high levels in spite of low profitability.
(5) In the 1990s after the burst of the “bubble” economy, all performance indicators remained at low levels except during the temporary recovery in 1995 and 1996. The great disparity in corporate performance among sample firms is another feature observed for the period, and widened further from 1997, when the banking crisis occurred. As described above, the corporate performance of Japanese firms in the late 1990s is characterized by extremely low profitability and growing disparity among firms.
3. Evolution of Corporate Ownership in Japan
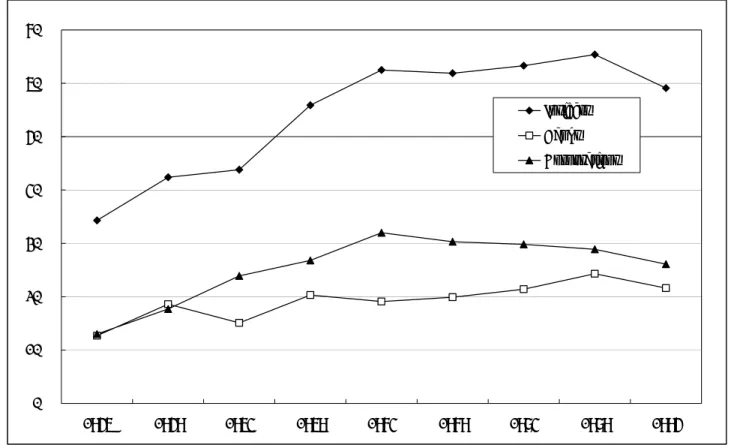
Table 2 shows C3, the percentage of shares held by the three largest shareholders of the sample firms from 1907 to 2000, based on Franks, Mayer and Miyajima (2008). The sample includes firms, which were incorporated before 1920, and had survived until 2000. The numbers of sample firms are 45 with the exception of 38 in 1907. In addition, Figure 4 shows the ownership structure in terms of types of shareholders, based on the postwar sample (see Table 1). We could summarize the evolution of the ownership structure of Japanese firms in the 20th century as follows.
--- INSERT Table 2 & Figure 4 ABOUT HERE ---
Prewar: Coexistence of Different Ownership Structures
The ownership structure in the prewar period was characterized by the following features. First, as Miyajima (2004) pointed out, firms with highly concentrated ownership structures coexisted alongside those with widely dispersed structures. The standard deviation of C3 for 1921 is 25 percent, while the average of the sample is 29 percent. Large Japanese firms in those days had extremely diverse ownership structures. Some private companies were held by founder families or holding companies such as Mitsubishi Shipyards (C3 = 98.9%, 20 shareholders), and Sumitomo Electric Wire (C3 = 97.6%, 21 shareholders) and provided a
contrast to publicly-traded companies with dispersed ownership structures such as Toyo Spinning (C3 = 6.2%, 10,236 shareholders) and Dainihon Sugar (C3 = 3.9%, 8,442 shareholders).
Second, the ownership structure in the interwar period was stable. C3 in 1937 was 25.9 percent, varying little from the data recorded for 1921. Deconcentration of ownership proceeded through public offerings of shares by zaibatsu-affiliated companies mainly in the 1930s, but this had only a limited effect on reducing disparity of ownership structures, which remained quite diverse even in 1937.
Third, however, the ownership structures of large Japanese firms in the prewar era were less concentrated than those of U.K. or Germany in the first half of the 20th century, although privately held zaibatsu-affiliated companies with highly concentrated ownership structures occupied a predominant position in Japan. Franks, Mayer and Rossi (2008) report that the C3
of large corporations in the U.K. in 1920 was 35.9 percent, and 31.0 percent even in 1950.
Franks, Mayer and Wagner (2006) indicate that the C3 of large German companies climbed from 58 percent in 1920 to over 60 percent in the 1950s. Even in the 1990s, according to Becht and Mayer (2001) and La Porta, Lopez-de-Silanes and Shleifer (1999), the proportion of the shares held by the three largest shareholders exceeded 50 percent for large companies on the European continent. Therefore, the ownership structure for at least a portion of prewar Japanese firms was less concentrated than the international standard for that period, or even in recent years.
Wartime Economy and Postwar Reforms: Shift toward a Homogenous Structure
The postwar reforms homogenized the diverse ownership structures of the prewar period (Miyajima 1994, 2004). Under wartime controls, shareholders rights were severely restricted by the restriction on the dividend payout of firms and the suspension of the decision of general shareholder meeting. During the war, however, the ownership structure of Japanese firms was relatively stable because of the controls imposed on bank lending, the stock market, and other parts of the economy. This structure was decisively changed through a series of postwar reforms implemented by GHQ to “Americanize” Japan’s economic system. With the dissolution of the zaibatsu, holding companies, zaibatsu families, or zaibatsu-affiliated
companies were forced to transfer shares they possessed to the Holding Company Liquidation Committee (HCLC), and those shares were sold preferentially to individual shareholders including employees.10 In addition, shareholding by individuals was encouraged as firms increased their capital in conjunction with corporate reconstruction and reorganization initiatives, bringing drastic changes to the ownership structure. Table 2 shows that the average of C3 was 8.3 percent in 1950, and the standard deviation remained at the extremely low level of 7.3 percent. In the case of Mitsui Mining, which had a highly concentrated ownership structure in the prewar period, C3 was 7.2 percent, and there were 37,050 shareholders in 1950.
Thus, the ownership structure became not only fully dispersed but also homogenous under the postwar reforms.
High Growth Era: Presence of Insider Shareholdings
The ownership structure, which was fully-dispersed just after the postwar reforms, gradually grew more concentrated through the 1950s and 1960s, with C3 reaching 19 percent by 1970 and remaining at that level subsequently. On the other hand, the standard deviation of C3 further declined from the 1970s. Nonetheless, the striking feature that we should note is the change in the composition of shareholders rather than on the change in the degree of concentration. Figure 4 shows the proportion of the shares held by banks, corporations, and the total sum of these two components and insurance companies and managers (hereinafter, γ) for postwar sample firms.11 The figure illustrates that the proportion of shares held by stable shareholders rose from 34.3 percent in 1956 to 62.5 percent in 1974 and has remained at that level subsequently. Ironically, in the postwar era, when the minority shareholder protection was strengthened by GHQ initiatives, the majority of shareholders shifted from outside investors (individuals and investment trusts) to shareholders who were favorably disposed toward the incumbent management (banks and corporations)12. The ownership structure of
10 In detail, see Miyajima 1994, Morck and Nakamura (2005), and Franks, Mayer and Miyajima (2008).
11 “Stable shareholders” (γ) in Figure 4 represents the percentage of shares held by banks and corporations, plus shares held by managers, minus the percentage held by trust banks ranked among the top 10 shareholders of each firm, based on information on ownership structure provided in the financial statement of each firm.
12 Franks, Mayer and Miyajima (2008) offered the magnitude of these legal reforms, using La Porta, Lopez-de-Silanes, Shleifer and Vishny (1998).
Japanese firms from the 1970s to the early 1990s, in terms of not only C3 but also the composition of types of shareholders, had been extremely stable as many previous studies point out (Prowse 1992, Flath 1993, Yafeh and Yosha 2003). From the late 1980s, just after the enforcement of the amendment to the Anti-Monopoly Law in 1978, where the limit on the proportion of the shares that could be held by single bank was reduced from 10 percent to 5 percent, the total proportion of shareholdings by banks slightly increased, as shown in Figure 4.
The ownership structure of Japanese firms changed drastically in the 1990s as the proportion of shares held by foreign shareholders gradually began to increase from early in that decade. In addition, ignited by the banking crisis in 1997, the unwinding of cross-shareholdings and the decrease in stable shareholders began, resulting in an increasingly diverse ownership structure for Japanese firms13.
Focus of Analysis
Our fact finding on the corporate performance of Japanese firms described in the previous section and on the ownership structure in this section leads us to the following research agenda:
1) In the prewar period, under the multimodal ownership structure, profitability varied greatly among firms. We seek to explain whether the ownership structure of Japanese firms affected corporate performance.
2) The appearance of high and less diverse rates of profitability in the high-growth era corresponded with the increase in shares held by stable shareholders. We seek to determine whether stable shareholders influenced corporate performance.
3) Under the stable ownership structure that has prevailed since the 1970s, the profitability of Japanese firms trended downward, and there was little variance among firms. We seek to examine whether a relationship between stable shareholders and low profitability exists.
Given this agenda, we attempt to implement econometric estimations of the relationship between ownership structure and corporate performance in section 4 and 5.
13 See Miyajima, Haramura and Enami (2003) for changes in ownership structure in the 1990s, and see Miyajima and Kuroki (2007) for the unwinding of cross-shareholdings.
4. Interwar Period:Effects of Large Shareholders and Managerial Ownership 4.1 Models and Variables
As is well known, the interwar Japanese economy had experienced repeated depressions since the panic in 1920. Japanese firms in the heavy industry sector that had been established during the World War I faced severe competition from foreign rivals by the time of when the switch from the gold standard to the controlled currency system in 1932. Carefully considering on such economic environment of the interwar period, we need to evaluate the effects of ownership structure on corporate performance. To approach this issue, we estimate the following equation:
P(ROE, ⊿A) = F (X1, X2, X3, X4) (1)
where dependent variables is performance, P. We take the rate of return on equity, ROE ,and the growth rate of total assets,ΔA. For X1, the macroeconomic factor, we employ the growth rate of real GDP. X2 represents industry specific factors, which consist of three variables.
First is the growth rate of sales of industry, ⊿S, which controls for demand effects. We use the median of the growth rate of sample firms calculated separately for 12 industries for estimating the ⊿S. Second, we use the percentage change of the price level of the industry,
⊿P.14 This could be expected to capture the competitiveness of the environment faced by each industry. Third, we employ industry dummy variables, with which we examine the industry-specific effects which could not be attributed to changes in demand or price. X3, is the variable related to the firm characteristics. The firm size which is measured by logarithm of asset , SIZE, is employed to control for the effects of economies of scale. We also introduce the debt assets ratio (DA) into the estimation for controlling for the effects of the capital structure on corporate performance.15 Last variable X4 is variables representing the corporate governance structure. In addition to the ownership structure, we introduce the dummy variable OLD, which is equal to 1 if the firm is zaibatsu (Mitsui, Mitsubishi and Sumitomo)
14 We obtained the necessary data from Ohkawa, Kazushi. et al. eds. Estimates of Long-term Economic Statistics of Japan since 1868: 8, Toyo Keizai Shinposha, 1967.
15 The debt-asset ratio might have an endogeneity problem with performance variables, so we also estimate the equation without DA, and obtain similar results. Therefore we report our results without DA below.
affiliated, to control for the effects of the internal capital markets of the major corporate groups16.
4.2 Basic Estimation
Table 3 shows the results of the basic estimation, that is, equation (1) without X4. The corporate performance of interwar Japanese firms was strongly influenced by industry-specific factors reflected in demand or price, as well as macroeconomic factors such as the growth rate of real GDP or the year dummy. For instance, as the growth rate of sales of the industry increases by one standard deviation (12.0 percent), ROE rises by 1.7 percentage points, which accounts for about 24 percent of the average ROE (7.1 percent). The effects of other variables such as the price level or industry specific factors also had a considerable effect on corporate performance.
--- INSERT
Table 3ABOUT HERE ---
In addition, corporate performance in the interwar period exhibits a negative correlation with the debt asset ratio, and a positive correlation with firm size. The effect of firm size is noteworthy especially for the 1920s (column 2), suggesting that the economies of scale has significantly worked well. Previous studies noted “the dualistic structure,” that is the co-existence of the high-productivity large-scale corporate sector and the low-productivity small business sector (Nakamura and Odaka 1988). The performance difference by size was also demonstrated even in the large-scale corporate sector.
4.3 Effects of Ownership Structure: Double-sided Effect
Table 4 shows the estimation results including ownership structure variables. α denotes the proportion of shares held by the largest shareholder excluding managerial ownership.17 In other words, α is the proportion of shares held by the largest outside shareholder (individual, holding company, or other company). In addition, we introduce the square of α (α2) to capture the nonlinear relationship between large shareholders and firm performance pointed
16 On the role of zaibatsu in prewar period, see Morikawa (1992), and Morck and Nakamura (2005).
17 When the manager is the largest shareholder, we adopt the second-largest shareholder as the variableα.
out by Burkart, Gromb and Panunzi (1997), that occurs when excessive monitoring causes a decrease in performance due to a decrease in managerial discretion. α's average for the estimation period is 21.3 percent and its standard deviation is 24.3 percent. In confirming the largest shareholder for 65 sample firms in 1921, we found that an individual was the largest shareholder for 33 firms, and out of which, 11 cases was a wealthy individual, and 15 cases was the asset management company of an individual (or manager). The rest of 32 firms was the case that the legal entity such as holding company (ex. Mitsui, Mitsubishi, Sumitomo Limited partnership) and other corporation (Hitachi is held by Kuhara Mining) was the largest shareholder. The latter case increased through financial panic in 1927 and Showa Panic (1929-31), and as a result, firms with other corporation as the largest shareholder were 42 cases out of 67 in 1937. Out of which, the case that holding company is the largest shareholder is 15 case, other corporation is 18 case, and other financial institution are 9 cases. The case that bank occupied the largest shareholder was quite limited, just five cases.
ω denotes the proportion of the shares held by the manager (CEO). As mentioned
previously, entrepreneurial firms accounted for a large proportion of major firms in prewar Japan. Shitagau Noguchi of Japan Nitrogen Fertilizer Company and Kojiro Matsukata of Kawasaki Shipyard Company are typical examples of entrepreneurs who were also the largest shareholders of their firms18. Further there were ineligible cases that professional managers were able to purchase their firm’s shares by using their large bonuses. Sanji Muto of Kanegafuchi Spinning Company is a typical example of a professional manager who became the largest shareholder of his firm19.
As pointed out by Morck, Shleifer and Vishny (1988) and McConnell and Servaes (1990), managerial ownership has two conflicting effects on firm performance. While the alignment effect mitigates conflicts of interest between managers and shareholders, the entrenchment effect shields management from meddling by outsiders. To capture these conflicting effects, we introduce ω2 (the square of ω) to the estimation model as well as α.
--- INSERT Table 4 ABOUT HERE
18 The proportions of shares held by Noguchi and Matsukata were 18.9 and 16.5 percent respectively in 1921.
19 The proportion of shares held by Muto was 1.5 percent in 1921.
---
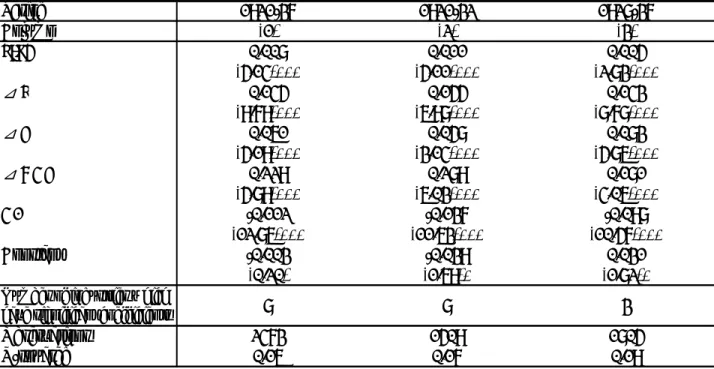
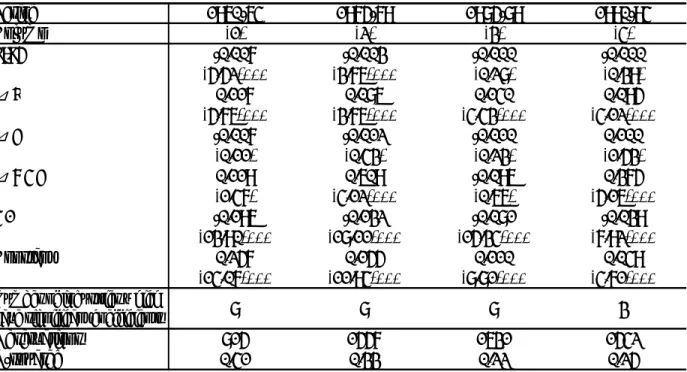
Table 4 summarizes the estimation results of a regression that assesses ROE by corporate governance variables. First, the coefficient of OLD for the large corporate groups with internal capital markets was not significant for almost all estimations with ROE and the asset growth rate(⊿A) as dependent variables.20 As for the mining and manufacturing industries that are the focus of analysis of this paper, we could not obtain results that indicate that zaibatsu affiliation contributes to firm performance, though caution should be exercised in interpreting the results because the estimation results may have been influenced by definitions of the zaibatsu.
Second, the coefficient of α is significantly positive in the 1921-37 period (column 1).
After controlling for industry-specific factors and firm size, a high α still contributes to ROE through improvement in managerial effort via monitoring by outside shareholders. Moreover, in the model introducing the square of α, α2 is significantly negative at the 1 percent level (column 3). This result indicates that there is a nonlinear relationship between ROE and shareholding by large outside shareholders. The estimated threshold is approximately 62 percent.21 The ownership of the largest outside shareholder has a positive effect on ROE until α attains the threshold. Beyond this threshold, the increasing shareholding of the largest
shareholder associated with the declining ROE. It is important to note a rationale concerning why the effect of large outside shareholders turns negative beyond the threshold (62 percent).
The threshold exists because there is a combined effect of two factors: (a) a monitoring effect under very large outside shareholders; and (b) an initiative-lowering effect on managers beholden to very large outside shareholders.
Third, large outside shareholders were composed of not only individual shareholders but also holding companies, nonfinancial companies, and the institutional investors22 (life
20 This result is consistent with Kahnna and Yafeh (2007), Frankl (1999) and inconsistent with Okazaki (2001), which concludes that zaibatsu affiliation contributes to firm performance. Okazaki’s sample includes non-manufacturing industries, and it defines zaibatsu as those firms which appear on the list of the ten largest zaibatsu compiled by GHQ. These differences in samples and definition of zaibatsu might explain the estimation differences between our results and Okazaki (2001).
21 The number of firms with α higher than the threshold was 11 (6.8 percent of the total) in 1928.
22 During the prewar period, cases in which banks exerted influence on corporate management as a large shareholder are limited to those in which banks became large shareholders temporarily through debt-equity swaps to rescue financially distressed firms. Kawasaki Shipbuilding Co., Kobe Steel, Ltd and Teikoku Synthetic Fiber are typical examples.
insurance companies). Corporate shareholders such as holding companies and parent companies usually have significant monitoring capabilities and hence are effective in mitigating agency problems (Shleifer and Vishny 1986). To test this relationship, we divide α into Corp-α to denote that the largest outside shareholder is a corporation and Ind-α to denote that the largest outside shareholder is an individual, and then we estimate the model including both variables. We found that the coefficient of Ind-α is not significant while the coefficient of Corp-α is significantly positive (column 5). This result indicates that outside corporations, but not outside individuals, played an important role in corporate monitoring during the prewar period when they were the largest shareholder.
Fourth, as for the effect of managerial ownership, the proportion of the shares held by managers (ω) is significantly positive and the square of ω (ω2) is significantly negative (column 3). Similar to the empirical results of Morck, Shleifer and Vishny(1988) and McConnell and Servaes(1990)23, our results also indicate that there is a nonlinear relationship between managerial ownership and firm performance during the prewar period. Here, the estimated threshold of ω is approximately 31 percent24. In other words, the curve, describing the relationship between ω and firm performance increases until managerial ownership reaches the threshold (31 percent), and then decreases after exceeding the threshold. This means that the alignment effect to mitigate the conflicts of interest between managers and shareholders is dominant at the left of threshold, though the entrenchment effect that causes performance to deteriorate is dominant to the right of threshold.
Fifth, these nonlinear effects with respect to α and ω are similarly confirmed even if the dependent variable is changed from ROE to asset growth rates (columns 4 and 6). These results are consistent with the understanding that monitoring by large outside shareholders disciplined managers and encouraged appropriate levels of investment and especially with the view that managerial ownership promoted aggressive investment behavior by managers.
Last, if we divide the estimation period into a recession sub-period (1921-32) and economic recovery sub-period (1928-1937), the effects of α and ω are clearly confirmed in the economic recovery phase (column 7-10). As for ω and ω2, while their coefficients are not
23 They use Tobin’s q as a proxy for corporate performance.
24 The number of the firms with ω values higher than the threshold was 10 (6.2 percent of the total) in 1928.
significant in both ROE and ⊿A estimations during the 1921-1932 sub-period, they are significant in both estimations at the 1 percent level respectively during the 1928-1937 sub-period. This indicates that corporate performance became more sensitive to ω during the economic recovery sub-period. Hence, managerial ownership plays a significant role especially when business opportunities expand. This result systematically supports the well known anecdotal story that the entrepreneurs at high-tech industries such as Ayukawa (Nissan), Mori (chemicals aluminum), and Noguchi (fertilizers and synthetic fiber) took aggressive investment policy and showed high performance.25
5. The Latter Half of the Twentieth Century: Effects of Insider Ownership 5.1. Selection of Estimation Periods
As mentioned previously, the issues that we have to address with respect to the latter half of the twentieth century are as follows.
(1) During the high-growth era, Japanese firms were highly profitable with less variability in profitability among firms, and there was an increase in stable shareholders. We focus on whether stable shareholders influenced corporate performance.
(2) Under the stable ownership structure since the 1970s, the profitability of Japanese firms continuously declined, narrowing the variability among firms. We seek to examine whether there is relationship between stable shareholders and low profitability.
To address these issues, we employ an estimation model similar to the one used in the previous section. Here, as seen in section 3, a large-scale shift in the ownership structure from individuals to financial institutions and nonfinancial corporations occurred in the high-growth era. Therefore, the estimation that aims to address the issue raised in (1) above confronts a serious endogeneity problem. To handle this problem, for the high growth era, we focus on the first half of the 1960s (1960-64) when ownership structures were relatively stable. As shown in Figure 4, the proportion of shares held by stable shareholders barely changed from 1959 (43.8 percent) to 1964 (42.4 percent). We examine whether the ownership structure of 1959 influenced the corporate performance during the five years that followed (1960-1964). This period includes two booms -- the “Iwato boom” and the “Olympic
25 See Udagawa (1984), and Morck and Nakamura (2005).
boom”, and in addition, Japan lifted trade controls in 1960 and gradually shifted to an open economy. On the other hand, as for the stable growth era after oil crises, the endogeneity problem is relatively small because ownership structures are stable. Consequently, we focus on the period after the first oil shock (1975-1979), the bubble economy period (1985-1989) and the period after the collapse of the bubble economy (1990-1994). Thus, we regress the performance for the five years in each period on the ownership structure existing in 1959, 1974, 1984, and 1989 respectively.
5.2. Basic Estimation
First, we examine the estimation results of the model which excludes variables for the ownership structure. As the dependent variable, we employ ROA that is the most comprehensive index for measuring capital efficiency. In this section, we use postwar samples (see Table 1). Table 5 shows the estimation results.
--- INSERT
Table 5ABOUT HERE ---
First, the performance of Japanese firms is not sensitive to ⊿P (relative prices) until the end of the 1980s. Even when prices rise sharply after the oil crises, the sign of ⊿P is negative. This trend is similar to that of the high-growth era and the bubble-economy period, and to the period following the collapse of the bubble economy, and though the sign of ⊿P turns positive, the coefficient of ⊿P is still insignificant. Unlike the results for the prewar period, prices were not a key determinant of corporate performance in the postwar period. In contrast, the coefficient of ⊿S (sales growth rate by industry) is positive at the 1 percent significance level in each period and its numerical value is also large. For instance, in the high-growth era, as ⊿S increases by one standard deviation (8.5 percent), ROA rises by 1 percentage point. Its magnitude is equivalent to 10 percent or more of average ROA (9.4 percent) at the time. After the oil crises, though the magnitude of ⊿S ‘s influence on corporate performance decreases by 0.6 percent, its relative magnitude is comparable when considered in light of average ROA (6.6 percent). In addition, its magnitudes in the bubble economy period and after the collapse of the bubble economy are 0.8 and 0.5 percent
respectively, which correspond to 10 to 15 percent of ROA in each period. Corporate performance is sensitive to fluctuations in demand, although not to the extent that it was in the prewar period.
On the other hand, eight industry dummy variables out of eleven are significant at the 10 percent level after the oil crises. This result is consistent with the commonly accepted understanding that the oil crises had a negative effect on labor-intensive industries and oil-consuming industries due to steep rises in material prices and unit labor costs. Moreover, since the coefficients of eight industry dummy variables are significant in both the high-growth era and bubble period, we can conclude that the performance of Japanese firms was influenced greatly by the characteristics of industries to which they belonged until the bubble period.
Meanwhile, after the bubble period, only three industry dummy variables were significant, and thereby factors other than industry-specific effects rose in importance as key determinants of corporate performance.
In sum, corporate performance is not determined not the relative price, but determined by the demand and technological factors that is unique to industry.
Looking at firm specific factors, the debt asset ratio was significantly negative. More interestingly, firm size is a significantly negative factor until the oil crises period, an indication that small firms achieved a higher level of performance than large firms, a contrast to the trend in the prewar period. However, since the Japanese economy reached maturity in the 1980s, the coefficient of firm size turned insignificant, though the sign of the coefficient became negative; in short, the relationship between firm size and corporate performance disappeared.
5.3. Effects of Ownership Structure: From Neutrality to Entrenchment
As mentioned above, Japanese firms had experienced a compulsory redistribution of ownership due to the postwar reforms, so in the postwar ownership structure banks with close ties to the client firm, financial institutions, and nonfinancial companies had emerged as major shareholders, while the concentration ratio of ownership was remarkably low. In the following analysis, as variables related to the ownership structure (X4 in formulation (1)), we focus on shares held by insiders (hereinafter, γ) that includes banks, insurance companies, nonfinancial companies, and managers; shares held by banks (hereinafter, BSH); and shares held by the main
bank (hereinafter, MBSH). The dummy variable becomes one if the shares held by nonfinancial companies exceeds 15 percent26 (hereinafter, PARENT). γ denotes shares held by shareholders who have a friendly relationship with incumbent managers. Therefore, we can assume that γ denotes the stable shareholder ownership ratio. As for the trends of γ and BSH, they are summarized in Table 6. As for the other variables, MBSH was 2.9 percent in 1959, 5.1 percent in 1974, 4.4 percent in 1984, and 4.0 percent in 1989. In addition, as for the dummy variable PARENT, which was given one if other non-financial company held over 15 percent of their shares, the number of firms that is eligible to this criteria is 10 percent among sample firms in 1959, and 25 percent in 1974.
Two conflicting views have been put forth to explain the effects of the unique features of the ownership structure of Japanese firms. One view is that shareholding by stable shareholders, banks, and nonfinancial companies has a positive effect on corporate performance.
For instance, the literature on Japanese corporate governance often argues that stable shareholding enables management to adopt a long-term perspective or at least contributes to high growth by mitigating the threat of hostile takeovers and myopic pressure from shareholders exerted through such means as claims for dividends (Abegglen and Stalk 1985, Porter 1992, 1994, and Odagiri 1992). In addition, shareholding by banks has a disciplinary effect on corporate management by facilitating monitoring of the borrower and reducing increases in asset substitution (Prowse 1992 and Aoki and Patrick 1994). Moreover, shareholding by nonfinancial companies provides an incentive to monitor affiliated companies, which raises management efficiency (Sheard 1994). In sum, it has been understood that main banks and nonfinancial companies play a role as delegated monitors for minority shareholders.
However, shareholding by stable shareholder, banks, and nonfinancial companies may potentially have a negative effect on corporate performance. For instance, a high ratio of stable shareholding enabled managers to seek private benefits by securing excessive autonomy, with negative effects on corporate performance (Morck et al. 2005). In addition, as for shareholding by banks, researchers have focused attention on the negative aspects in recent years.
Weinstein and Yafeh (1998) indicate that the bank imposes a high capital cost on the borrower by
26 The setting of this threshold is the same as in Miyajima and Kuroki (2007).
utilizing its dominant bargaining position27. Morck, Nakamura and Shivdasani (2000) suggest that the bank’s role in corporate governance doesn't necessarily lead to corporate value maximization because the bank’s role as shareholder does not correspond to its role as creditor. Furthermore, as for shareholding by nonfinancial companies, recent studies focus on the potential deprivation of minority shareholders by the predominant shareholder (parent company), and this suggests that corporate performance is low when nonfinancial shareholders own a large percentage of shares (Classen, Djankow, Fan and Lang. 2001, Morck, Wofenzon and Yeung 2005).
In the estimation, to control for the effects of affiliation to a corporate group, we introduce the corporate group dummy variable KEIRETSU that takes the value of one if the sample firm belongs to the presidents’ clubs (Shacho-kai) of the six corporate groups (Mitsui, Mitsubishi, Sumitomo, Fuyo, Sanwa and Daiichi-Kangin)28. The ratios of the firms belonging to the corporate groups in the sample are 8.6 percent in 1959, 18.3 percent in 1974, and 23.2 percent in 1984.29
Estimation Results
The estimation results introducing ownership structure variables are summarized in Table 6.
Though we estimated the model that changed the dependent variable into ROE and the growth rate of total assets, we avoid fully reporting the results in the interests of brevity. The following results were obtained.
--- INSERT
Table 6ABOUT HERE ---
(1) In the high-growth era (1960-1964), the coefficient of γ is not significant but negative (column 1). This insignificant result is similar even if the dependent variable is changed to the asset growth rate, and we can not obtain significant effects on corporate performance. The affiliation to a corporate group also does not have a significant effect on
27 The banks have an incentive to lend excessively to borrower and to influence borrowers to select overly conservative investment projects.
28 The presidents’ clubs (Shacho-kai) are composed of the presidents of the core companies of each corporate group.
29 The presidents’ clubs (Shacho-kai) exist only for the Mitsui, Mitsubishi and Sumitomo groups in 1960. It was the early 1970s that six bank centered corporate groups organized their president clubs.
both ROE and the asset growth rate (column 2). On the other hand, the coefficient of BSH (the ownership ratio held by the bank) is significantly negative at the 1 percent level, though the coefficient of MBSH (the ownership ratio held by the main bank) is not significant but negative (column 3). Except for ownership by a nonfinancial company, the ownership structure doesn’t have a positive effect on corporate performance in the first half of the high-growth era30. We could not find evidence that the insider ownership that appeared in this period contributed to high performance and high growth, this result is basically same as Weinstein and Yafeh (1998), who stressed that corporate group have not shown any positive effect on performance and firm’s growth rate.
(2) The coefficient of γ is not significant but positive after the oil crises. The coefficient of KEIRETSU is also not significant (column 4). However, the coefficient of BSH is significantly positive (column 5) and the coefficient of MBSH is also positive though the significance level is slightly low (column 6). Since an increase by one standard deviation of BSH boosts ROA by 0.3 percentage points, its economic magnitude is not small. This result indicates that the contingent governance mechanism that was developed by banks to exert managerial discipline on borrower firms becomes functional after the oil crises. The positive role of main bank suggested by Aoki and Patrick (1994) and Sheard (1994) was typically the case in this phase.
(3) In the bubble period, the coefficient of γ is not significant (column 7). However, the coefficient of KEIRETSU is significantly negative in all models (column 7-9). This result is similar even if the dependent variable is changed to the asset growth rate (not reported). In contrast, it is notable that the coefficient of BSH turned negative in the bubble period (column 8). An increase of one standard deviation of BSH decreases ROA by 0.5 percent (approximately 10 percent of average ROA in the bubble period). The coefficient of MBSH is also negative (column 9). We found that the function of shareholding by banks during the bubble period underwent a change, and its negative effects were enhanced.31
(4) The above-mentioned feature becomes clearer after the collapse of the bubble
30 The significantly negative coefficients of BSH and MBSH may reflect the fact that the bank increased shareholding in firms that faced declines in performance (Franks, Mayer and Miyajima 2008). An examination of this inverse relationship is part of our future research agenda.
31 Miyajima, Arikawa and Saito (2001) report that firms with strong main bank ties is likely to overly invest during the late 1980s, estimating standard investment function with cash flow.
economy. The coefficient of γ is significantly negative in the estimation after the collapse of the bubble economy (column 10). Its economic magnitude is 0.2 percent as measured by an increase of one standard deviation. In addition, the sign of NBSH is negative though its significance level is not sufficiently high. Moreover, the coefficient of KEIRETSU is also significantly negative and its magnitude is 0.6 percent (columns 10-12)32. This result indicates that stable shareholding promoted managerial entrenchment and the cost of stable shareholding became evident from the early 1990s.33
In sum, it could be the bubble and after bubble phases that the dark side of bank ownership emphasized by Morck and Nakamura (1999) and others was the case.
(5) Although the function of stable shareholding and shareholding by banks has changed through the four stages of the 20th century, shareholding by nonfinancial companies has had a consistently positive effect on corporate performance. For instance, the ROA of firms with large nonfinancial corporate shareholders is 1.7-2.0 percent higher in the high-growth era and 0.5-0.6 percent higher in the bubble period than the ROA of firms without large nonfinancial corporate shareholders. This result is consistent with Yafeh and Yosha (2003), which focused on advertisement and entertainment expenditures. This indicates that the deprivation of minority shareholders, which many researchers have given attention to, is not a serious problem in Japan at least until the first half of the 1990s. In fact, we can assert that a pyramid-type organization in which the corporate shareholder (parent company) served as the largest shareholder contributed to the improved performance of affiliated companies under its umbrella34.
6. Conclusions
In this paper, we examined the effect that governance structures have on corporate performance using our newly constructed corporate database for 20th century Japan. The conclusion and implications obtained from the analysis in this paper are summarized as
32 When the explanatory variable is changed to the asset growth rate, the asset growth rate is not sensitive to both MBSH and the KEIRETSU dummy.
33 Miyajima and Kuroki (2007) found a significantly negative relationship betweenγ and corporate performance in the latter half of the 1990s.
34 This effect may indicate not only a monitoring effect of large shareholders but also the effect of a long-term transactional relationship between parent company and subsidiaries.
follows.
The salient feature of the ownership structure of Japanese firms in the prewar period was that highly concentrated firms coexisted alongside widely held firms. Under such a structure, large shareholders comprised of individuals, holding companies, and corporate had a significant effect on both ROE and the total asset growth rate. In addition, as for ownership by large shareholders, there is a nonlinear relationship between large shareholders and corporate performance. The increase in ownership by large shareholders contributed to the improvement of corporate performance up to a certain threshold, and then decreased corporate performance after the threshold was exceeded. On the other hand, we found a nonlinear relationship between managerial ownership and firm performance. This result indicates that managerial ownership had two conflicting effects, namely the alignment effect that mitigated conflicts between shareholders and managers, and the entrenchment effect that shielded management from interference by outsiders.
Japanese firms in the latter half of the 20th century can be characterized as having a dispersed ownership structure that promoted cooperation between incumbent managers, and the banks, insurance companies, and nonfinancial corporations that had long-term business relations with the firm. In this ownership structure, stable shareholding did not have a positive effect on corporate performance for most of the postwar period, and it has had a negative effect on corporate performance after the bubble period. In other words, stable shareholding had a neutral effect on corporate performance during the growth stage, and enabled managers to deviate from value maximization behavior from the 1980s as the Japanese economy entered into mature stage.35
By contrast, shareholding by banks had dual effects in accordance with the stage of growth of the overall economy. In the period after the oil crises, as the number of firms that faced financial difficulties increased, shareholding by banks disciplined corporate management
35 This result is consistent to the comparison of the results of fixed effects with pooled OLS estimation in Table 5. The R-squared of the fixed effects estimation falls below the R-squared of the pooled OLS estimations by the Oil crisis period. However, since the bubble period, the R-squared of the fixed effects estimation exceeds that of the pooled OLS estimation. If a firm’s fixed effect contains an ownership structure effect that doesn’t fluctuate widely in the short term, we would expect that ownership structure has less impact on corporate performance in the high-growth era and a significant impact on it from the bubble period.
and contributed to an increase in corporate performance. However, shareholding by banks has had an increasingly negative effect from the 1980s. The period in which shareholding by banks had a positive effect was limited to a short window of time after the oil crises.
Shareholding by nonfinancial companies had a positive effect on corporate performance consistently throughout the postwar period. Although this positive effect cannot be attributed solely to the monitoring role performed by the largest shareholders, the existence of nonfinancial companies as large shareholders has been a feature of companies listed on the stock market in postwar Japan. Analyzing the causes behind this phenomenon is one of our future research aims.
These Japanese experiences suggest that ownership structure influences corporate performance but not necessarily on a consistent basis. Under the open economy of the prewar period, corporate performance was sensitive not only to demand factors but also to price factors, and was also influenced by ownership structure. During the interwar period, and especially during the period of the Showa depression and subsequent economic recovery, the ownership structure was an important determinant of corporate performance. By contrast, in the high-growth era and after the oil crises when corporate performance was sensitive to demand fluctuation and industry characteristics ownership structure also influenced corporate performance, but to a much smaller degree than in the prewar period. Ownership structure was not an important determinant of corporate performance over time. In postwar period, even when a positive effect appeared, it was limited to the recession period (following the oil crisis).
On the other hand, corporate performance grew more sensitive to ownership structure, in the bubble period and after the collapse of the bubble, as the negative effects of stable shareholding and shareholding by banks became apparent. In other words, the experience of Japanese firms through the 20th century suggests that a certain ownership structure does not necessarily have a positive effect on corporate performance, and the function of ownership structure is dependent on the economic cycle and growth stage of the economy.
References
Abegglen, J. C. and G. Stalk Jr. (1985), Kaisha :The Japanese Corporation, Charles E. Tuttle.
Aoki, M. (1988), Information, Incentives, and Bargaining in the Japanese Economy, Cambridge University Press.
Aoki, M. and H. Patrick (eds.) (1994), The Japanese Main-bank System: Its Relevancy for Developing and Transforming Economies, Oxford University Press.
Aoki, M., G. Jackson and H. Miyajima (2007), Corporate Governance in Japan: Institutional Change and Organizational Diversity, Oxford University Press.
Berle, A. and G. Means (1932) , The Modern Corporation and Private Property, Macmillan.
Becht, H. and C. Mayer (2001), Introduction, in F. Barca and Becht. M., eds, The Control of Corporate Europe. Oxford University Press.
Burkart, M., D. Gromb and F. Panunzi (1997) “Large Shareholders, Monitoring and the Value of the Firm,” Quarterly Journal of Economics, Vol. 112, pp.693-728.
Classens, S., S. Djankow, J. Fan and L. Lang (2000) “The Relational for Groups: Evidence from East Asia,” Journal of Finance, Vol. 57, pp. 2741-2771.
Demsetz.H. and K. Lehn (1985) “The Structure of Corporate Ownership: Causes and Consequences,” Journal of Political Economy, Vol.93, pp.1155-1177.
Demsetz.H. and B. Villalonga (2001) “Ownership Structure and Corporate Performance,” Journal of Corporate Finance, Vol.7, pp.249-257..
Dore, R. (2000), Stock Market Capitalism: Welware Capitalism: Japan and Germany versus the Anglo-Saxons. Oxford: Oxford University Press.
Flath, D. (1993) “Shareholding in the Keiretsu, Japan’s Financial Groups,” The Review of Economics and Statistics, Vol.75, pp.249-257.
Franks, J., C. Mayer and S. Rossi (2008) “Ownership: Evolution and Regulation,” Review of Finance Studies, forthcoming.
Franks, J., C. Mayer and H. Wagner (2005) “The Origins of the German Corporation: Finance, Ownership and Control,” Review of Finance, Vol.10, pp.537-585.
Franks, J, C. Mayer and H. Miyajima (2008) “Equity Markets and Institutions: The Case of Japan,”
mimeo. LBS and Oxford.
Frankl, J. (1999) “An Analysis of Japanese Corporate Structure, 1915-1937,” Journal of Economic History, Vol.59, pp.997-1015.
Fruin, W. M. (1992) The Japanese Enterprise System: Competitive Strategies And Cooperative Structures, Oxford: Clarendon Press.
Hanazaki, M. and A. Horiuchi (2000) “Is Japan’s Financial System Efficient?” Oxford Review of Economic Policy, Vol.16, pp.61-73.
Hoshi,T. and A. Kashyap (2001) Corporate Financing and Governance in Japan, Cambridge MA:
MIT Press.
Inagami, T. and D.H. Whittaker (2005), The New Community Firm. Employment, Employment, and Management Reform in Japan, Cambridge UK: Cambridge University Press.
Johnson, S., P. Boone, A. Breach and E. Friedman (2000), “Corporate Governance in the Asian Financial Crisis,” Journal of Financial Economics, Vol.58, pp.141-186.
Khanna, T. and Y. Yafeh (2007), “Business Groups in Emerging Markets: Paragons or Parasites,”
Journal of Economic Literature, Vol. XLV, pp. 331-372.
La Porta, R., F. Lopez-de-Silanes, A. Shleifer and R. Vishny (1998), “Law and Finance,” Journal of Political Economy, Vol. 106, pp. 1113-1155.
La Porta, R., F. Lopez-de-Silanes and A. Shleifer (1999), “Corporate Ownership around the World,”
Journal of Finance, Vol.54, pp.471-517.
Lichtenberg, F. R. and G. M. Pushner (1994) “Ownership Structure and Corporate Performance in Japan,” Japan and World Economy, Vol.6, pp.239-261.
McConnell, J. J. and H. Servaes. (1990) “ Additional Evidence on Equity Ownership and Corporate Value,” Journal of Financial Economics, Vol.27, pp.559-612.
McConnell, J. J. and H. Servaes (1995) “Equity Ownership and the Two Faces of Debt,” Journal of Financial Economics, Vol.39, pp.131-157.
Miyajima, H. (1994), “The Transformation of Zaibatsu to Postwar Corporate Groups: From Hierarchical Integrated Group to Horizontally Integrated Group,” Journal of the Japanese and International Economies, Vol.8, pp.293-328.
Miyajima, H. (2004), Economic History of Industrial Policy and Corporate Governance, Tokyo:
Yuhikaku. (in Japanese)
Miyajima, H., Y. Arikawa and N. Saito (2001), “J-type Corporate Governance and Excess Iivestment,” Financial Review, No.60, pp.139-168. (in Japanese)
Miyajima, H., Haramura, K. and Y. Enami (2003), “Ownership Structure of Postwar Japanese Firms:
The Emergence and Dissolution of Stabilized Shareholders,” Financial Review, No.60, pp.203-236. (in Japanese)
Miyajima, H. and F. Kuroki,(2007), “The Unwinding of Cross-Shareholding in Japan: Causes, Effects, and Implications”, in M. Aoki, G. Jackson and H. Miyajima eds., Corporate Governance in Japan: Institutional Change and Organizational Diversit, Oxford: Oxford University Press.
Morck, R. and M. Nakamura (1999) , “Banks and Corporate Control in Japan” Journal of Finance, Vol. 54, pp. 319-339.
Morck, R. and M. Nakamura (2005) “A Frog in a Well Knows Nothing of the Ocean: A History of Corporate Ownership in Japan,” in R. Morck (ed.), A History of Corporate Governance around the World, Chicago University Press.
Morck, R., M. Nakamura and A. Shivdasani (2000) ”Banks, Ownership Structure, and Firm Value in Japan,” The Journal of Business, Vol.73, pp.539-567.
Morck, R., A. Shleifer and R. Vishny (1988) “Management ownership and market valuation: An empirical analysis,” Journal of Financial Economics, Vol.20, pp. 293-315.
Morck, R, Wolfenzon, D. and B. Yeung, (2005) Corporate Governance, Economic Entrenchment and Growth, Journal of Economics Literature, Vol. 43, pp. 657-722.
Morikawa, H. (1992), Zaibatsu: The Rise and Fall of Family Enterprise Groups in Japan, Tokyo, University of Tokyo Press.
Nakamura, T. (1988) The Postwar Japanese Economy: Its Development and Structure, Tokyo:
University of Tokyo Press.
Nakamura, T. and K. Odaka eds. (1988), Niju Kozo (Dual Structure), Iwanami Shoten.(in Japanese) Odagiri, H. (1992), Growth through Competition, Competition through Growth: Strategic
Management and the Economy in Japan, Oxford University Press.
Ohkawa, K. and H. Rosovsky (1973), Japanese Economic Growth: Trend Acceleration in the Twentieth Century, Stanford University Press.
Okazaki, T. (2001), “The Role of Holding Companies in Pre-war Japanese Economic Development: Rethinking Zaibatsu in Perspectives of Corporate Governance,” Social Science Japan Journal, Vol.4, No.2, pp.243-268.
Okazaki, T. and M. Okuno-Fujiwara (1999), The Japanese Economic System and Its Historical Origins. New York: Oxford University Press.
Patrick, H. and H. Rosovsky (1976) Asia’s New Giant: How the Japanese Economy Works, Washington: Brookings Institution.
Porter, M. E. (1992) “Capital Disadvantage: America’s Failing Capital Investment System,”
Harvard Business Review, Vol.70, pp.65-82.
Porter, M. E. (1994) Capital Choices, Harvard University Press.
Prowse, S. (1992) “The Structure of Corporate Ownership in Japan,” Journal of Finance. Vol.47, pp.1121-1140.
Sheard, P. (1994) “Interlocking Shareholdings and Corporate Governance in Japan,” in M. Aoki and R. Dore (eds.), The Japanese Firm: Sources of Competitive Strength, Oxford University Press, pp.314-349.
Shleifer, A. and R. Vishny (1986) “Large Shareholders and Corporate Control,” Journal of Political Economy, Vol.94, pp.461-488.
Udagawa, M. (1984). New Zaibatsu [Shinko zaibatsu], Tokyo: Nihon Keizai Shinbun sha.
Weinstein, D. and Y. Yafeh (1998) “On the Costs of a Bank-centered Financial System: Evidence from the Changing Main-bank Relations in Japan,” Journal of Finance, Vol.53, pp.635-672.
Yafeh Y. and O. Yosha (2003) “Large Shareholders and Banks: Who Monitors and How?”
Economic Journal, Vol.113, pp.128-146.