九州大学学術情報リポジトリ
Kyushu University Institutional Repository
Rhizoctonia solani K?hnに関する菌学的・植物病理 学的研究
諸見里, 善一
https://doi.org/10.11501/3063822
出版情報:Kyushu University, 1992, 博士(農学), 論文博士 バージョン:
権利関係:
I Effects of nutr ients on sclerotium formation of Rhizoctonia solani VI •
It is well known that fungal sclerotium production is af fected by various
. f 22)
physical and chemical actors . I n nutrients, especially, the quality an d quantity of carbon and nitrogen sources and the
C/N
ratio play important roles in the sclerotium production4 8' 137>. I t was reported that microsclerotial formation of Verticillium albo-atrum was promoted by manganese ion and that certain isolates of Sclerotinia sclerotiorum did not produce sclerotia without zinc ion128' 130>. I n general, the fungal morphogenesis, i.e. spore, myxospore, perithecium and stroma formation IS induced or promoted by various inorganic 1ons such as potassium, calcium, magnes1um, manganese and phosphate ions130>.In this experiment, the effects of nutrients on the sclerotium formation of 3 isolates of R. solani were tested (Exp.
1)
and the strong effects of carbon, magnesium and phosphorus on the hyphal and sclerotium formation weredemonstrated in detail (Exp. 2). The influence of carbon concentration on the activities of malate dehydrogenase and isocitrate dehydrogenase
(EC 1.1.1.41)
was also investigated.
Exp. 1
Materials and Methods
Fungi used. Three isolates of the R. solani (C-14 isolated from Cyperus
rotundus in Fukuoka, C-324 from sugar cane in Kagoshima and C-326 from r1ce
plant in Fukuoka) were used. These isolates belong to the anastomosis group AG-1 and the cultural type IA.
Cultura The isolates were precultured on PDA at 25°C for 2�3 days. The
small discs of 5 mm in diameter were cut from the edge of the mycelial mat with
a cork borer and used as inocula. To test the qualitative and quantitative effects of various nutrients on the sclerotium formation, various substances
were replaced or added to amend to the basal medium. Hopkins medium (2 g KN03, 0.5 g MgS04, 0.1 g KH2P04, 10 g glucose, 15 g agar, 1,000 ml water) was used as
a basal medium because of its simple composition. Fifteen ml of each medium (autoclaved at 110°C for 10 min) was poured into a Petri dish and inoculated.
Culturing was carried out at 25°C for 14 days under dark conditions. After 14 days, the sclerotia formed were taken out, dried at 60° c and weighed. Each
value is the average of 5 dishes and every experiment was performed 3 times.
-70-
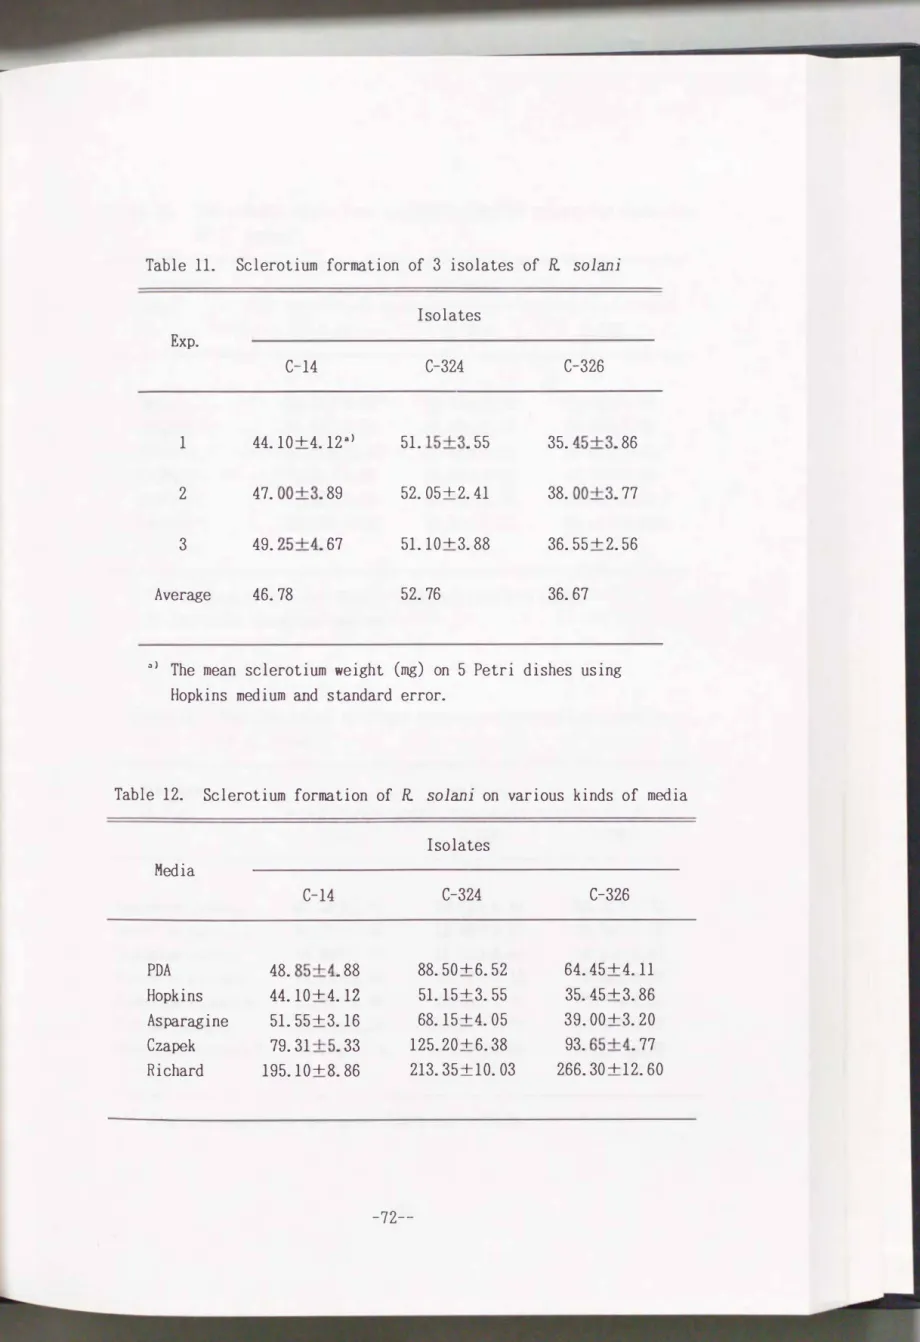
Results
Comparison of sclerotium formation among 3 isolates
To compare the ability of sclerotium formation, the
3
isolates werecultured on the basal medium for
14
days and sclerotia formed were weighed. As shown in Table11,
theC-14, C-324
andC-326
isolates produced about47
mg,53
mg and37
mg sclerotia, respectively, per dish. The process of sclerotium formation of each isolate was similar, although location of sclerotial formation on the medium was slightly different.Comparison of sclerotium formation among different media
The production of sclerotia by the
3
isolates on various media werestudied. The composition of each medium is as follows:
(1)
PDA medium:1,000
ml of potato(200
g) decoction,20
g glucose,(2)
Hopkins medium (the basal medium):
2
g KN03,0.5
g MgS04,0.1
g KH2P04,10
g glucose,(3)
Asparagine medium:5
g KH2P04,2.5
g asparagine,0.2
g MgS04,10
g sucrose,(4)
Czapek medium:0.5
g MgS04,0.5
g NaN03,0.01
g FeS04,0.1
g K2HP04,0.5
g KCl,50
g sucrose,(5)
Richard medium:10
g KNOa,5
g KH2PO,,2.5
g MgSO,,50
g sucrose,0.02
gFeCI2. Each medium (total volume
1,000
ml) contained2%
agar and pH wasadjusted at
6.0
with 1 N NaOH or 1 N HCl before autoclaving. As shown in Table 12, all the3
isolates well produced sclerotia, especially on Richard and CzapekTable 11. Sclerotium formation of 3 isolates of R solani
Isolates Exp.
C-14 C-324 C-326
1 44.10+4.12a) 51. 15+3. 55 35. 45+3. 86
2 47. 00+3. 89 52. 05+2. 41 38. 00+3. 77
3 49. 25+4. 67 51. 10+3. 88 36. 55+2. 56
Average 46. 78 52. 76 36.67
n> The mean sclerotium weight
(mg)
on 5 Petri dishes usingHopkins medium and standard error.
Table 12. Sclerotium formation of R solani on various kinds of media
Isolates Media
C-14 C-324 C-326
PDA 48. 85+4. 88 88. 50+6. 52 64. 45+4.11
Hopkins 44.10+4.12 51. 15+3. 55 35. 45+3. 86 Asparagine 51. 55+3.16 68.15+4. 05 39. 00+3. 20 Czapek 79.31 +5. 33 125. 20+6. 38 93. 65+4. 77 Richard 195.10+8. 86 213. 35+ 10. 03 266. 30 + 12. 60
-72--
Table 13. The effects of various inorganic ions on sclerotium formation of R. solani
Inorganic 1ons
CaCl2 CalhPO, FeC13 FeS0-1 ZnSO, Control b)
C-14
35. 00+4. 98a) 32. 40+6. 28 28. 30+ 10. 65 38. 65+9. 63
1. 43+1.10 44.15+4.12
Isolates
C-324 C-326
59. 60+0. 53 55. 90+0. 79 62.10+2. 20 56. 00+4. 52 60. 08+1. 08 51. 95+4. 63 58. 50+ 1. 51 47. 70+2. 96 45. 75+6. 38 31. 75+6. 92 51.15+3. 55 35. 45+3. 86
a> The mean sclerotia! weight (mg) and standard error.
b) The basal (Hopkins) medium.
Table 14. The effects of nitrogen sources on sclerotium formation of R solani
Nitrogen Isolates
sources
C-14 C-324
Ammonium citrate 57. 50+5. 61 59. 75+ 1. 41 Ammonium tartrate 49. 90+ 1.19 34. 55+3.18 Ammonium sulfate 18. 65+7.12 17. 40+8. 88 Ammonium nitrate 42. 80+8. 89 36.10+2.16 Ammonium chloride 18. 76+8. 60 20. 95+ 1. 90 Scxlium nitrate 48. 50+5. 28 60. 50+2. 74 Potassium nitratea> 44.15+4.12 51.15+3. 55
a> Nitrogen source in the basal (Hopkins) medium.
C-326
22. 70+3. 76 39. 55+2. 45 25.15+2.16 28. 40+4. 09 27. 25+2. 02 44. 58+0. 99 35. 45+3. 86
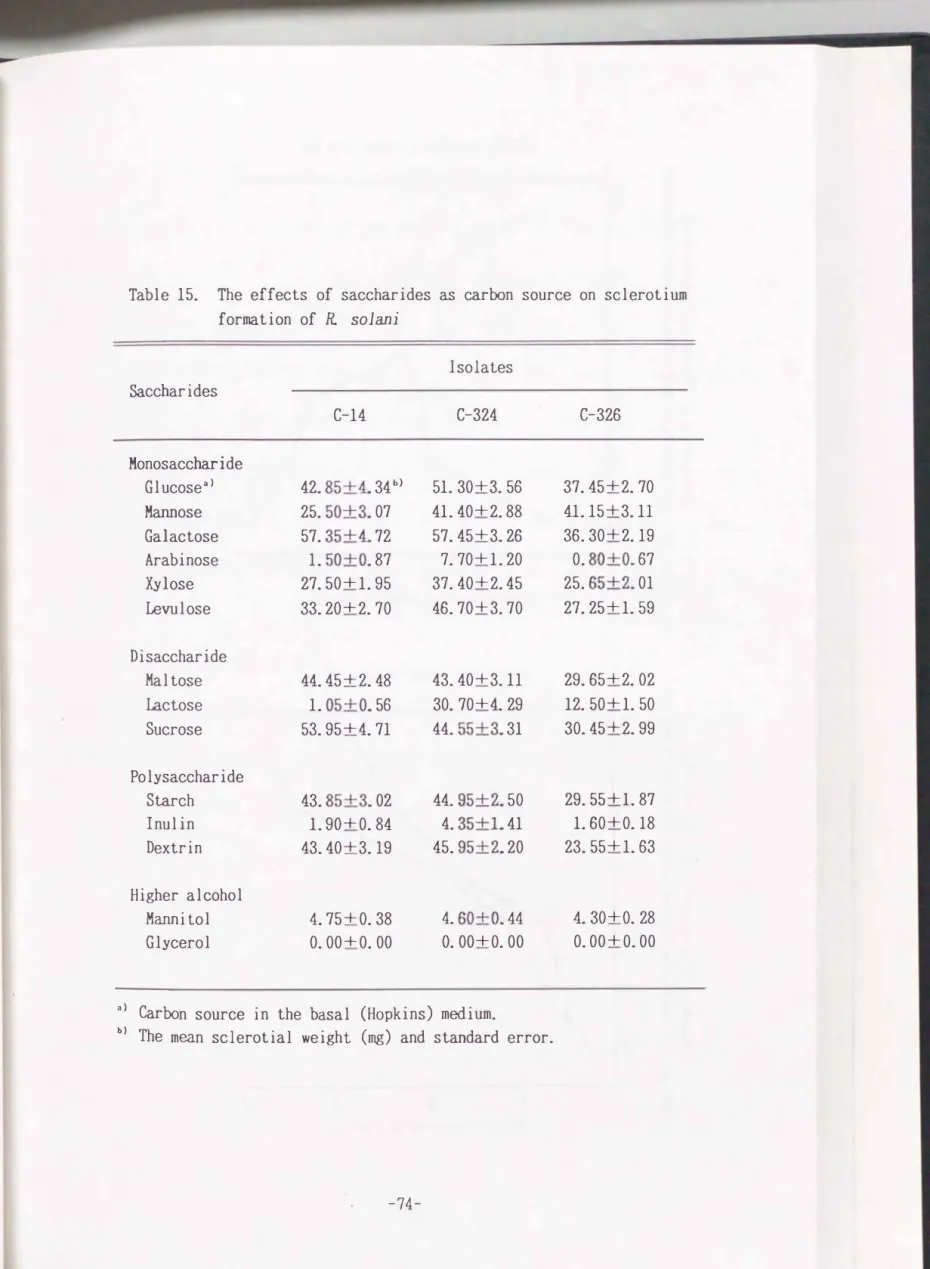
Table 15. The effects of saccharides as carbon source on sclerotium formation of R. sol ani
Isolates Saccharides
C-14 C-324 C-326
Monosaccharide
Glucose"> 42. 85+4. 34 b) 51. 30+3. 56 37. 45+2. 70
Mannose 25. 50+3. 07 41. 40+2. 88 41.15+3.11 Galactose 57. 35+4. 72 57. 45+3. 26 36. 30+2.19 Arabinose 1. 50+0. 87 7. 70+ 1. 20 0. 80+0. 67 Xylose 27. 50+1. 95 37. 40+2. 45 25. 65+2. 01 Levulose 33. 20+2. 70 46. 70+3. 70 27. 25+ 1. 59
Disaccharide
Maltose 44. 45+2. 48 43. 40+3.11 29. 65+2. 02 lactose 1. 05+0. 56 30. 70+4. 29 12. 50+ 1. 50 Sucrose 53. 95+4. 71 44. 55+3. 31 30. 45+2. 99
Polysaccharide
Starch 43. 85+3. 02 44. 95+2. 50 29. 55+1. 87
I nul in 1. 90+0. 84 4. 35+1. 41 1. 60+0.18
Dextrin 43. 40+3.19 45. 95+2. 20 23. 55+ 1. 63
Higher alcohol
Mannitol 4. 75+0. 38 4. 60+0. 44 4.. 30+0. 28 Glycerol 0. 00+0. 00 0. 00+0. 00 0. 00+0. 00
a> Carbon source in the basal (Hopkins) medium.
b) The mean sclerotia! weight
(mg)
and standard error.-74-
I -..J (Jl I
100r
• I SO 1-
bO 6
><
...
..c bO Q) "
-t"j 100
... -
0 L.
Q)
u "' j 0 s 0 f-
us u
�
/' ... r
r--.. �I 11 �
./·
X
�
15 . i;b ._, � .� ..., ..., (1) litj•
--< 0 L.. (1) u Cl)/.f
10 -.5 (1) bOCl)
1.8 l.l 5. 0 ID.O �
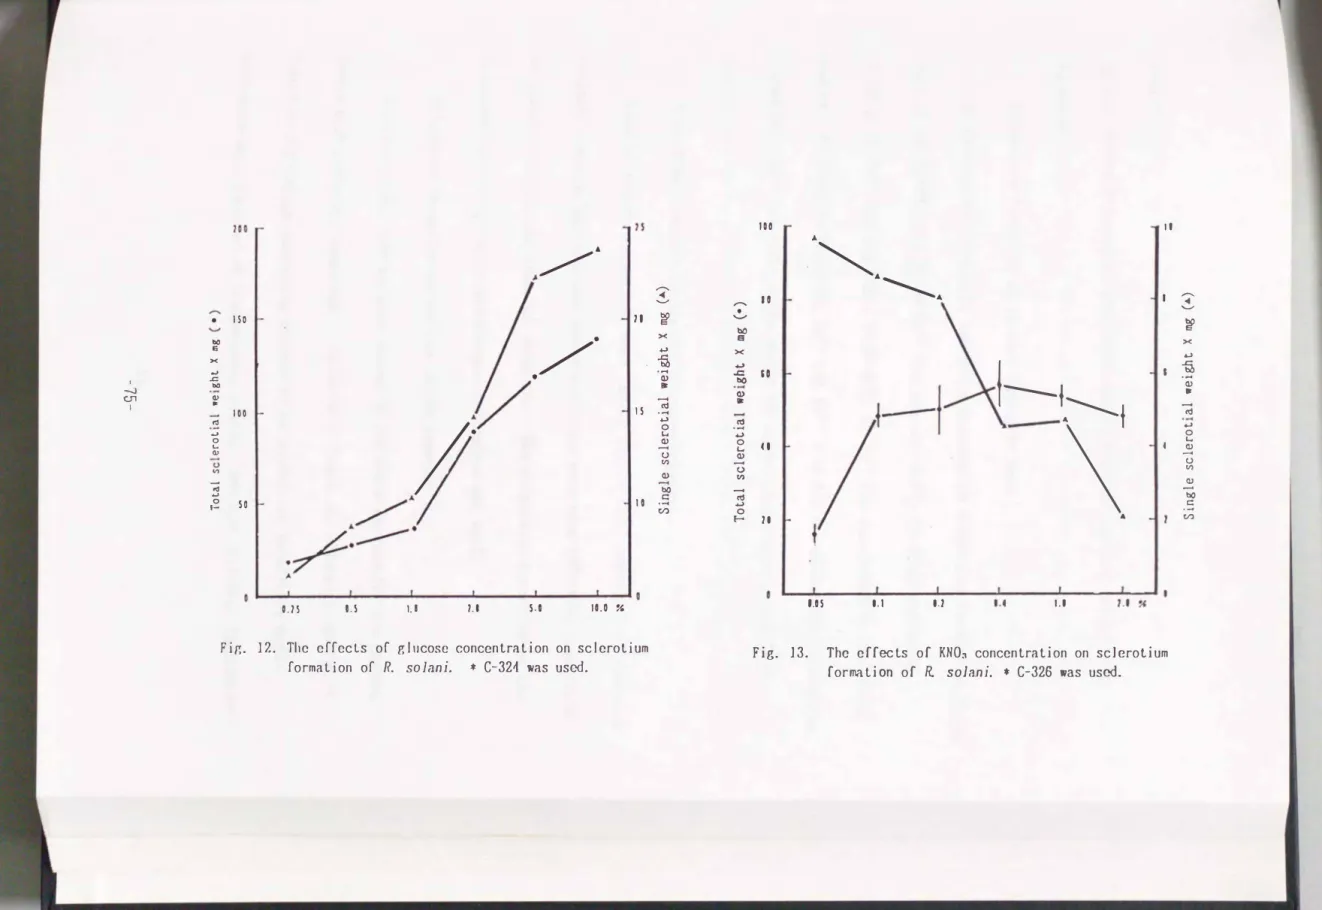
Fir,. 12. The effects of glucose concentration on sclerotium formation of R. solani. * C-321 was used.
100 ... ..., II
-� ·� ...
I�
r--.. 10
'-' •
bO �
e X
X ...,
+->
f--1.___ ��
� so
Q) Ill:
... cd
...,
0 L..
-Q) () Cl)
-;; +->
f-< 0 u 11
f \: 4 ,
1.05 1.1 1.1 I.C 1.1
Fig. 13. The effects of KNO� concentration on sclerotium formation of R solani. * C-326 was used.
(1) IJ -
..., cd
0 L..
--< (1)
u Cl)
-(1)
b() c::
...
Cl)
medium.
Hopkins medium selected as the basal medium gave the smallest sclerotium formation.
Sclerotium formation on var1ous inorganic 1ons
To examine the effects of inorganic elements on sclerotium formation, CaCl2
(0.1
g) and CaHP01 (0.1 g) as Ca2+ ion sources, FeC13 (0.07 g) and FeS01(0.07 g) as Fe2+ ion and ZnS01 (0.07 g/1) as Zn2+ Ion were added to the basal medium. As shown in Table 13, Ca2+ and Fe2+ ions did not affect the sclerotium formation. Zn2+ ion reduced the weight of sclerotia per dish in the C-14
isolate.
Sclerotium formation on various nitrogen sources
Seven nitrogenous compounds were tested (Table 14). Additions of ammonium citrate, ammonium tartrate and ammonium nitrate were more effective than those of ammonium sulfate and ammonium chloride. The sclerotium formation on the potassium nitrate or sodium nitrate-amended medium was well.
Sclerotium formation on various carbon sources
Fourteen carbon sources were tested by the media ame nded for the carbon source with different compounds. As shown in Table
15,
sclerotia were well formed on the medium containing glucose or galactose and relatively wellProduction were observed on the mannose, xylose, levulose, maltose, lactose or
-76-
sucrose amended medium. However sclerotia were poorly formed on the arabinose
medium. The linear hyphal growth of the
3
isolates on the lactose containing medium was almost the same but the poor sclerotium formation was observed in theC-14
isolate. Starch, inulin and dextrin were well utilized for the mycelial growth, while very little amount of sclerotia were produced on inulin medium.Higher alcohols such as glycerol and mannitol were used as carbon sources.
However, hyphal growth and the sclerotium production were very poor, especially
on glycerol amended mediu�
Effects of carbon concentration on sclerotium formation
To examine the effects of concentration of the carbon source on sclerotium formation, glucose was added at var1ous concentrations
(0.25�10.0%).
As shownin Fig.
12,
the total as well as single sclerotia! weight was increased with the glucose concentration. The single and total sclerotium weights of theC-326
isolate increased
4�5
times and3�4
times, resp ectively, by a10
timesincrease of the glucose concentration.
Effect of nitrogen concentration on sclerotium formation
The concentration of potassium nitrate was varied to examine the effects of the nitrogen concentration on sclerotium formation. Quite few amount of
sclerotia were formed at a low concentration
(0.05%).
The weight of single sclerotium inversely decreased according with the increase of KN03 concentration(Fig.
13).
Discussion
The effects of nutrients on fungal differentiation such as sporulation and sclerotium formation have been well documented16' 22>. Townsend118> reported that sclerotia! initials were formed even on a relatively poor medium but further development requires nutrients.
enhance the sclerotium formation.
Moreover, unfavorable conditions may
The present experiment revealed several aspects of the sclerotium production by R solani which were affected by changes of nutritional composition.
Watanabe and Matsuda130> studied the culture types of R. solani and reported that the size and productive ability of sclerotia were different between culture types. Well sclerotium production was obtained on Richard and Czapek medium, probably because the high concentration
(50
g/1) of glucose in both media served as a good carbon source. Several minerals were tested but no significantdifference was observed except for Zn2+ ion. In Whetzelinea sclerotorum, 1 mg/litre of Zn2+ caused maximal sclerotium formation, whereas higher amounts increased their total dry weight but in a smaller number of sclerotia128>. In the Present experiment, however, the addition of Zn2+ ion inhibited the
-78-
sclerotium formation, especially in the C-14 isolate. Several workers7' 52' 85'
1os. 129. I3o> showed that the source and concentration of nutrient, particularly
those supplying carbon and nitrogen, affected the sclerotium formation and that both NH4+ and NOa- can be utilized by sclerotium forming fungi for growth and
sclerotium formation. No different effect of inorganic nitrogen sources on the sclerotium formation has been reported. However, in this experiment the
formation on the ammonium sulfate or ammonium chloride containing medium was
worse than that on the nitrate containing media. The effects of the carbon
sources on sclerotium formation are well known. Heal and Issac52> observed that the number of microsclerotium increased with the addition of carbohydrate,
especially sucrose. Working on Sclerotinia sclerotiorUI14 Bedi 7> found that
maltose was most suitable and that lactose and galactose were poor sources.
Furthermore the author7> reported that ma nnitol, although it was well utilized for mycelial growth, totally inhibited the sclerotium formation. On the other
hand, Wang and LeTourneau129> reported some different results, finding the highest sclerotium formation with raffinose, sucrose, maltose, lactose, mannose,
glucose and fructose. In author's results, arabinose, lactose and inulin were the most suitable for the sclerotium formation. Mannitol and glycerol were
unuseful for the mycelial growth and the sclerotium production. The
concentration of carbon and nitrogen sources evidently affected the sclerotium
formation. The increase of glucose concentration augmented the total and single sclerotia! weight. No obvious changes of total sclerotia! weight In
addition of potassium nitrate over 0.1% were observed and the decrease 1n Size of each sclerotium occurred.
The dependence of sclerotium formation on the C/N ratio 1n the medium has been documented 1n several fungi48' 137>, the most suitable N/C ratio was found to be 1. 4---7. 0% 1n R. sol ani. The carbon source concentration may be a crucial
factor fo r the total sclerotia! weight an d the nitrogen concentration for the scler otia! number.
-80-
Exp.
2Materials and Methods
Fungus. An
isolate (C-324) was used 1n this experiment.
Media.
Preculture of the fungus was conducted on PDA. Hopkins medium was used as a basal medium. The pH of the media was adjusted to 6.5 before
autoclaving at 110°C for 10 min.
Eff ects of carbon concentration of enzymes activities.
A series (15 ml each) of the medium amended with the concentration of glucose (0�10%), was each poured into a Petri dish which was covered with cellulose membrane (8.5 em 1n
diam.) . Mycelial discs precultured for 2�3 days were put on the centers of
the media. When the mycelial tops reached the margin of the plates, the colonies were peeled off, weighed and homogenized in 25 volumes of 0.05 M sodium phosphate buffer (pH 6.5) . The homogenates were centrifuged at 3,000
gfor 20 min twice. The supernatants were dialyzed against 0.02 M sodium
phosphate buffer (pH 6.5) for 12 hr. Aliquots (0.5 ml) of the samples were each mixed with the soluti on, and incubated at 37°C for 50 min for the measurement.
Details w ere as described in Chapter
V.The substrate solution were prepared as
follows.
1) Malate dehydrogenase
7.5
mg NADand
7mg 1-malate were dissolved 1n
5
ml of0.05
M sodium phosphate buffer(pH 6.5).
2) Isocitrate dehydrogenase ·
7.5
mg NAD and7
mg DL-isocitric acidtrisodium salt were dissolved in
5
ml of0.05
M sodium phosphate buffer(pH
6.5).
The concentration of total soluble protein was tentatively calculated using the following formula.Protein concentration
(mg/ml)==l.55D2so--0. 76D26o
109>Incorporation of carbon source from medium.
diluted with distilled water to
1/100.
Aliquots(1
ml) of the solution were each filtered through a0.2
pm cellulose nitrate filter membrane into14
ml ofthe basal medium amended with the carbon concentration
(0.25�10%).
Cellulosemembranes (8.5 em in diam.) were sheeted on the media. Mycelial discs
precultured on PDA were each placed on the center of the sheet and incubated at
25°C
in an incubator for14
days. The membranes were peeled off and the media were daily punched out at random with a cork borer to obtain discs of6. 5
mm in diameter. The discs were each melted in a water bath in 9 ml of distilled water per g of the sample. Ten ml of ACS II (Amersham) was added to1
ml of the properly diluted sample and the radioactivity was counted by a Packard Tri-Carb300C
scintillation counter.-82-
Effects of c arbon source on hyphal branching. The isolate was cultured on
various media mixed with various concentrations of carbon source. At the stage when hyphae grew to
2
em in diameter (PhaseI),
and at 6 (PhaseII)
and12
hr (PhaseIII)
after the hypha! tips reached to the edge of the plate, the hypha!internode (from one hypha! branch to another branch) was measured using a light microscope.
Effects of magnesium and phosphate on sclerotium formation. One or both
of MgS04 and KH2P04 were removed from the basal medium and additionally given at
var1ous concentrations
(KH2P04:1�1,000
ppm,MgS04:l00�5,000
ppm) to themedium. For the test of the effects of different kind of phosphate, KH2PO� of the basal medium was replaced with some of other phosphates with different cations. The edges of mycelial mats precultured on PDA were cut with a cork borer
(5
mm in diam.), centered on the media and cultured at25°C.
The initials of sclerotia were counted at 4 days after inoculation and sclerotia formed onthe media were collected, desiccated and weighed.
Effects of phosphate on sclerotial morphogen esis. The seamless cellulose
dialysis bag was opened and the sheet was cut to round shape,
8.5
em 1ndiameter. The membranes were sheeted on the media with or without KH2P01 and then mycelial discs were centered on the membranes and precultured at
25°C.
Themembranes which were covered with mycelia were transferred onto other media at
48 hr (the mycelial stage) or 96 hr (the initial stage) after inoculation. Aft
er theculture for 14 days at 25°C, sclerotia formed on the membrane were collect ed,
counted, desiccated and weighed.
Incorporation and tr ansportation of phosphorus.
diluted with distilled water to 1/200. One ml aliquots of the solution were added through a 0.2 �m cellulose nitrate filter, which were immersed in each 15 ml of the basal medium. The solutions were stirred well with a mixer, poured into Petri dishes (9 em in dia�). After cooling, the discs were sheeted with cellulose membranes (8 em in diam,). The mycelial disc precultured on PDA were placed on the centers and kept at 25°C. When the culturse reached the initial, white sclerotium or mature sclerotium stage, the membrane were peeled off, and media were punched out randomly with a cork borer to obtain discs of 6.5 mm 1n diameter. The discs were dried and counted the radioactivity at 1,200 V for 1 min by an Aloka GM counter.
Autoradiography. The isolate was cultured on the basal medium containing
32P-labelled KH2P04. After 14 days, an X ray film (Fuji FR) was attached tightly onto the culture for 6 hr.
Enzymatic activity. The edge of mycelial mat precultured on PDA was
Punched out. The discs were each placed on the center of the basal, KH2P04-free
-84-
medium, on which cellulose membranes was sheeted. and cultured at
25°C.
Hyphae were peeled off shortly before the initial formation and homogenized with10
volumes of
0.05
M phosphate buffer(
pH6.5).
The homogenate was centrifuged at3,000
g for20
min. The supernatants were concentrated to one1/25
of its original volume by a MiniconB-15
concentrator(
Amicon Ltd.)
, and measured for malate dehydrogenase and isocitrate dehydrogenase activities by the method asdescribed above.
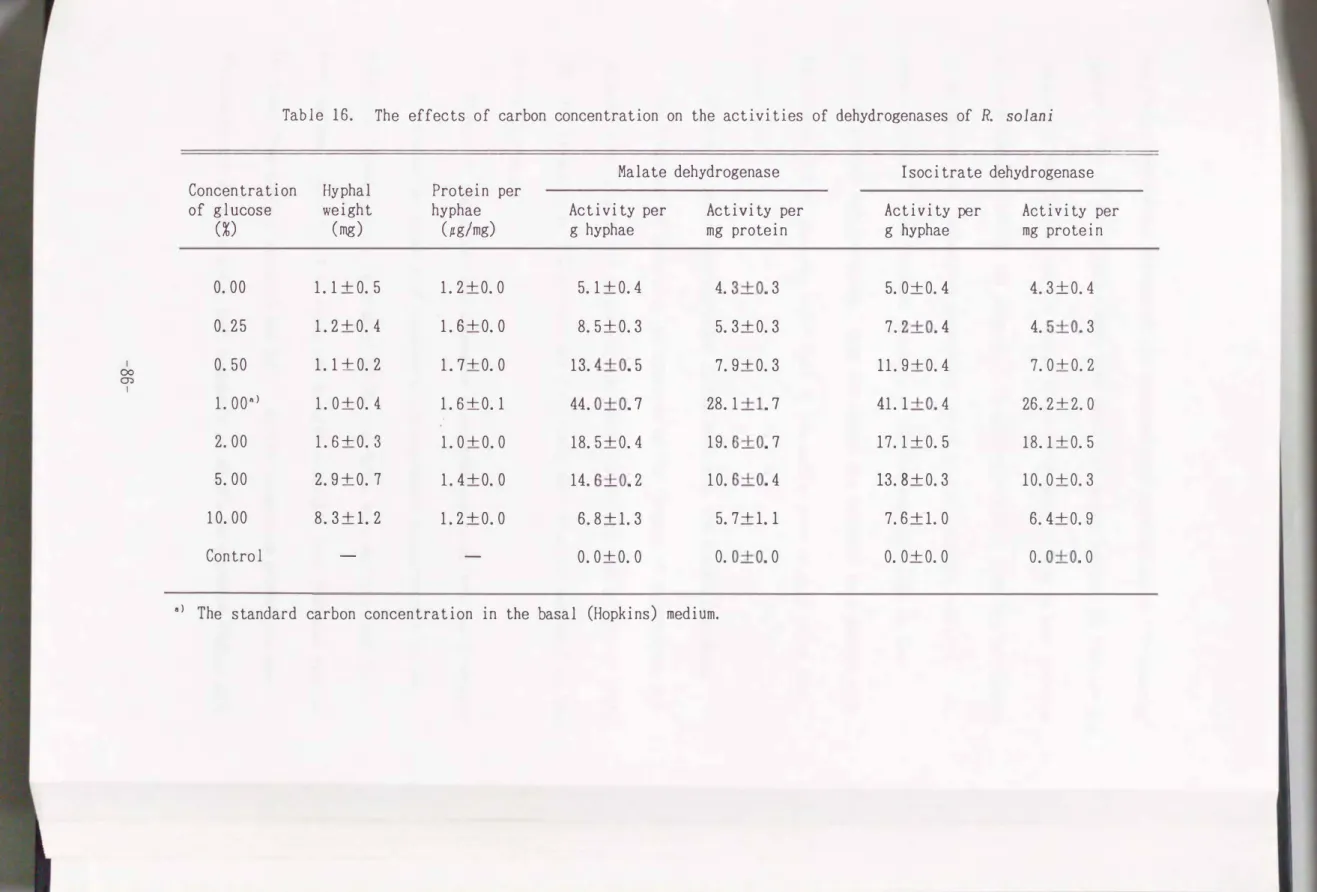
Results
Effects of carbon concentration in media on the fungal enzymatic activi ties
The activities of malate dehydrogenase and isocitrate dehydrogenase varied with the glucose carbon concentration. The activities were high when cultured
with
0.5�5.0%
of glucose. The optimal carbon concentration in the medium for the 2 enzymes was about1%.
Although highest mycelial growth was observed whenthe carbon concentration was ad
j
usted around10%
in the medium, the enzyme activities per g hyphae or per mg pro tein were low under the same conditions(
Table16).
Changes of carbon source in medium during sclerotia] morphogenes is
To elucidate the carbon consumption during the sclerotia! morphogenesis of
Table 16. The effects of carbon concentration on the activities of dehydrogenases of R solani
Malate dehydrogenase Isocitrate dehydrogenase Concentration Hyphal Protein per
of glucose weight hyphae Activity per Activity per Activity per Activity per
(%) (mg)
(pg/mg) g hyphae mg protein g hyphae mg protein0.00 1.1 +o. 5 1.2+0.0 5.1 +0. 4 4. 3+0. 3 5. 0+0. 4 4. 3±0. 4
0.25 1. 2+0. 4 1. 6+0. 0 8. 5+0. 3 5. 3+0. 3 7. 2+0. 4 4. 5+0. 3
I 0.50 1.1 +o. 2 1. 7+0. 0 13. 4+0. 5 7. 9+0. 3 11. 9+0. 4 7. 0+0. 2
<X>
m I
1. ooa> 1.0+0.4 1.6+0.1 44. o+o. 7 28.1 +1. 7 41.1 +0. 4 26. 2+2. 0
2.00 1.6+0.3 1. 0+0. 0 18. 5+0. 4 19. 6+0. 7 17.1+0.5 18.1+0.5
5.00 2.9+0.7 1. 4+0. 0 14. 6+0. 2 10. 6+0. 4 13. 8+0. 3 10. 0+0. 3
10.00 8.3+1.2 1. 2+0. 0 6.8+1.3 5.7+1.1 7.6+1.0 6. 4+0. 9
Control - - 0. 0+0. 0 0. 0+0. 0 0. 0+0. 0 0. 0+0. 0
a> The standard carbon concentration in the basal (Hopkins) medium.
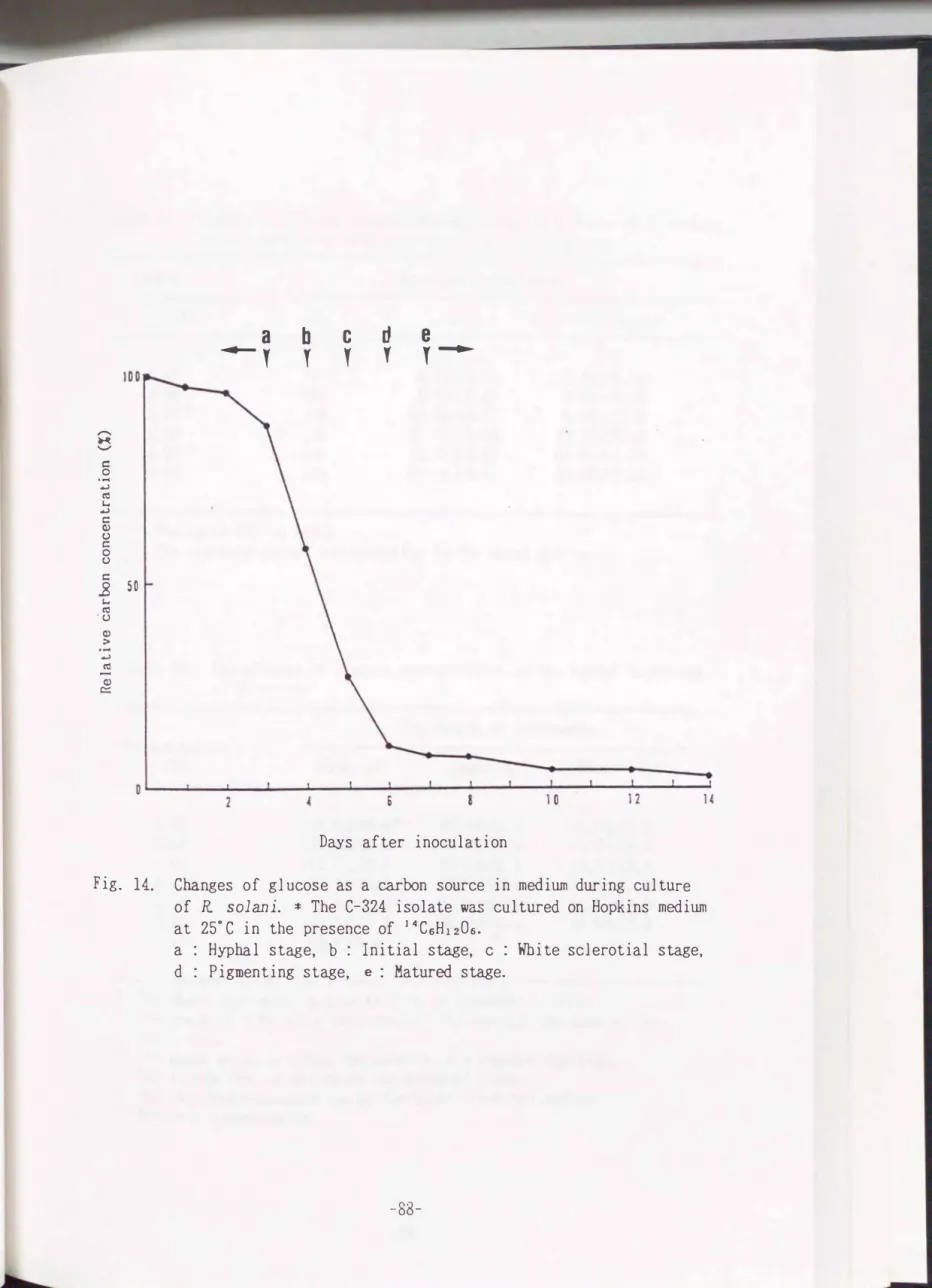
the fungus, periodical changes of the compound were examined using 1�C-labelled glucose. Fig.
14
shows that almost same amount of carbon sources to that at the inoculation were present at the hyphal stage(0�3
days). Then it was consumedwithin a few days during the sclerotial morphogensis stages from the initiation to the maturation. After the maturation,
4�5%
of the compound remained. Asshown in Table
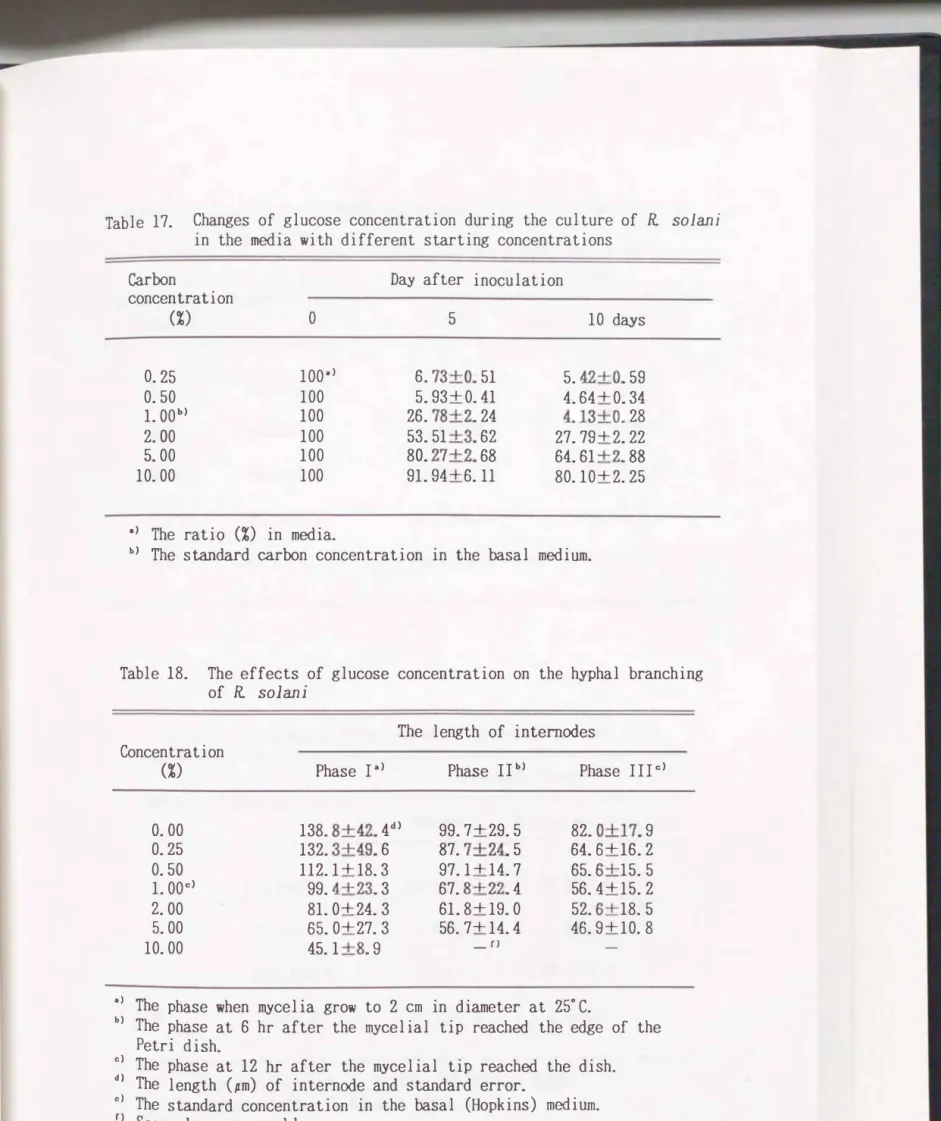
17,
the residual quantity of glucose was increased as thestarting glucose was increased. When the fungus was cultured on a medium with
10%
glucose,80%
of that was still left in the medium even10
days after the inoculation.Effe cts of carbon concentration in the medium on the hyphal branching The frequency of branching, as measured by the lengths of internodes, was
increased according to the carbon concentration and to the time of growth (Table
18).
The branching at10%
glucose was 2�3 times more frequent compared to that at0�0.5%
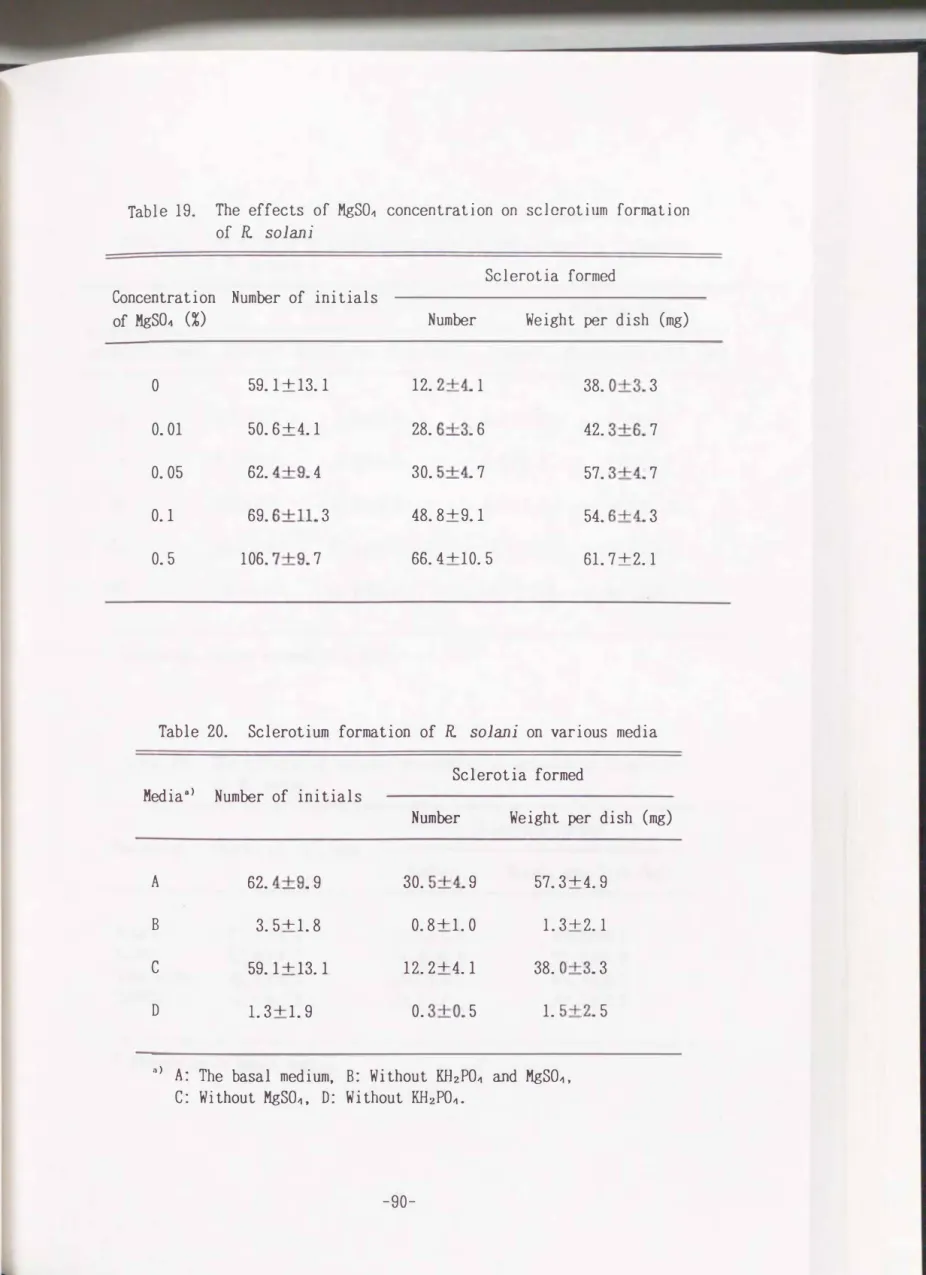
glucose.Effects of phosphorus and magnesium concentrations on sclerotium formation
To examine the effects of phosphorus and magnesium concentration on the sclerotium formation, one or both of KH2P01 and MgS01 were omitted from the basal medium. Sclerotia! initials and matured sclerotia were produced well on the MgS04-free media (Tables
19
and20).
Little sclerotium production was observed on the media in which both compounds or KH2PO� were absent (Table20).
,-...
� .._.,
c:: 0
·� ..., ro """
..., c: (l) C) c:
0 C) c:
.8 """
'C) ro (l) >
...,
-ro
c=: (l)
50
a
�y b y
c
y d
y
er�
Days after inoculation
Fig. 14. Changes of glucose as a carbon source in medium during culture of R solani. * The C-324 isolate was cultured on Hopkins medium at 25°C in the presence of 14CsH120s.
a : Hyphal stage, b : Initial stage, c : White sclerotia! stage, d : Pigmenting stage, e : Matured stage.
-88-
Table 17. Changes of glucose concentration during the culture of R solani in the media with different starting concentrations
Carbon
concentration
(%)
00.25 1oo·>
0.50 100
1. oob> 100
2.00 100
5. 00 100
10.00 100
a) The ratio
(%)
in media.Day after inoculation 5
6. 73+0. 51 5. 93+0. 41 26. 78+2. 24 53. 51 +3. 62 80. 27+2. 68 91. 94+6.11
10 days
5. 42+0. 59 4. 64+0. 34 4.13+0. 28 27. 79+2. 22 64.61 +2. 88 80.10+2. 25
b) The standard carbon concentration in the basal medium.
Table 18. The effects of glucose concentration on the hyphal branching of R solani
The length of internodes Concentration
(%)
Phase Ia> Phase lib> Phase IIIc>0.00 138. 8+42. 4 d) 99. 7+29. 5 82. 0+17. 9
0.25 132. 3+49. 6 87. 7+24. 5 64. 6+ 16.2
0.50 112.1 + 18.3 97.1 + 14. 7 65. 6+ 15. 5
1. ooc> 99. 4+23. 3 67. 8+22. 4 56. 4+ 15. 2
2.00 81. 0+24. 3 61.8+19.0 52. 6+ 18. 5
5. 00 65. 0+27. 3 56. 7+ 14.4 46. 9+ 10. 8
10.00 45.1 +8. 9 _f)
a> The phase when mycelia grow to 2 em in diameter at 25°C.
bl The phase at 6 hr after the mycelial tip reached the edge of the Petri dish.
c) The phase at 12 hr after the mycelial tip reached the dish.
d) The length (�m) of internode and standard error.
c> The standard concentration in the basal (Hopkins) medium.
r) s carcely unmeasurable.
Table 19. The effects of
MgSO�
concentration on sclerotium formation of R. solaniConcentration Number of initials of MgS0-1
(%)
0 59.1 + 13.1
0. 01 50. 6+4..1
0.05 62. 4+9. 4.
0.1 69. 6+11. 3
0. 5 106. 7+9. 7
Sclerotia formed
Number Weight per dish (mg)
12. 2+4.. 1 38. 0+3. 3
28. 6+3. 6 42. 3+6. 7
30. 5+4. 7 57. 3+4. 7
48. 8+9.1 54. 6+4. 3 66. 4+ 10.5 61. 7+2.1
Table 20. Sclerotium formation of R. solani on various media
Sclerotia formed Mediaa> Number of initials
Number Weight per dish (mg)
A 62. 4+9. 9 30. 5+4. 9 57.3+4..9
B 3.5+1.8 0.8+1.0 1. 3+2.1
c 59.1 + 13.1 12. 2+4.1 38. 0+3. 3
D 1.3+1.9 0. 3+0. 5 1. 5+2. 5
a> A: The basal medium, B: Without
KHzPO�
andMgSO�,
C: Without
MgSO�,
D: WithoutKHzPO�.
-90-
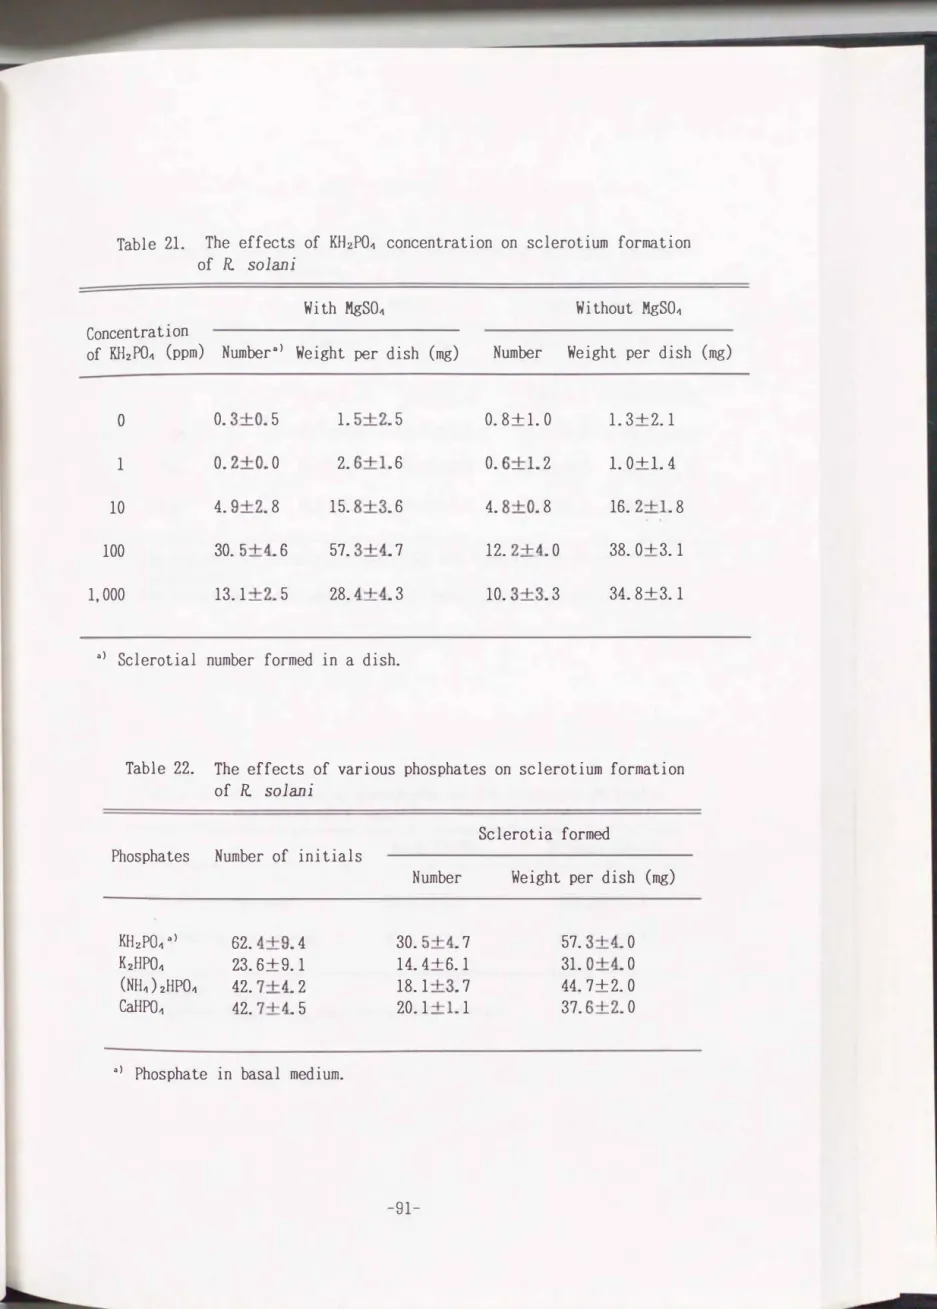
Table 21. The effects of KH2PO� concentration on sclerotium formation of R. solani
With MgSO�
Concentration
of KH2PO� (ppm) Numbera> Weight per dish
(mg)
0 0. 3+0. 5 1. 5+2. 5
1 0. 2+0. 0 2. 6+1. 6
10 4. 9+2. 8 15. 8+3. 6
100 30. 5+4. 6 57. 3+4. 7
1,000 13.1 +2. 5 28. 4+4. 3
a> Sclerotia! number formed in a dish.
Without MgSO�
Number Weight per dish
(mg)
0.8+1.0 1. 3+2.1 0. 6+1. 2 1.0+1.4 4. 8+0. 8 16. 2+1. 8 12. 2+4. 0 38. 0+3.1 10. 3+3. 3 34. 8+3.1
Table 22. The effects of various phosphates on sclerotium formation of R. solani
Sclerotia formed Phosphates Number of initials
Number Weight per dish
(mg)
KH2PO� "> 62. 4+9. 4 30. 5+4. 7 57. 3+4. 0
K2HPO� 23. 6+9.1 14. 4+6.1 31. 0+4. 0
(NH-1)2HPO� 42. 7+4. 2 18.1 +3. 7 44. 7+2. 0
CaHP0-1 42. 7+4. 5 20.1 +1. 1 37. 6+2. 0
"> Phosphate in basal medium.
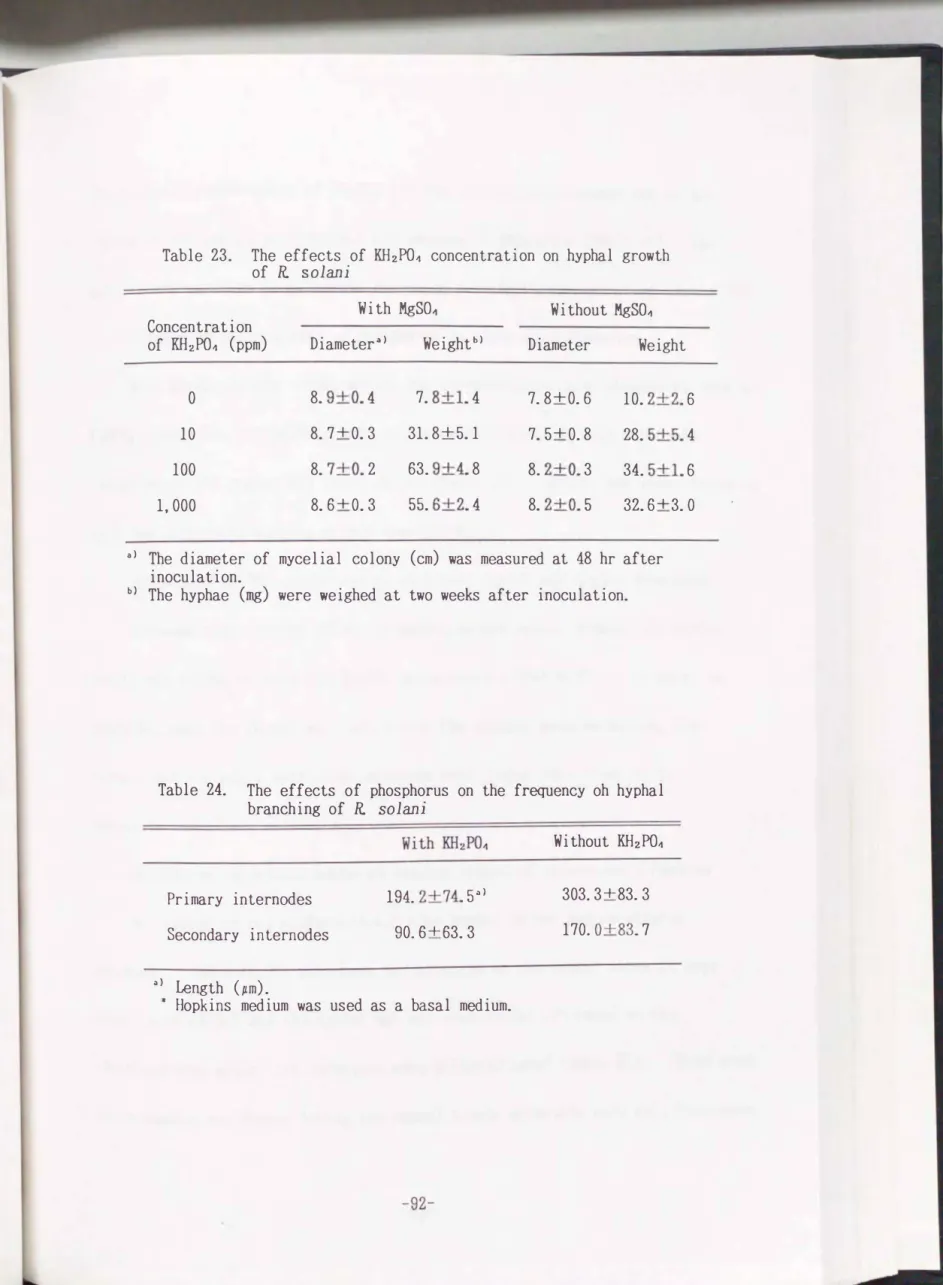
Table 23. The effects of
KH2PO�
concentration on hyphal growth of R. solaniConcentration
With
MgSO�
WithoutMgSO�
of
Kl-hPO�
(ppm) Diameter a> Weightb> Diameter Weight0 8. 9+0. 4 7. 8+1. 4 7. 8+0. 6 10. 2+2. 6
10 8. 7+0. 3 31. 8+5.1 7. 5+0. 8 28. 5+5. 4
100 8. 7+0. 2 63. 9+4. 8 8. 2+0. 3 34. 5+1. 6 1,000 8. 6+0. 3 55. 6+2. 4 8. 2+0. 5 32. 6+3. 0
a> The diameter of mycelial colony (em) was measured at 48 hr after inoculation.
b) The hyphae (rng) were weighed at two weeks after inoculation.
Table 24. The effects of phosphorus on the frequency oh hyphal branching of R. solani
Primary internodes 194. 2+74. sa>
Secondary internodes 90. 6+63. 3
a) Length
(pm).
* Hopkins medium was used as a basal medium.
Without
KH2PO�
303. 3+83. 3 170. 0+83. 7
The optimal concentration of KH2PO� for the sclerotium formation was in the region of
100
ppm at the presence and absence of magnesium (Table21).
Thequality and quantity of sclerotia increased with MgSO� concentration (Table
19).
Effects of various kind of phosphates on sclerotium formation
When KH2P04 in the basal medium was replaced with other phosphates such as K2HP04, (NH4)2P04 and CaHP04, sclerotia were well produced with a certain
variation on the number and total weight (Table
22).
much the sclerotia! forming effect than K2HP04.
KH2P04 had about twice as
Effects of KH2P04 concen tration on hyphal growth and hyphal branching Although there was no effect of KH2P04 on the hyphal growth, the hypha!
weight was increased with the KH2P04 concentration (Table
23).
As shown 1nTable
24,
when the fungus was cultured on the phosphorus-free medium, the primary and secondary branching intenodes were longer than those of onphosphate containing medium.
Effects of phosphorus added at limited stages of sclerotium formation No sclerotium was differentiated f�om hyphae on the medium without Phosphate. When KH2P04 phosphate was supplied at the hyphal phase
(2
daysafter inoculation) and the hyphal m at was transferred afterward to the
Phosphate-free media, few sclerotia were differentiated (Table
25).
Even when the phosphate was absent during the hyphal stage, sclerotia were we ll develo pedTable 25. The effects of KHzPO� on each stage of sclerotium formation of R. solani
Hyphal stagea> Initial stageb>
KlhPO-t
Number Weight per dish
(mg)
Number Weight per dishPresent Present
t
14. 0+1. 5 38. 9+5. 9 11.2+1.5 42. 5+5. 9
Present
t
2.3+1.0 6. 4+2.1 4. 4+1. 2 16. 0+5. 5 AbsentAbsent
t
12. 6+1. 5 37. 0+6. 6 20. 9+2. 3 42. 2+5. 9Present Absent
t
0. 2+0. 3 1. 5+2. 2 0. 0+0. 0 0. 0+0. 0Absent
a) Hyphal stage : 48 hr after inoculation.
b) Initial stage : 96 hr after inoculation.
Table 26. The effects of phosphorus on the activities of enzymes of R. solani
Enzymes
Malate dehydrogenase
Isocitrate dehydrogenase
n) Includes no mycelial b) Relative activity.
Present Absent
2. 9b) 2. 0
1.8 0. 8
extract.
Control a>
0. 0
0. 0
(rng)
100�
..
c 0 . . . ·'
....>
...
E
so�1 2
•
::::::::::::::I
I ll
�-7-: . .
3 4 5 6
Fig. 15. Distribution of 32P in the medium, hyphae and sclerotia at different stages of sclerotial morphogenesis of R solani.
1 : Hyphal stage, 2 : Initial stage, 3 : White sclerotial stage, 4 : Pigmenting stage, 5 : Matured stage (lOth day), 6 : Matured stage (14th day).
[]
. . : Medium,•
: Hyphae ,••
Sclerotiumafter the culture was transferred to the phosphate-containing medium. This phenomenon was also observed when the transfer was conducted at the sclerotia!
initial phase
(4
days after inoculation)
. When phosphate was present at the initial phase, ca.4
sclerotia(16 mg)
per dish were differentiated even after the culture was transferred to the phosphate-free medium. When the compoundwas absent at the initial stage, ca.
20
sclerotia(42
mg)
per dish were formed after the cultures were transferred to the phosphate-containing medium.Incorporation and translocation of phosphate
By a tracing investigation with 32P-labelled KH2P04, the almost all of the isotope was detected in the medium at the hyphal phase
(48
hr afterinoculation
)
. The radioactiv ities were then transported to the hyphae and about60%
of them were finally accumulated in the sclerotia (Fig.25)
Plate5
showsa autoradiogram at
14
days after inoculation.Enzymatic activity
The activities of malate dehydrogenase and isocitrate dehy drogenase in the hyphae developed on the media with phosphorus CKH2P04
)
were higher than those on the medium without the salt (Table26).
Discussion
In Exp.
1,the author showed that the quanity of carbon source is one of the important factors controlling the sclerotium formation of
R.
s 1 o an1. ·A previous
report48' revealed that the N/C ratio and cyclic
AMPplay important roles for the sclerotium formation of the
R. solani.Fungi are heterotrophic, in general and carbon sources are from media and/or from internal organic matters. As shown in Table
16,the activities of the
2dehydrogenases were highest at
1%glucose. This result seemed not to agree with the quantities of sclerotia formed. However, considering that the hyphal weight on a membrane was increased as the starting carbon concentration was increased, the total activities per colony might also depend on the starting concentration. The consumption of carbon source was remarkable during the period of the sclerotia! differentiation from the initial to the pigmenting sclerotium. This fact indicates that a small amount of carbon source allows hyphal growth but a large amount of it is
essential to the sclerotium differentiation. The residual quantity of carbon source was increased with the starting concentration, though the total amount of
consumption was also increased. Furthermore, the frequency of hyphal branching which is the first step of the sclerotium formation was significantly increased
with the concentration. These facts could support the idea that the carbon
quantity 1s one of the important factors deciding the sclerotium quantity.
On the other hand, none or quite few sclerotia were formed on the medium from which phosphorus compound was removed. However, when only magnesium was
removed from the basal medium, half in number and two-thirds in weight of
sclerotia were formed. Some differences were observed when KH2P04 in the basal medium was replaced with other phosphates such as K2HP0-1, (NH4)2P04 and CaHP04•
The optimal concentration of KHzP0-1 was about 100 ppm regardless the presence of magnesium. For a large number of plants, it has been indicated that the optimal concentration of phosphate in soil is 1,...._,10 pM, whereas its cytoplasmic
concentration of a plant cell is 1,...._,20 pM11' 83l. Compared with higher plants, the fungus required large amounts of phosphate. The number and total weight of the initial and matured sclerotia were increased with the magnesium
concentration. Although there was no significant difference on the hypha!
linear growth of the fungus by phosphate, the total weight of the mycelial mat
after 2 weeks was obviously increased at 100 ppm phophorus in the presence of magnesium. It is suggested that magnesium ion is not always indispensable to the sclerotia! morphogenesis but has an inductive or promotive effect. It is widely noted that sufficient growth of hyphae is essential to the subsequent
sclerotium formation22• '�8>. Wheeler and Sharan132> showed that the number and weight of sclerotia of Sclerotium rolfsii were decreased in proportion to the
-98-
KH2PO, concentration but concluded that phosphate has a lesser effect on the sclerotium formation than potassium. However, phosphorus 1s one of the
essential compounds composing nucleic acids. If there was no phosphorus at all
in a medium, no development of hyphae should be observed. A very small amount
of phosphorus, which allows the hyphal development but not the initiation of the
sclerotium formation, might be contaminated into the media as impurities of the ingredients and water used or f rom air during culture. The enzymatic activities
concerning the TCA cycle in the hyphae grown on a medium with phosphorus were higher than in those grown on a phosphorus-free medium. Moreover, when KHzPO"
in Hopkins medium was replaced with (NH")2HPD" or CaHPO", sclerotia were also
well produced. Even if phosphorus was given during the hypha! and initial
stages, few sclerotia were formed when the compound was taken away afterwa�ds.
Even though the chemicals were omitted during the hyphal and initial stages,
well production was recognized when phosphorus was added later. These results may indicate that a large quantity of phosphorus may not always be necessary to the hypha! development, but indispensable to the sclerotia! initiation, and the subsequent enlargement and maturation which required high energy. Thus, no sclerotia may be originated without phosphorus even when ample carbon or
nitrogen as energy sources are present. Furthermore, it is indicated that a large amount of isotope-labelled phosphorus was accumulated into the sclerotia!
tissues from media through hyphae.
An accumulation of a�p in the sclerotia, hypha! tips and at branches of hyphae 1n R. solani has been reportedGu>. A large proportion of phosphorus
was absorbe d during the trophophase migrated to the fungal spore 1n Aspergillus nigarG· 7J. 72>. It was proposed that fungal sclerotium is not only the hypha!
mass but also the organ which is similar to perithecium and fruit body in morphology and physiology., a. 49' 51>. The fact observed in this experiment could support this proposal and could indicate that phosphorus is, at least, one of the essential constituents of the sclerotia! tissue and that the manner of uptake of phosphorus closely resembles that seen in a seed of higher plants or a fungal spore.
On the other hand, sclerotia were normally initiated and matured without magnesium, though the weight of hyphae and mature sclerotia increased with the magnesium concentration. Magnesium ion, which is essential to higher plants for the chlorophyll and for the activators of var1ous important enzymes, may not always be important to the fungal growth.
-100-
VIII. Effects of am1no acids on sclerotium formation of Rhizoctonia solani
Part 1. Inhibition of sclerotium formation by var1ous amino acids
R. solani invol ves ma ny stra ins which have morphologically, phys iologically,
pathologically and ecologically different chara cteristics. However, most of
them generally form the a sexual structure in vitro and in viv o92• 115• 123• 13o>.
The effects of physical a nd c hemical fa ctors on sclerotium formation of Sclerotium rolfsii, S. delphinii, Sclerotinia sclerotiorum Botrytis c inerea, and Verticillium albo-atrum ha ve been well-documented!. 21• 23• 48• 60• 73• 74• 79• 84>.
However, there are few reports in regard to the effect of nutrients on the
sclerotium formation of R. solani22>
In the previous c ha pter, the author reported that the nutrient factors, organic and inorganic substances ha ve qualitative a nd qua ntitative effects on thesclerotium formation86>. I n this chapter the effects of amino ac ids,
especia lly as inh ibitory factors are studied�
Materials a nd Methods
Fungal isolates used. C-14 from Cyperus rotundus, C-324 from suga r cane
and C-326 from r1ce
(AG-1, IA),
were used in this study.Culturing. Isolates were precultured on
PDA
plates at 25°C for 2�3 days.Small discs of 5 mm 1n diameter were cut from the edge of mycelial mat with a cork borer and used as an inoculum. Hopkins medium was used as a basal medium.
To examine the effects of amino acids on the sclerotium formation,
potassium nitrate was replaced with various amino acids or their isomers so as to contain equivalent nitrogen with the control medium. After culturing for 14
days at 25°C, sclerotia formed were taken, dried at 60°C and weighed.
Amino acids which inhibited the sclerotium formation were additionally mixed at var1ous concentrations
(10-1�10-7 M)
to the basal medium which contains potassium nitrate.The effects of cysteine and serine or homocysteine and homoserine, which have similar structures each other, were compared. Each of the amino acids were additionally given to the basal medium at various concentrations and C-324
was cultured at 25°C for 14 days. Sclerotia formed were weighed as stated above.
The effects of the inhibitory amino acids on mycelial growth was tested.
C-324 isolate was cultured at 25°C for 14 days on amino acid-amended Hopkins
media and then agar was melted. The mycelial mats were taken out with forceps, washed with hot water repeatedly, dried and weighed. When the sclerotia were
-1
0
2-formed, these were separated and only the mycelial weight was measured. The linear mycelial growth was also measured at 24 and 48 hr after inoculation.
Each value is average of 12 dishes and the experiments were repeated 3 times.
Results and Discussion
As shown in Table 27, sclerotia were well formed when the nitrogen source
of Hopkins medium was replaced with various amino acids such as asparagine, aspartic acid, alanine, glutamic acid, serine, arginine and proline. The number of sclerotia formed on the valine, phenylalanine or threonine medium widely
varied with the isolates. Quite few or no sclerotia were formed on the medium
which contained methionine, homocycteine, taurine, cysteine, cystine,
isoleucine, leucine, histidine, tryptophan, tyrosine, homocysteine or glycine.
Plate 6 illustrates some of the features observable in the culture plates. To
examine whether or not these amino acids directly inhibited the sclerotia!
morphogenesis, each of the amino acids was additionally given to the basal medium. As shown in Fig. 16, cysteine, cystine and histidine drastically inhibited the sclerotium formation at the concentrations more than 10--1 M.
Methionine and homocysteine also inhibited the formation at their concentrations above 10-3 M. Distinct inhibition was observed at 10-1 M in taurine. Although
Table 27. The effect �f amino acids on sclerotium formation of R. solan1
Amino acids Isolates
C-14 C-324 C-326
1.-Asn 71. 50+2. 281l) 70. 85+3. 06 51. 60+0. 90
1.-Asp 75. 30+3. 80 73. 75±0. 65 53. 20+4. 50
n�.-Ala 65. 65+ 1. 82 60. 05+3. 63 45. 20+2. 20
1.-Glu 73. 00+5. 49 75. 30+2. 40 25. 35+4. 79
1.-Gly 4. 25+3. 50 9. 40+1.19 1. 25+1. 23
nt.-Ser 18. 30+ 1. 25 37. 50+3. 80 29.10+9. 24
1.-Thr 39. 00+ 1.10 0. 00+0. 00 2.10+1. 21
t.-(Cys)z 3. 25+ 1. 38 0. 00+0. 00 0. 00+0. 00
,,-Cys 0. 00+0. 00 0. 00+0. 00 1. 80+ 1. 51
1.-Met 0. 00+0. 00 0. 00+0. 00 0. 00+0. 00
1.-HomoCys 0. 00+0. 00 0. 00+0. 00 0. 00+0. 00
1.-Tau 0. 00+0. 00 0. 00+0. 00 0. 00+0. 00
1.-Ile 0. 00+0. 00 0. 00+0. 00 0. 00+0. 00
I.-Leu 0. 00+0. 00 0. 00+0. 00 0. 00+0. 00
1.-Val 22. 05+5. 59 3. 30+0. 96 0. 00+0. 00
1.-Arg 49. 35+3. 09 45. 65+4. 75 33. 07+8. 54
1.-Pro 62. 45+3. 28 64. 45+2. 73 35. 32+1.18
1.-His 0. 00+0. 00 0. 00+0. 00 0. 00+0. 00
1.-Phe 12. 50+1. 45 0. 80+0. 77 0. 00+0. 00
1.-Trp 4. 00+2. 08 0.00+0.00 3.15+0. 48
1.-Tyr 0. 00-1-0. 00 0. 00±0. 00 1. 05+1. 44
Control 41. 60+4.19 51. 15+3. 55 34. 45+3. 86 (the basal medium)
a) Average of sclerotia! weight
(mg)
formed in a Petri dish and standard error.-104-
'"'
� • lO
�
�
�
�
•
� 1 o·' 1 o·• 1 o· 1 1 o·• J o·• 1 0"' 1 o·• 1 o· •
� 0 10
�
Q 6
0
�
� 40
� 0
�
1 o· • 1 o·• 1 o· 1 J o·• 1 o·• 1 o· 1
Concentration of amino acid (H)
Fig. 16. The effects of concentration of inhibitory am1no acids on sclerotium formation of R solani.
1 0"1
1 · Cysteine, 2 : Cystine, 3 : Homocysteine, 4 · Methionine, 5 · Taurine, 6 · Histidine, 7 : Leucine.
_....
bO e '-"
...,
...c:::
... bO (1) �
--1
ro
•-I ...,
0 L..
... (1) 0 (11
--4
..., ro 0 E-<
80
60
40
l0-7 lo-" 10-l Io-7 Io-" to-•
Concentration of amino acids (M)
Homocysteine (•) llomoserine (•) Cysteine (A) Serine (o)
r
liz rSII r·OII
lizIl
·r
-Nil:�• :rSllII r·-011
-Nlll*H oo-
-NIIa• II
oo-. -Nil:�+ oo- oo-Fig. 17. The effects of sulfur containing and not containing amino acids on sclerotium formation of R. solani (C-324) as additionally amended Hopkins medium.
no sclerotia were formed when KNOJ was replaced with leucine, sclerotium
formation was observed even at 10-1 M as additional amendment to the basal medium (Table 27, Fig. 16). These results could indicate that leucine is not
inhibitory but unuseful for the sclerotium formation. Since sulfur containing
amino acids severely inhibited the formation, sulfur was considered to be one of the inhibitory agents. As shown in Fig. 17, sulfur-containing amino acids and their respective non-sulfur counter parts which have similar chemical structures
showed differential effects on the sclerotium formation. Especially the
distinctness between cysteine and serine was striking. The inhibition by sulfur- containing amino acids and glutathione on the sclerotium formation have been reported also for S. rolfsi i23>. In the latter case the sclerotium formation was induced by iodoacetic acid, an antagonist of -SH compounds23>. The reason
why histidine was so inhibitory like sulfur containing amino acids is uncertain.
However, the formation of its catabolite ergothioneine, which contains -SH, may explain the results. The 1somers such as D-alanine, D-methionine and D-aspartic
acid were quite inhibitory to the sclerotium formation (Table 28). Although plants contain no D-isomers, 20�60% of organic nitrogen in soil comes from microorganisms and 10�20% of alanine and glutamic acid are D-isomers which could be originated from cell walls of bacteria and actinomycetes. Therefore,
the inhibitory effects of these D-isomers on the sclerotium formationis of
Table 28. The effects of D and L form amino acids as nitrogen source on sclerotium formation of R solani
Isolates Amino acids
C-14 C-324
D-Ala 0. 00+0. ooa> 0. 00+0. 00
L-Ala 72. 04+5.14 68. 82+7.11
D-Asn 0. 00+0. 00 0. 00+0. 00
L-Asn 52. 61 +4. 05 64.17+4. 99
D-Met 0. 00+0. 00 0. 00+0. 00
L-Met 0. 00+0. 00 0. 00+0. 00
n> Average of sclerotia! weight
(mg)
formed in 6 Petri dishesand standard error.
Table 29. The effects of amino acids on linear growth of R. solani•>
Culture periods Media
Basal + Met lo-s
Basal + His 10-5
Basal + Ser lo-s
24 hr
3. 76+0. 24 b) 2. 92+0. 59 1. 86+0. 25
4. 58+0. 22 2. 45+0. 35 2. 30+0.19
4. 05+0. 37 4. 74+0. 72 3. 35+0. 51
Control 4.45+0. 70
(the
basal medium)
•> C-324 isolate from sugar cane was us�
48 hr
5. 90+0. 68 4. 73+0. 81 3.13+0. 25
7. 37+0. 48 4.13+1. 03 3. 40+0. 20
6. 25+0. 29 7. 63+0. 63 8. 00+0. 58 7. 70+0. 47
b) Diameter
(em)
of mycelial mat on agar plate.Table 30. The effect of amino acids on mycelial weight
Media
Basal + Met lo-s 10-3 lo-l
Basal + His lo-s 10-3 10-l
Basal + Ser lo-s lo-J lo-l Control
of R. solani•>
1
2. 35+0. 42 b) 2. 45+0. 67 0. 95+0. 38
2. 97+0. 71 0. 72+0. 27 0. 95+0. 37
2. 86+1.14 5. 38+0. 81 4..10+0. 34
2. 34+0. 33 (the basal medi
urn)
a) C-324 isolate was used.
Culture periods 5
10. 65+5. 07 33. 63+6. 92 37. 37+5. 72
2. 83+0. 43 5. 01 +0. 62 10. 83+ 1. 20
8. 60+ 1.16 25. 90+4. 90 39. 00+6. 33 9. 04+2. 48
b) Weight (mg) of mycelial mat on agar plate.
14 days
12.81 +2.10 11. 04+1.16 31. 75+3. 44
8. 37+ 1. 87 36. 76+4.19 47. 05+3. 81
8. 49+0. 68 7. 42+1. 45 9. 90+ 1. 02 6. 00+0. 45
interest from the ecological point of v1ew .
The linear growth and the mycelial weight on the medium containing the inhibitory amino acids were reduced at first, and finally recovered
(
Table 29,30).
After 14 days, the mycelia had almost the same total weight to thecontrol. It was reported that inhibitory substances to the sclerotia!
poduction reduced and stimulative substances induced the hyphal branching 1n S.
rolfsii55'. Taken together, these results imply that the inhibitory amino acids
only limit the branching in the leading hypha, which in turn results in the inhibition of sclerotia! production.
Part
2.
Developmental process of sclerotium format1.on and 1·ts · h 1n ibition by several amino acidesIn Part 1, the sclerotium formation of R. solani did not take place on the
media with histidine and leucine or sulfur-containing amino acids. Similar observation has been reported in Sclerotium rolfsii23>, where the process of
sclerotium formation was divided into the
3
phases, initiation, development and maturation phases. Inhibitory amino acids were shown to affect on all the3
phases23' !i-1l. In the present study, the morphological processes of the sclerotium formation of R. solani was divided into
5
stages, namely1)
thehypha! branching,
2)
the hyphal aggregation and network formation,3)
theinitial formation,
4)
t he formation of whitish imrnatured sclerotia, and5)
thematuration of pigmented sclerotia (Fig. 18, Plate
6).
The following experiments were done to determine which of the stages 1s
affected by t he inhibitory amino acids.
Materials and Methods
Isolate. An isolate
(C-324)
of the fungus from sugar cane was used 1n thisex per imen t.
Branching, septal formation hypha! aggregation and network formation
I
Granulation and development IMMATURE WHITE SCLEROTIUMI
Pigmentation and further developmentMATURED SCLEROTIUM
'
Fig. 18. Diagramatic representation of sc lerotium formation of R. solani.
Media
PDA was used for preculture of this fungus. To examine the effects of amino acids on the various stages of sclerotia} development, stimulative orinhibitory amino acids were added to the basal medium instead of potassium nitrate.
Test at the hyphal branching.
The fungus was cultured on the amino acid-containing media. When the hyphae were fully developed on the surface of the
media, the length between the points on hyphae where lateral branches were
generated (internodal length) was measured.
Test at the hyphal stage.
The seamless cellulose tubing was opened and cut to squares of5
X5
ern. The membranes were each sheeted on a PDA mediumand mycelial disc
(5
mrn in diarn.) were each centered on the sheets andprecultured at 25"C. To examine the effects of hyphal age on differentiation,
the period of preculture on PDA medium was varied. On 2, 3, 4, 5 and 6th day, each sheet which was covered with mycelia was taken out and transferred onto the
test media. If the initials or sclerotia already appeared at this time, these
places were marked on the reverse side of the Petri dish. After 14 days, sclerotia which were newly formed on unmarked areas were collected, dried at
so· c and weighed.
Test at the initial staga
Cellulose membranes(8
em in diam.) were sheeted on PDA media and the mycelial discs were placed at the centers andcultured for 3�6 days. At 3, 4, 5 and 6th days, the sheets were transferred to
the test media and the initials were marked on the reverse side of a Petri d. h 1 s . After 14 days, sclerotia differentiated from the initials were collected and weighed.
Test at the whitish sclerotium stage. Cellulose membranes
(8
em in diam.)
were sheeted on PDA media and the mycelial discs was placed and precultured for
3�5 days. The areas of immature whitish sclerotia were cut together with the membranes in 1�1.5cm2 pieces and 10 pieces were transferred on to the test medium. After incubation for 14 days, the dry weight of sclerotia was weighed and the degree of pigmentation was compared.
Results and Discussion
The hyphal branching followed by the aggregation and interweaving could be important through the morphological processes of scleroti urn formation 1 1 s>
(
Plate7).
Also in Sclerotium rolfsii55>, inhibitory substances to sclerotiumformation reduced lateral branching, whereas stimulatory substances induced the branching, indicating that the sclerotia! morphogenesis and hyphal branching
were close 1 y related. As shown in Tab le 31 and Plate
8,
methionine andhistidine which were inhibitory to sclerotium formation reduced the lateral
Table 31. The length of branching internodes of R solani on various media
Internodes
(pm)
Media
His Met
143. 30+24. 5b) 100.11 +5. 96
•> KNOa is used as nitrogen source.
Leu Hopkins•>
87. 56+ 11.23 51. 40+ 13.10
b) Average of 200 internodes measured at 72 hr after inoculation.
Table 32. The effects of amino acids on sclerotium differentiation from hyphae
Preculture periods Amino acids
2 3 4 5 6 days
Cys oa> 0 0 0 0
Met 0 0 0 0 0
His 0 0 0 0 0
Leu 3. 75 2.30 3.25 2.90 0
Ser 53.80 22.50 25.65 43.00 37.00
Control 53.20 39.95 27.45 22.85 31.30 (the basal medium)
n> The weight
(mg)
of sclerotia (total weight per dish) differentiated from hyphae on cellulose membrane.-116-
Table 33. The e�f�c�s of amino acids on sclerotium differentiatio
from 1nJt1als n
Amino acids Preculture periods
3 4 5 6 days
Cys 2. so·> 0 0 0
11. 4Qb) 0 0 0
Met 2.80 0 0 0
17.90 0 0 0
His 4.00 6.50 0 0
26.30 4.20 0 0
Leu 6.35 8.85 0 0
20.80 16.00 0 0
Ser 26.80 19.85 8.80 6. 75
44.90 47.00 27.50 15.20
Control 30. 70 25.65 18.20 19.55
(the basal medium) 90. 70 63.60 48.10 23. 70
o) The weight
(rng)
of sclerotia (total weight per dish) differentiated from hypha! aggregates (initials) on cellulose membrane.b) The Ratio
(%)
of sclerotia differentiated from hyphal aggregates.Table 34. The effects of amino acids on sclerotium pigmentation and development from immature whitish sclerotium Amino acids
Cys Met His Leu Ser Asn Control
(the basal medium)
Pigmentation
Light brown Light brown Light brown Brown Dark brown Dark brown Dark brown
Immature whitish sclerotium
Final weight
1.12+0. 21 a) 1. 44+0. 52
2. 06±0. 48 3.12+0. 33 8. 01 +1. 24 11. 66+ 1. 39 3.10+0. 25
0. 86+0. 08
a> Mean dry weight of sclerotia