九州大学学術情報リポジトリ
Kyushu University Institutional Repository
高分子電解質溶液のドナン平衡と浸透圧係数
懸橋, 理枝
九州大学理学研究科化学専攻
https://doi.org/10.11501/3122867
出版情報:Kyushu University, 1996, 博士(理学), 課程博士 バージョン:
権利関係:
Donnan equilibria and the osmotic coefficients in polyelectrolyte solutions
Rie Kakehashi
Faculty of Science Kyushu University
December, 1996
CONTENTS
1. Introduction · · · · · · · · · · · · · · · · · · · · · · · · · · · · · · · · · · · · · · · · · · · · · · · · · · · · · · · · · · · ·1
2. Experimental
2-1. Materials · · · · · · · · · · · · · · · · · · · · · · · · · · · · · · · · · · · · · · · · · · · · · · · · · · · · · · · · · · ·6
2-2. Procedure
2-2-1. The equilibrium dialysis method · · · · · · · · · · · · · · · · · · · · · · · · · · · · · · · · · · · · · 7 2-2-2. The non-equilibrium method · · · · · · · · · · · · · · · · · · · · · · · · · · · · · · · · · · · · · · · · 8 2-2-3. The osmotic pressure measurement · · · · · · · · · · · · · · · · · · · · · · · · · · · · · · · · · · 1 0
3. Results
3-1. Donnan equilibria of uni-univalent (1-1) salts in polyelectrolyte solutions · · · · · · · 10 3-2. Salt exclusion parameters for NaPA/NaCl, NaPSS/NaCl, PMET AC/NaCl, and PAAm/NaCl· · · · · · · · · · · · · · · · · · · · · · · · · · · · · · · · · · · · · · · · · · · · · · · · · · · · · · · · · · · · ·14 3-3. Salt exclusion parameters for NaPSS/NaNCS · · · · · · · · · · · · · · · · · · · · · · · · · · · · · ·22 3-4. Salt exclusion parameters for PA (a=0.3, 0.5, 0.8, and 1)/NaCl · · · · · · · · · · · · · · · ·22 3-5. Donnan equilibria of a 1-2 salt in polyelectrolyte solutions (NaP A/Na2S04 and NaPSS/Na2S04) · · · · · · · · · · · · · · · · · · · · · · · · · · · · · · · · · · · · · · · · · · · · · · · · · · · · · ·27 3-6. The estimation of mean activity coefficients of salts in polyelectrolyte solutions ( NaPA/NaCl, NaPSS/NaCl, PMETAC/NaCl, PAAm/NaCl, NaPSS/NaNCS, PA(a=0.3, 0.5, 0.8, and 1)/NaCl, NaP A/Na2S04 and NaPSS/Na2S04) · · · · · · · · · · · · · · · · · · · · · · · · · · · ·31 3-7. Osmotic pressure in polyelectrolyte solutions without added salt (NaPA ( a=O. 9 and 1 ), NaPSS, PMETAC, PAAm, and PVB (a=0.9)) · · · · · · · · · · · · · · · · · · · · · · · · · · · · · · · · · 36
3-8. Osmotic coefficients of polyelectrolyte solutions and their low-molecular weight analogs ( NaES, MAHCl, EAHCl, and TMACl) · · · · · · 42
4. Discussion
4-1. Donnan equilibria in polyelectrolyte solutions
4-1-1. Polyion species dependence of the parameter k · · · · · · · · · · · · · · · · · · · -46 4-1-2. Co-ion species dependence of the parameter k · · · · · · · · · -46 4-1-3. The charge density dependence of the parameter k · · · · · · · · · · · · · · · 47 4-2. The relation between the parameter k and the osmotic coefficient in polyelectrolyte
solutions without added salt · · · · · · · · · · · · · · · · · · · · · · -49 4-3. Mean activity coefficients of salts in polyelectrolyte solutions· · · · · · · · · · · · · ·54 4-4. Osmotic coefficients in polyelectrolyte solutions without added salt · · · · · · · 60 5. Conclusion· · · · · · · · · · · · · · · · · · · · · · · · · · · · · · · · · · ·61 Appendix·· · · · · · · · · · · · · · · · · · · · · · · · · · · · · · · · 63 References· · · · · · · · · · · · · · · · · · · · · · · · · · · · · · · 73 Acknowledgment
1. Introduction
Interactions of polyions with small ions have been reasonably understood on the basis of Manning's limiting law (LL)1 or the Poisson-Boltzmann (P-B) approach.2-12
According to the LL, thermodynamic properties, such as the osmotic coefficients in salt-free polyelectrolyte solutions and the salt exclusion parameter, could be estimated solely from a line charge density paratneter in dilute solutions. Recently, however, it has been found that those thermodynamic properties were influenced by the chemical structures of polymers or the flexibility of polymer skeletons.13 It is valuable to study the relation between those thermodynamic properties and chemical structures of poly electrolytes.
To evaluate the Donnan osmotic pressure on the basis of the additivity, we need to know the distribution of salt across a semipermeable tnembrane and the osmotic coefficient in the salt-free polyelectrolyte solution. The Donnan distribution of salt has been studied over tnany years.14-22 The distribution under the condition of excess salt has been rather well understood.1'3'4'22 However, to understand the swelling of ionic gels at low ionic strengths, it is desirable to examine the salt distribution in the range of excess polyelectrolyte. Theoretical prediction in this range has not been developed.
The validity of the additivity rule for the osmotic pressures of the polyelectrolyte solutions with added salt was shown on the basis of the LL 1 and the Poisson- Boltzmann approach. 2 The Donnan osmotic pressure n0 based on the additivity rule is as follows
(1-1)
where nP and ne denote the polymer and the counterion concentrations, and ns and ns'
represent the salt concentrations of the solutions with and without polyelectrolyte.
Within the framework of the LL 1, however, the sum of the second and the third terms on the rhs equals zero. That is to say, the counterion contribution and the Donnan salt distribution compensate each other. The extension of the LL to the excess salt condition has been done on the cylindrical Poisson-Boltzmann cell tnodel and the correction terms to those of LL 3'4 have been given for both the osmotic coefficient and the Donnan salt distribution as follows.
To=
( 2�*-�*2+cr ) I ( 4�) (�*<1) andTo=
(1+cr) I ( 4�) (�*> 1) (1-2)(1-3)
where
To
is the Donnan salt exclusion factor defined as(m5'-m5)lme
in the limit asme
approaches 0, � is defined in tenns of the Bjerrum length
!8
and the separation of chargesb
along the polymer chain asl81b.
The effective reduced axial charge density of the cylinder,�*, is defined as a*�. A fraction (1-a*) of the polyion charge may be compensated by closely associated counterions (O<a*<1). A parameter cr is defined as follows,cr = Sa -limSa
A't/ 0 (1-4)
(1-5) where Xa * is defined as Ka,
(1-6)
and Ya is defined as
I
elf1kTi
at a distance frotn the polyion axis r = a (the polyion radius). The equality n5'= n5 R will hold at any electrolyte concentration if it can be assumed that the nonideality arising from interactions among small ions in the vicinity of the cell boundary is identical to that in a solution containing no polyions.When eqns
(1-2)
and(1-3)
are introduced into eqn(1-1),
we have obtained again(1-7)
since the correction terms cancel out. It is obvious that the LL and its extension have enumerated the free energy up to the order of nP. Actual osmotic pressures of polyelectrolyte solution always contain the contribution for the second virial term, i. e.
The osmotic coefficient in the salt-free polyelectrolyte solution is a significant measure of the polyion-counterion interaction. the osmotic coefficients have been reported and found to increase with the concentration. 23-31 In the dilute region, osmotic pressures of salt-free polyelectrolyte solutions have been understood due to the counterion contribution in terms of the LL 1 or the P-B approach.32 On the other hand, the scaling theory in semidilute solution has been extended to polyelectrolyte, 33-37 and the ostnotic pressures were sometimes explained due to polymer contribution. 38·39 Odijk's theory38 evaluates only the polymer contribution. According to his theory, osmotic pressures without added salt were described as
(1-8)
where
c;con b,
and c represent the correlation length, the separation of charges along the polymer chain, and the monomer concentration respectively. Equation( 1-8)
predicts. . . h 9/8
that osmotic pressures Increase w1t c .
Generally, the osmotic pressures in semidilute polyelectrolyte solutions without added salt should be approximately described as follows.
(1-9)
Dubrynin et al. has proposed eqn
( 1-1 0)37
Jr I kT �ciA +
Ilc;co/ (1-10)
where A denotes the average number of monomers between effective charges. The term, ciA, corresponds to the uncondensed (free) counterion concentration. The correlation length
c;cor
is defined as (B lc d) 112, where parameters Band d represent the ratio of the chain contour length to the actual extended size and the monomer length.The first and the second terms on the rhs of eqn
( 1-1 0)
represent the counterion contribution and the polymer contribution, respectively. Dubrynin et al. 37 have shown that the latter term in eqn( 1 -1 0)
is negligible and hence the counterion contribution dominates over the polymer contribution. Thus osmotic pressures of polyelectrolyte solutions without added salt increase with c unless the term A depends on c. It is important to examine the concentration dependence of the osmotic coefficients in salt-free polyelectrolyte solutions.In the present study, first, the Donnan salt distribution is examined in the range of excess polyelectrolyte for four polyelectrolytes, sodium polyacrylate (NaPA), sodium polystyrenesulfonate (NaPSS), poly(2-methacryloxyethltrimethylammonium) chloride (PMETAC), and polyallylamine hydrochloride (PAAm) in the presence of NaCI or Na2S04 by equilibrium dialysis and non-equilibrium methods. The effect of NCS-
locating at the opposite positions to S04 2-in the Hofmeister's series was also examined for NaPSS and the result is compared with the results on Cr and S042-. For partially neutralized polyacrylate (PA), the Donnan distribution of NaCl was examined at differing polyelectrolyte charge densities.
Second, we evaluated the tnean activity coefficients on the basis of these Donnan salt distribution data. Mean activity coefficients of salts in polyelectrolyte solutions are an important measure of the interactions of polyions with small ions. Observed mean activity coefficients were compared with predicted values from the LL. While stnall ion - small ion interactions are not taken into account in the LL, or these contributions are assumed to be approximately same in both the polyelectrolyte solution and the salt solution, their contribution is involved in the observed values. The excess free energy arising from the stnall ion-small ion interactions was added to that from polyion-small ion interaction to evaluate the activity coefficient of small ions. According to the treatment by Wells, 40 we approximated the contribution from small ion-small ion interaction with the mean activity coefficient in a pure salt solution at the salt concentration ms found in the polyelectrolyte solution. The validity of this procedure was exatnined.
Finally, we reported the osmotic pressures of solutions of poly
(2-
methacryloxyethyltrimethylammonium) chloride (PMETAC), polyally !amine hydrochloride (P AAm), sodium polystyrenesulfonate (NaPSS), sodium polyacrylate (NaPA; the degree of ionization
a=l),
partially neutralized polyacrylic acid (PA;a=0.9),
and partially neutralized polyvinylbenzoic acid (PVB;a=0.9).
Polymersamples other than PVB and PA (a=0.9) have the same charge densities a= l .O. The polymer concentration dependence of the osmotic pressures in semidilute solutions is discussed in terms of both the scaling theory38 and the Poisson-Boltzmann approach.32
In order to study the relation between the chemical structures of the ionic moiety and the osmotic coefficients in polyelectrolyte solutions, the osmotic coefficients were determined for some monomer analogues to the polymers examined, such as tetramethylammonium chloride (TMACl), methylamine hydrochloride (MAHCI), ethylamine hydrochloride (EAHCl), and sodium ethansulfonate (NaES).
2. Experimental
2-1. Materials
Polyacrylic acid (PA) was purchased from Toa Gosei Kagaku Co. and dialyzed against pure water. PA were neutralized with NaOH.
NaPSS was purchased from Polyscience, Inc. Low molecular weight materials were removed by ultrafiltration using a membrane (ADV ANTEC Q2000).
2-methacryloxyethltrimethylammonium chloride (METAC) in 50 % aqueous solution was purchased from Polyscience, Inc. Ammonium persulfate and sodium chloride were purchased from Nacalai Tesque, Inc. and Katayama Chemical Co., respectively. Polymer was prepared by free-radical solution polymerization. 70mmol of METAC, 40mmol of ammonium persulfate and 50mmol NaCl were dissolved in 1 OOml of water. The solution was degassed and polymerization was carried out in a
container at 60 oC for 3 hours, followed by the precipitation of the polymer with
acetone. Precipitates were resolved in water. Low tnolecular weight materials were removed by ultrafiltration using a membrane (ADV ANTEC QO 1 00).
Polyallylamine hydrochloride (P AAm) purchased from Nitto Boseki Co. Ltd. was purified by the same method as described. 41
Sodium polyvinylbenzoate (NaPVB) was kindly supplied by Dr. M. Kawaguchi of Toyohashi University of Technology. Polyvinylbenzoic acids (PVB) were precipitated by adding HCl to NaPVB solution offered. The low molecular salts were removed from the polymer precipitates by repeated centrifugation, followed by drying under reduced pressure to constant weight. PVB was neutralized with NaOH.
The polymer concentrations were determined using Farjans method for PM TAC and pH titration for PAAm, PA and NaPSS.
Methylatnine hydrochloride and tetramethylatnmoniutn chloride were frotn Kanto Chemical Co., Inc. Ethylamine hydrochloride and sodium ethansulfonate were from Tokyo Kasei and Aldrich Co., respectively. All salts were reagent grade and were used without further purification.
2-2. Procedure
We have determined the Donnan salt distribution by the following two methods.
2-2-1. The equilibrium dialysis method
In the equilibrium dialysis, the two solutions under Donnan equilibrium separated by a semipermeable membrane (Viskase Sales Co.) were analyzed. The salt concentration of the inner solution m5 and the outer solution m5' were determined by potentiometry
using a silver/silver chloride electrode for NaCl or by the electric conductance for Na2S04. The calibration curves for the inner solution were obtained in the presence of the polyelectrolyte. The polyelectrolyte concentrations for calibration were satne as in the dialysis experiments. Little or no difference in the calibration curves was observed in the presence or absence of polyelectrolyte in the potentiometry. Possible interaction of Ag+ ions (or Ag/ AgCl electrode) with poly ions was thus shown to be negligible for both PA and PSS. For the conductimetry, a constant difference was observed between the two solutions.
2-2-2. The non-equilibrium method
In the non-equilibrium tnethod introduced by Vink,20'21 the following cell was constructed:
Ag I AgCll polyelectrolyte (me) + NaCl(m5):: NaCl(m5') IAgCl I Ag
The emf of the cell E is given as follows in terms of the activities of NaCl in each compartment aNaCJ and the transference number
t
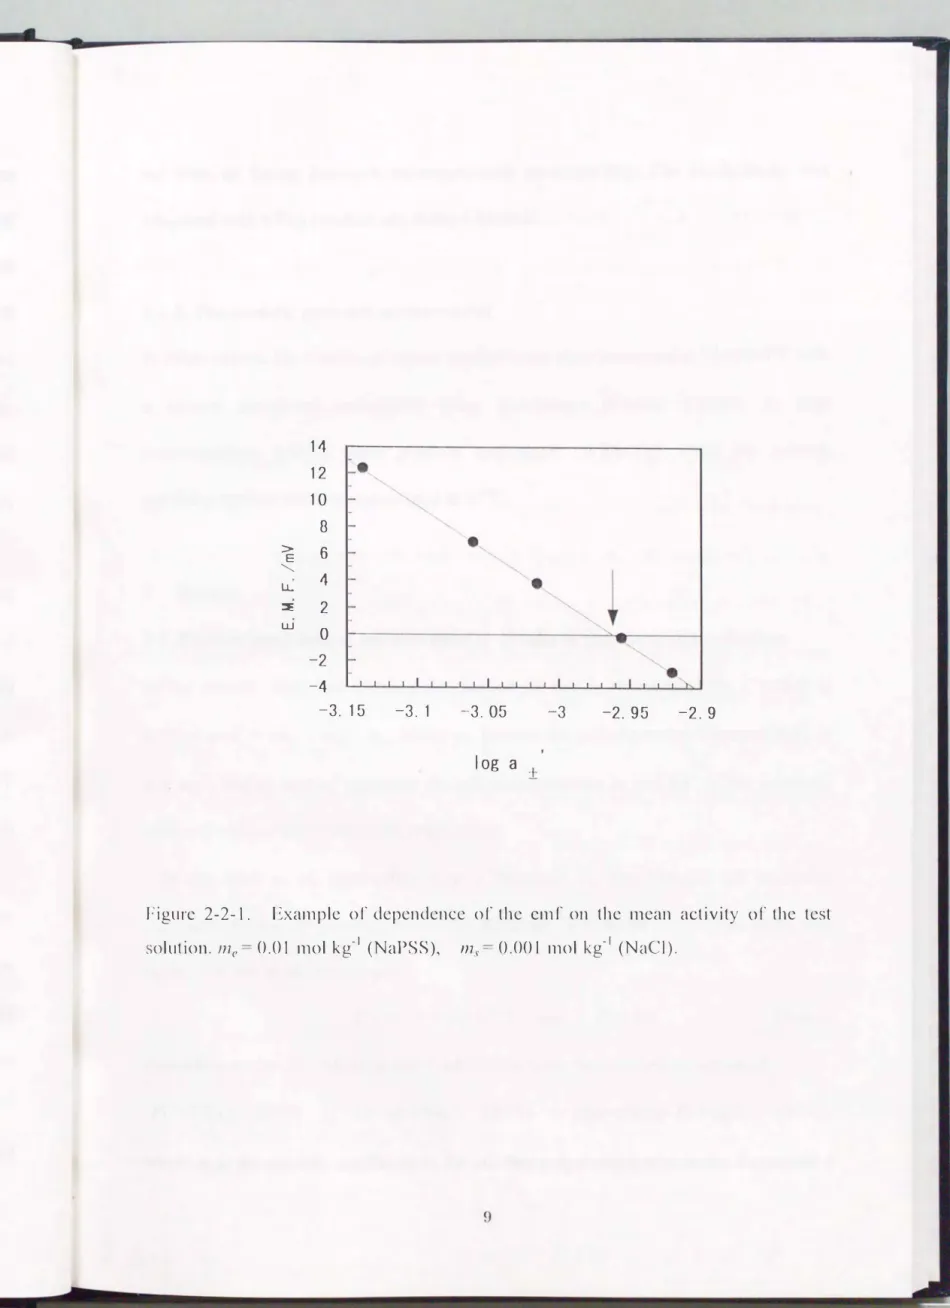
of Na + ions:(2-2-1) The etnf of the cell was measured as a function of m5' at a constant composition (me, ms) of the polyelectrolyte cotnpartment. The activity which gave zero emf was obtained by interpolation as shown in Fig. 2-2-1. From the value of this activity ms' was evaluated. This value of m5' corresponded to the equilibrium value.
The emf was measured with an ADV ANTEST R8240 digital electrometer.
Determination of the salt concentrations in the equilibrium dialysis method was carried
14 12 10
8
> E 6
...___
lJ.. 4
::E 2
w 0
-2
-4
-3. 15 -3. 1 -3.05
log a
-3
±
-2. 95 -2. 9
Figure 2-2-1. Exatnple or dependence or the etnr on the tnean activity or the test solution. 1ne = 0.0 l tnol kg-1 (NaPSS), m ... = 0.001 tnol kg-1 (NaCI).
out with an Orion Research microprocessor ionalyzerl90 1. The conductivity was measured with a Toa conductivity meter CM-60V.
2-2-3. The osmotic pressure measurement
In dilute region, the osmotic pressures against water were tneasured at 35 .0±0.4°C with a Knauer membrane osmometer using membranes (Knauer Y1244). At high concentrations, with a vapor pressure osmometer (WESCOR 5500) the osmotic pressures against water was measured at 37°C.
3. Results
3-1. Donnan equilibria of uni-univalent (1-1) salts in polyelectrolyte solutions
In the present study the Donnan distribution of salt is represented by T which ts defined as T= (
ms' - ms)
I me, where me denotes the polyelectrolyte concentration in mol kg-1, and ms and ms' represent the salt concentrations in mol kg-1 of the solutions with and without polyelectrolyte, respectively.In the limit as me approaches zero, r becomes T0, the Donnan salt exclusion parameter frequently encountered in the literature. We define x and y as mel ms and ms'lms. For the ideal Donnan case,
r= 1/
{
1 + (x+ 1)112} and To= 1/2According to the LL 1, which is expected to hold when both me and ms are small,
(3-1-1)
IQ=112(1-112�) (�<1) or11(4�) (�>1) or equivalentlyiQ=¢J2 (3-1-2) where ¢P is the osmotic coefficient in the salt- free polyelectrolyte solution. Parameter �
is defined in terms of the Bjerrutn length
!8
and the separation of chargesb
along the polymer chain as c; =l81b.
In this study, c; is taken as 2.85 for NaPA (a= 1), NaPSS,PMETAC, and P AAm. Devore and Manning 42 presented an extended analysis for the Donnan salt exclusion as follows,
r= [(x+ 1)112exp
{-�(x+2Y112}
-1]I
Xand r= [( c; -lx+ 1 )112 exp
{
-c; -IX(
c; -lx+2Y112}
-1]I
X(c;<I)
(c;>1) (3-1-3)
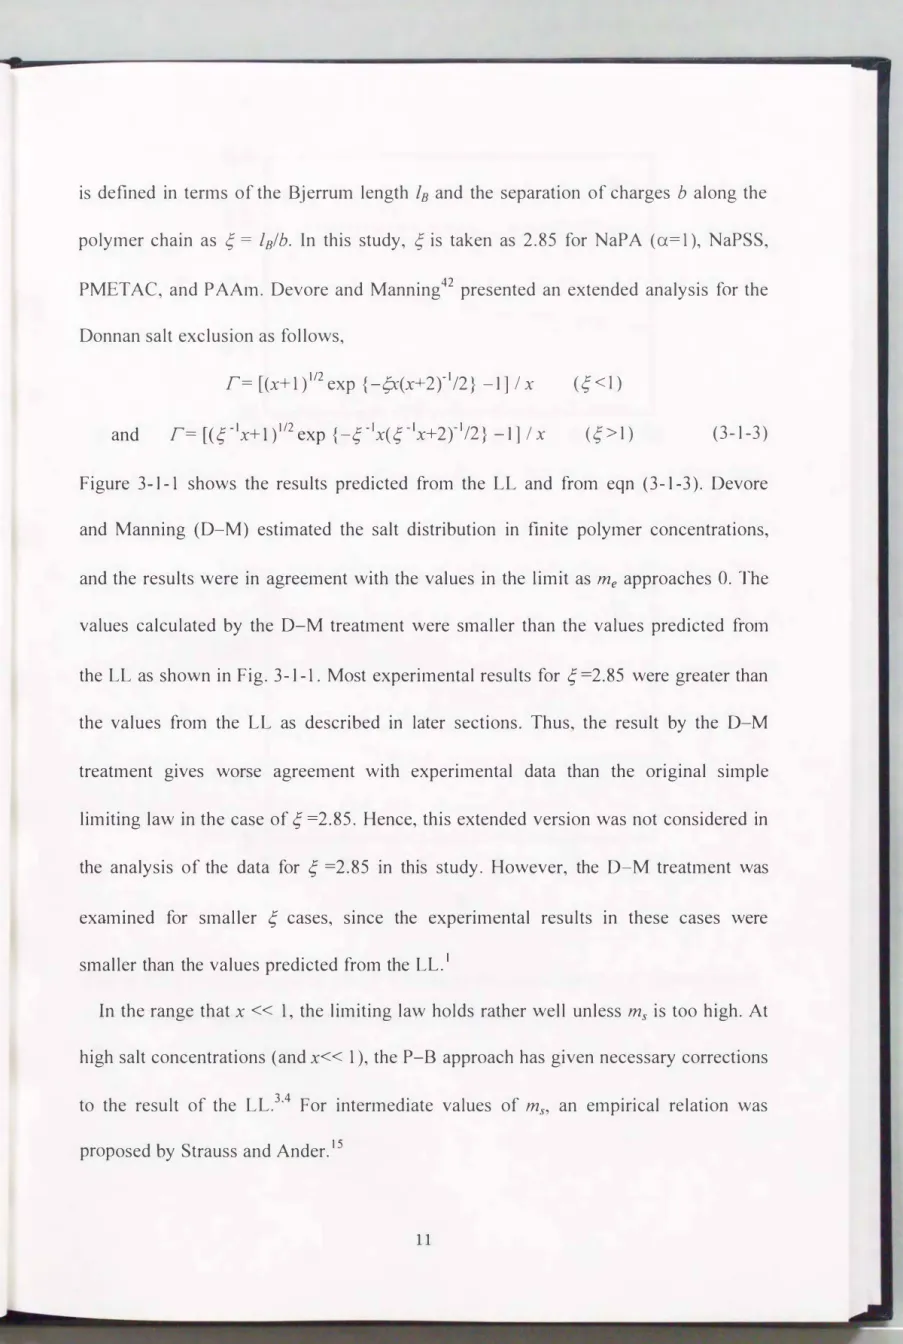
Figure 3-1- 1 shows the results predicted from the LL and from eqn (3-1-3). Devore and Manning (D-M) estimated the salt distribution in finite polymer concentrations, and the results were in agreement with the values in the limit as me approaches 0. The values calculated by the D-M treatment were stnaller than the values predicted from the LL as shown in Fig. 3-1- 1. Most experimental results for c;=2.85 were greater than the values from the LL as described in later sections. Thus, the result by the D-M treatment gives worse agreement with experimental data than the original simple limiting law in the case of c; =2.85. Hence, this extended version was not considered in the analysis of the data for c; =2.85 in this study. However, the D-M treatment was examined for smaller c; cases, since the experimental results in these cases were smaller than the values predicted from the LL.1
In the range that x << 1, the limiting law holds rather well unless ms is too high. At high salt concentrations (and x<< 1), the P-B approach has given necessary corrections to the result of the LL. 3,4 For intermediate values of ms, an empirical relation was proposed by Strauss and Ander. 15
r
r
0.4
0.3 f-
\
\
0.2 -
f- f-
0.1 f-1--
f-
0 0
0.2 0.15 f-
0.1 -
\ '
' '
' ',
I I I
''• ...
...
0.05 -
0 0
...
...
I
2
...
... ...
I
4
.. ...
... ...
...
X
a
...
...
...
I I I I I
6 8 10
b
··••••••••··•··•··•·•···••·•··•·•·•···
I I I I
2 4 6 8 10
X
Figure 3-1-1. Comparison ofeqn (3-1-2) (solid lines) and eqn (3-1-3) (dotted lines)
for the Donnan salt exclusion parameter
T(a) c;=0.855. (b) c;=2.85.
In the range x >
I,
however, little has been elucidated up to now. Swelling of ionic gels is quite often related to the behavior in this range of x. Several phenotnenological relations have been proposed to describe the Donnan distribution in the range of x greater than unity.14'20'21 Alexandrowicz proposed eqn(3-I-4)
in terms of ¢p.14which is rewritten as
Tx
+ I = [I + c/JpX
] 112(3-I-4)
(3-I-5)
In the limit when x approaches zero, eqn
(3-I-5)
gives the limiting law resultlQ =
¢,)2.In this study, we analyze the data in terms of eqn
(3-1-6),
which is a modification of eqn(3-I-5)
proposed by Vink?0•21Tx
+I= [1 +
kx]112 or T= k I[I+ (I+
kx)112](3-I-6)
Since ¢P depends on me, parameter k in eqn
(3-I-6)
may depend on me, although in Vink's relation k is assumed to be a constant independent of both me and m5• In termsof y, eqn
(3-1-6)
is rewritten asy 2
-I=
kx(3-1-7)
Evaluation of k was carried out from the slope of a (y2
-I)
vs. x plot.When kx<<
1,
eqn(3-I-6)
reduces to eqn(3-I-8).
r=
2k/(4 +
kx)(3-I-8)
Equation
(3-I-8)
can be derived from the empirical formula for the osmotic pressure given by Dubrynin et al. 37 when combined with the additivity rule.The excluded volutne contribution r( excl) has been given as B ms' .43 When the
contribution is added to eqn
(
3-1
-6)
, we haver
= [ ( 1
+kx)
I 12 -1]
I X + Bms' (3-1-9)
3-2. Salt exclusion parameters for NaP A/NaCI, NaPSS/NaCI, PMET AC/NaCI, and PAAm/NaCI
3-2-1. NaPA/NaCI
We have determined the Donnan distribution of NaCl in NaPA solutions at three polymer concentrations,
me= 0.001, 0.01,
and0.10
mol kg-1• Figure 3-2-1 shows T values as functions of x. In the experiments shown in Figs.3-2-1
(a)-( c),ms
was varied andme
kept constant. Results obtained from the equilibrium dialysis and those from the non-equilibrium method are represented with open and filled circles, respectively.Consistent results were obtained between the two methods. At a low polymer concentration
(me=0.001),
r can be well approximated as a constant value of0.088
which is the result from the LL. At
me=O.O 1,
a slight deviation from the LL and at the satne time a weak x-dependence are both significant. Atme=O
.10,
r decreased from ca.0.12
atx=1 to ca.0.09
atx=6.3.The results at
me=0.001
and0.01
can be described by eqn(3-1-6)
as shown in Fig. 3-2-1
withk (±0.02)
values of0.20
and0.22,
respectively. Atme=0.1,
the observed xdependence cannot be described by eqn (3-1-6), deviations occur for x > 5 if
k=0.26
and for x < 3 if
k=0.22.
The deviation of the observed x-dependence atme=0.1 0
can most likely be ascribed to the excluded volume effect. The contribution r( excl) is proportional toms.
0.16 0.16
0.12 0.12
r 0.08 r o.o8
0.04
a
0.04
0 0
�������������0 1 2
0.16 0.12 r o.o8 0.04 0
0 1 2
3 X
3 X
4
54
6
7c
5
6
0 1 2
34
X
0.16
0 12
. f- •··· ···-•···•···-·-···r o.o8
f-0.04
f-0
I I0 1 2
I
3 X
I
4
d
I
5
Figure
3-2-1.
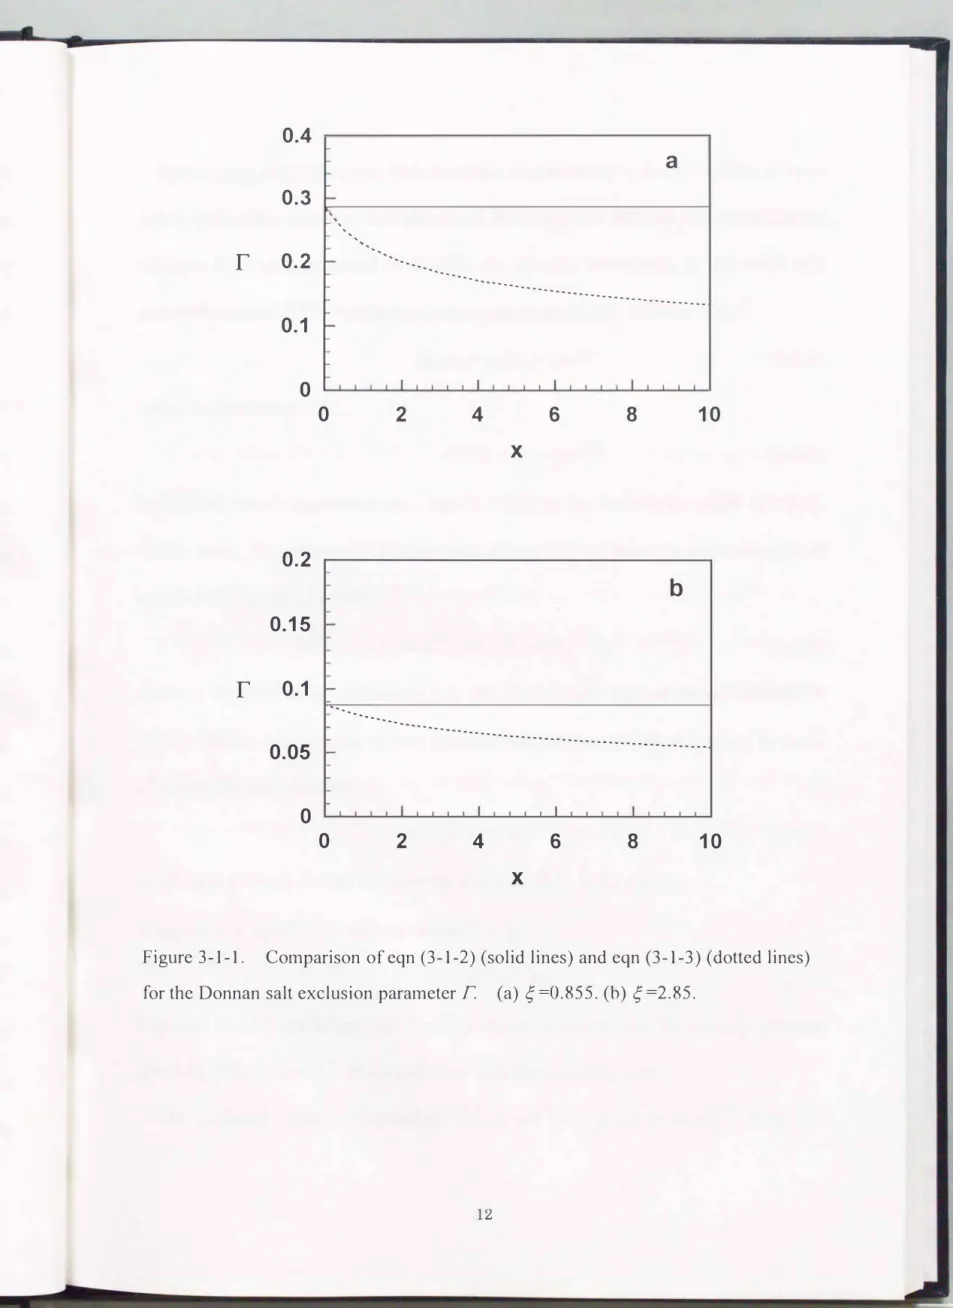
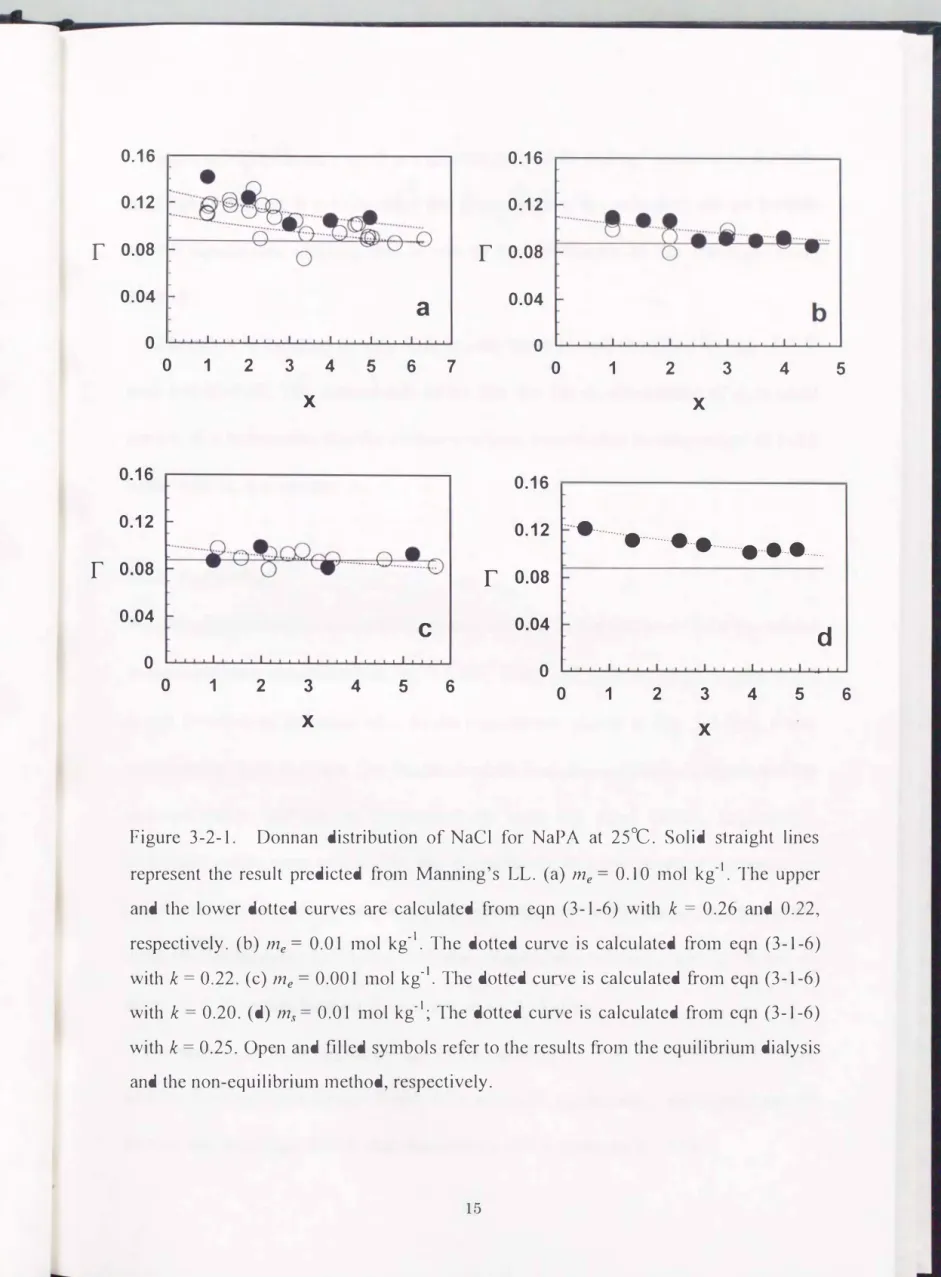
Donnan distribution of NaCl for NaPA at25°C.
Solid straight lines represent the result predicted fro1n Manning's LL. (a) me=0.10
tnol kg-1• The upper and the lower dotted curves are calculated from eqn(3-1-6)
with k =0.26
and0.22,
respectively. (b) me=
0.01
mol kg-1• The dotted curve is calculated from eqn(3-1-6)
with k =
0.22.
(c) me=0.001
mol kg-1• The dotted curve is calculated fro1n eqn(3-1-6)
with k =
0.20.
(d) ms =0.01
mol kg-1; The dotted curve is calculated from eqn(3-1-6)
with k =
0.25.
Open and filled sytnbols refer to the results frotn the equilibrium dialysis and the non-equilibrium tnethod, respectively.5
6
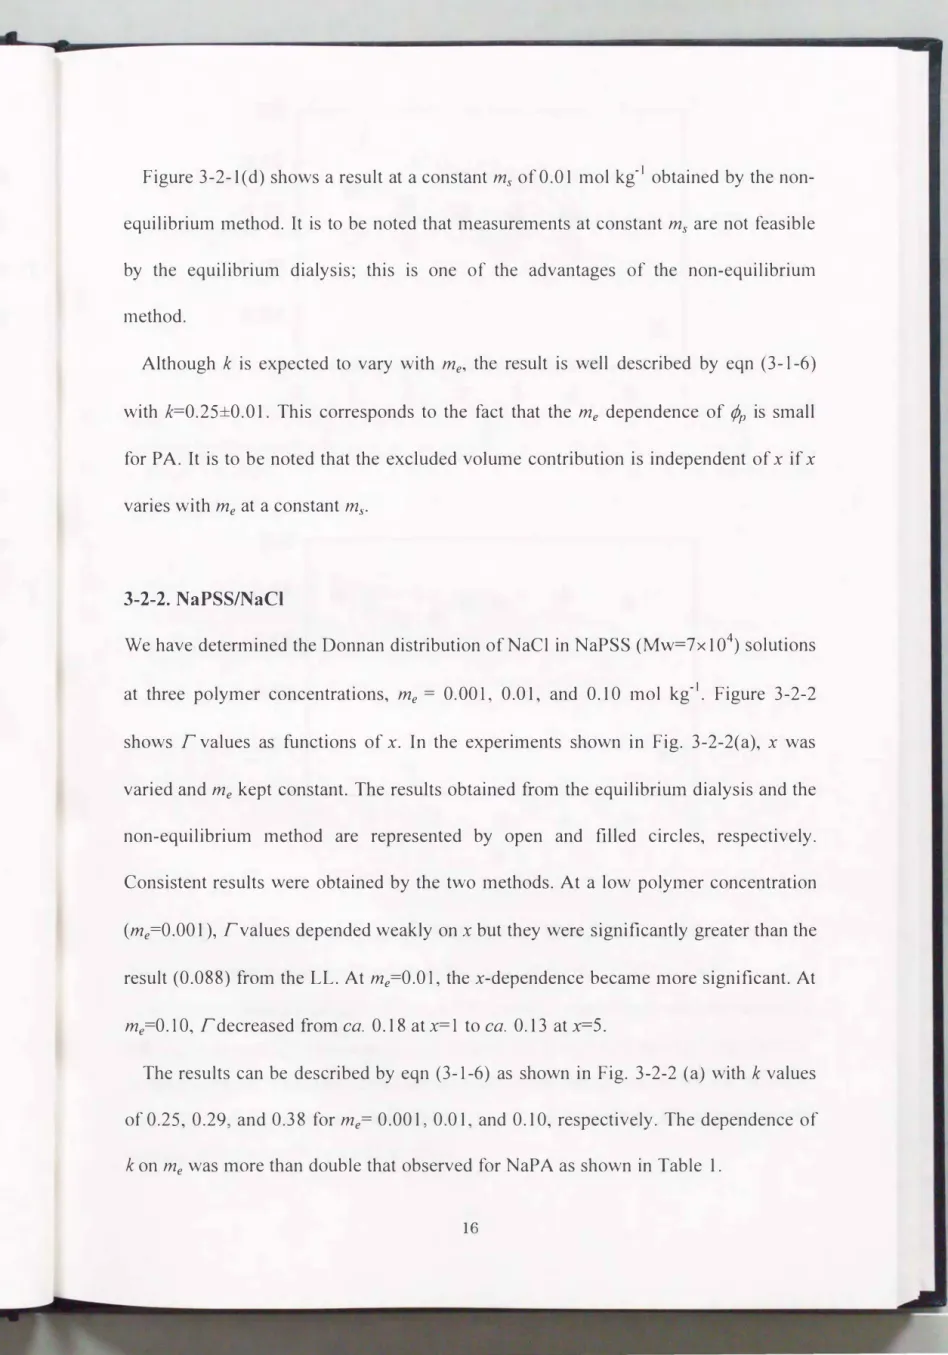
Figure 3-2-1 (d) shows a result at a constant
ms
of 0.01 mol kg-1 obtained by the nonequilibrium method. It is to be noted that measurements at constant
ms
are not feasible by the equilibrium dialysis; this is one of the advantages of the non-equilibriutn tnethod.Although k is expected to vary with
me,
the result is well described by eqn (3-1-6) with k=0.25±0.0 1. This corresponds to the fact that theme
dependence of¢P
is smallfor P A. It is to be noted that the excluded volume contribution is independent of x if x varies with
me
at a constant m5•3-2-2. NaPSS/NaCI
We have determined the Donnan distribution ofNaCl in NaPSS (Mw=7x10⁴) solutions at three polymer concentrations,
me =
0.001, 0.01, and 0.10 mol kg-1• Figure 3-2-2 shows r values as functions of x. In the experiments shown in Fig. 3-2-2(a), x was varied andme
kept constant. The results obtained from the equilibrium dialysis and the non-equilibrium method are represented by open and filled circles, respectively.Consistent results were obtained by the two methods. At a low polymer concentration
(me=O.OO
1 ), Tvalues depended weakly onx
but they were significantly greater than the result (0.088) from the LL. Atme=O.O I,
the x-dependence became more significant. Atme=0.10,
Tdecreased from ca. 0.18 atx=1
to ca. 0.13 at x=S.The results can be described by eqn (3-1-6) as shown in Fig. 3-2-2 (a) with k values of 0.25, 0.29 and 0.38 for
me=
0.001 0.01, and 0.10, respectively. The dependence of k onme
was more than double that observed for NaPA as shown in Table 1.r
r
0.2 .---.
0.16 I-
0.12 I- 0.08 I-
0.04 I-
0 0
0.2 0.16 I- 0.12 I- 0.08 t- 0.04 I-
0 0
§ rnLo ...
•.. ··· a ··· · D-en··· .... . �
o··· ··· � ···· t! tiA �
L....:ih··o
I I I I I I
1 2 3 4 5 6
X
•··· + •···•···•···•···· + +
I I I I I
1 2 3 4 5
X
a
7
b
6
Figure
3-2-2.
Donnan distribution ofNaCl for NaPSS at25°C.
The solid straight lines represent the result predicted frotn the LL. (a)(6)
me=0.001
mol kg-1(equilibrium dialysis method);
(0)
me=0.01
mol kg-1 (equilibrium dialysis method);(e)
me=0.01 mol kg-1 (non-equilibrium tnethod);(D)
me=0.10
mol kg-1 (equilibrium dialysis method). The three curves are calculated from eqn(3-1-6)
with k =0.38, 0.29
and 0.25, from top to bottom, respectively. (b) ms =
0.01
tnol kg-1; the dotted curve is calculated frotn eqn(3-1-6)
with k =0.35.
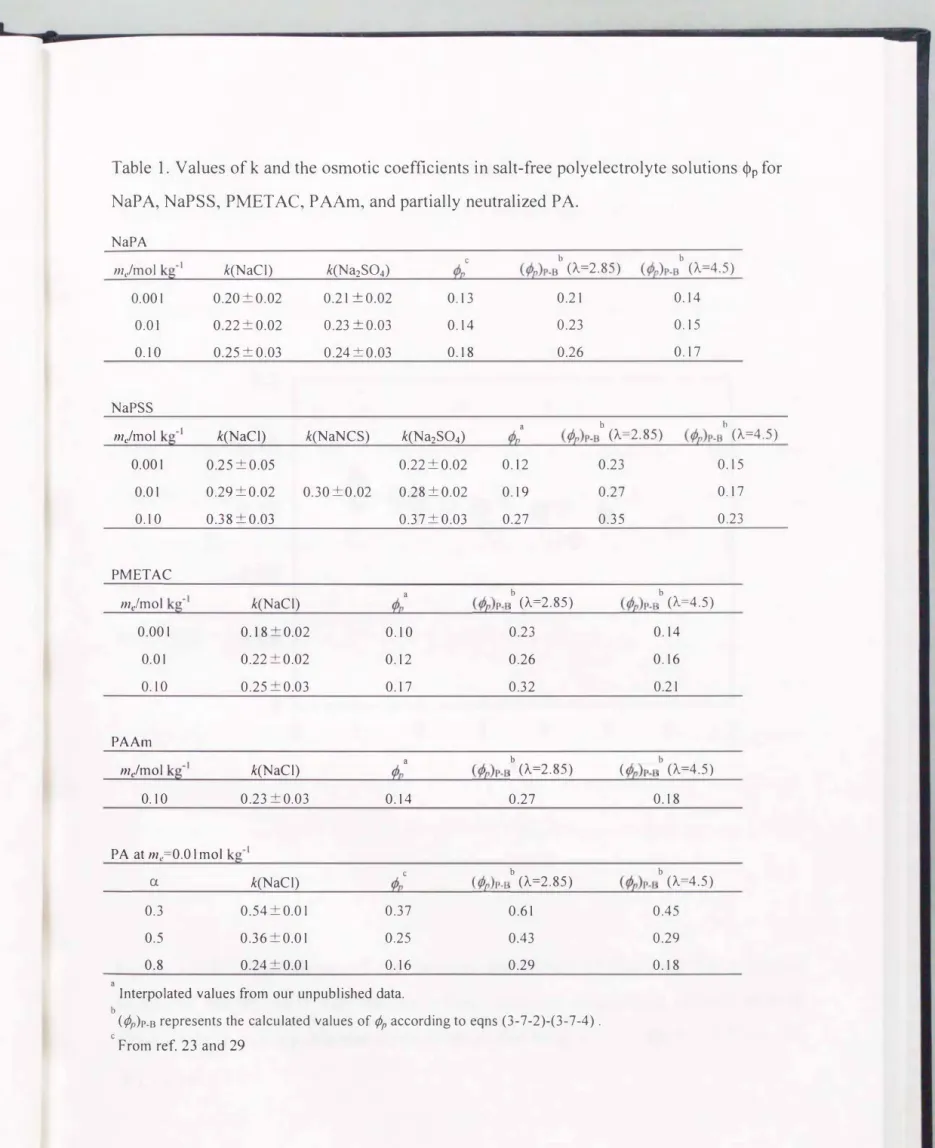
Table 1. Values of k and the osmotic coefficients in salt-free polyelectrolyte solutions �P for NaP A, NaPSS, PMET AC, P AAm, and partially neutralized P A.
NaPA
b b
me/mol kg-l k(NaCl) k(Na2S04) �(2
c
(¢e)P-B (A=2.85) (¢e)P-B (A=4.5)
0.001 0.20±0.02 0.21 ±0.02 0.13 0.21 0.14
0.01 0.22±0.02 0.23 ±0.03 0.14 0.23 0.15
0.10 0.25±0.03 0.24±0.03 0.18 0.26 0.17
NaPSS
b b
me/mol kg-l k(NaCl) k(NaNCS) k(Na2S04) �(2 a (¢e)P-B (A=2.85) (¢e)P-B (A=4.5)
0.001 0.25 ±0.05 0.22±0.02
0.01 0.29±0.02 0.30±0.02 0.28±0.02
0.10 0.38±0.03 0.37±0.03
PMETAC
mefmol kg-1 k(NaCl) ¢n a
0.001 0.18±0.02 0.10
0.01 0.22±0.02 0.12
0.10 0.25 ±0.03 0.17
PAAm
me/mol kg-l k(NaCl) ¢e a
0.10 0.23 ±0.03 0.14
PA at me=0.01mol kg-1
c
a k(NaCl) ¢n
0.3 0.54±0.01 0.37
0.5 0.36±0.01 0.25
0.8 0.24±0.01 0.16
a
Interpolated values from our unpublished data.
b
0.12 0.19 0.27
b
(¢e)P-B (A=2.85)
0.23 0.26 0.32
b
(¢e)P-B (A=2.85)
0.27
b
(¢p)P-B (A=2.85)
0.61 0.43 0.29
0.23 0.27 0.35
b
C¢e)P-B (A-=4.5)
0.14 0.16 0.21
b
( ¢e)P-B (A=4.5)
0.18
b
(¢p)P-B (A=4.5)
0.45 0.29 0.18
(¢p)P-B represents the calculated values of ¢P according to eqns (3-7-2)-(3-7-4).
c
From ref. 23 and 29
0.15 0.17 0.23
0.2 0.16 -
0.12
f-r 0
0.08
t-0.04
�0
I I I I I I0 1 2 3 4 5 6 7
X
Figure 3-2-3. Dependence of the Donnan distribution of NaCl on the tnolecular weight of NaPSS. me= 0.01 mol kg-1• Open sytnbols: equilibrium dialysis method;
filled symbols: non-equilibriutn method. Molecular weights:
(0, e)
7 x 10⁴ and (\7,T)
5 X 105.A result at a constant
ms
of0.01
mol kg-1 obtained by the non-equilibrium method is also shown in Fig. 3-2-2(b ). The result is approximately independent of x. For PSS, k is expected to increase withme
just as�P
does. This gives a positive x-dependence of r and compensates to a considerable extent the negative x dependence inherent to eqn (3- 1-6).Results on another sample of a different molecular weight
(5
x1 05)
were cotnpared in Fig. 3-2-3. The values of k of these two samples were identical within experimental errors as shown in Table1.
Values of r were also similar. The effect of molecular weight was thus shown to be insignificant in the examined range.3-2-3. PMETAC/NaCI
We have determined the Donnan distribution of NaCl in PMETAC solutions at three polymer concentrations,
me =0.001, 0.01,
and0.10
mol kg-1• In Fig. 3-2-4, rvalues are shown as functions of x. Atme=O .001,
r values depended on x and they were smaller than the result from the LL for x>4. Atme=O.O 1,
though the x-dependence was similar tome=0.001,
Fvalues were significantly greater than the result from the LL for x<4.The results at
me=0.001
and0.01
for PMETAC can be described by eqn (3-1-6) with single k values as shown in Fig. 3-2-4.At
me=0.1,
r values are similar to those atme=0.01
in the range x>2. Atx=1,
however, r values are significantly greater than those at
me=O.O 1.
The observed xdependence at me=O.l cannot be described by eqn (3-1-6). Parameter k increased with
me
for PMETAC, similar to those of anionic polyelectrolyte NaPA and NaPSS.0.16
0.12
r o.oa
0.04
0 0
···�···�···��···
---- --- A-- - --- - ---u"/i--- ---D
________ _D.
1 2 3 4 5
X
6 7
Figure 3-2-4. Donnan distribution of NaCl for PMETAC at 25°C. The solid straight line represents the result predicted frotn the LL. me=
(6)
0.001 tnol kg-1; (0) 0.01 tnol kg-1 and (D) 0.10 mol kg-1• Dotted curves are calculated from eqn (3-1-6) with k=0.28, 0.22 and 0.18, frotn top to bottom, respectively.3-2-4. PAAm/NaCI
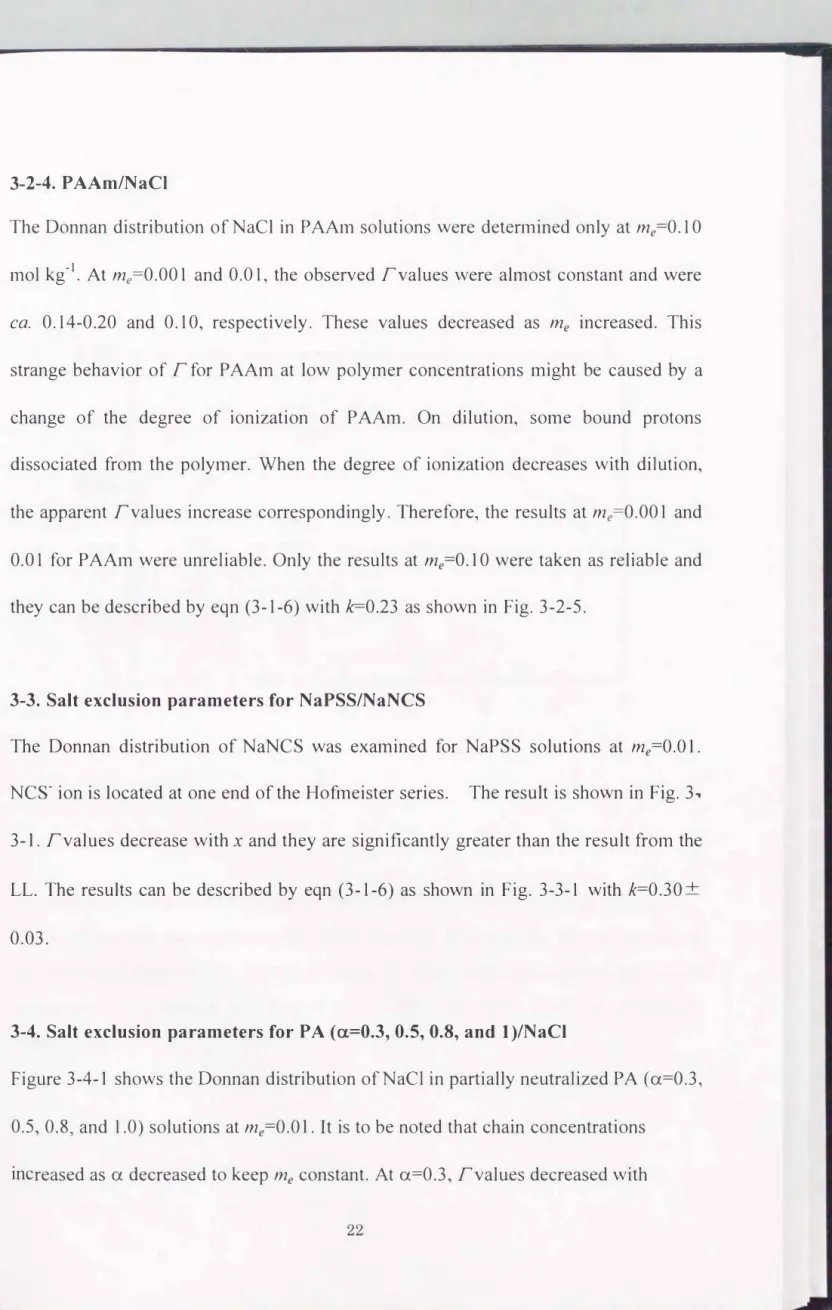
The Donnan distribution ofNaCl in P AAm solutions were determined only at me=0.1 0 tnol kg-1• At me=0.001 and 0.01, the observed Tvalues were almost constant and were
ca. 0.14-0.20 and 0.10, respectively. These values decreased as me increased. This
strange behavior of r for P AAm at low polymer concentrations might be caused by a change of the degree of ionization of P AAm. On dilution, some bound protons dissociated from the polymer. When the degree of ionization decreases with dilution, the apparent Tvalues increase correspondingly. Therefore, the results at me=0.001 and 0.01 for P AAm were unreliable. Only the results at me=0.1 0 were taken as reliable and they can be described by eqn (3-1-6) with k=0.23 as shown in Fig. 3-2-5.
3-3. Salt exclusion parameters for NaPSS/NaNCS
The Donnan distribution of NaNCS was examined for NaPSS solutions at me=O.Ol.
Ncs-ion is located at one end of the Hofmeister series. The result is shown in Fig. 3,
3-1. Tvalues decrease with x and they are significantly greater than the result from the LL. The results can be described by eqn (3-1-6) as shown in Fig. 3-3-1 with k=0.30+
0.03.
3-4. Salt exclusion parameters for P A ( a.=0.3, 0.5, 0.8, and 1 )IN aCI
Figure 3-4-1 shows the Donnan distribution of NaCl in partially neutralized PA ( a=0.3, 0.5, 0.8 and 1.0) solutions at me=O.O 1. It is to be noted that chain concentrations
increased as a decreased to keep me constant. At a=0.3, Tvalues decreased with
0.25 0.2 -
0.15 - r
0.1 �
0.05 f-
0 0
...
... ;'
-·
.
- --- - - - -;- - _
... ...
�·��·�··�·· �··:··:.:.··
..... �.7:'" • • ':<..� .. :-:-:.?. .. � ...� .. :-:: .. �.� .. :-:-.. � .. � .. :-:-.. ::: ..
-:-:.:::· .. :-:-. _x-
I I I I I I
1 2 3 4 5 6
X
7
Figure
3-2-5.
Donnan distribution ofNaCl for PAAm at me=0.10
mol kg-1 at25°C.
The solid straight line represents the result predicted from the LL. The dotted curves are calculated from eqn
(3-1-6)
with k =0.23.
( ---) drawn through experimental results represented with crosses and dots at me =0.001
and0.01,
from top to bottotn, respectively.0.16
iQ)--- - co
.. . ______ _____o ··----0 .... 0·--- --0 0 ··---- --- ---0
0.12 -
r o.oa r-
0.04 r- f-
0 I I I I I
0 1 2 3 4 5 6
X
Figure 3-3-1. Donnan distribution of NaNCS for NaPSS at me= 0.01 mol kg-1 at
25°C. The solid straight line represents the result predicted from the LL. The dotted curve is calculated frorn eqn (3-1-6) with k = 0.30.
0.3
0.2
r
0.1
0
0 1 2 3 4 5 6 7
X
Figure
3-4-1.
Donnan distribution ofNaCl for partially neutralized PA at me=0.01
mol kg-1 at
25°C.
Solid straight lines represent the results from the LL for a=0.3, 0.5, 0.8
and1.0,
from top to botto1n, respectively. a=(0) 0.3; (6) 0.5; (D) 0.8; (0) 1.
The dotted curves are calculated fr01n eqn
(3-1-6)
with k =0.54, 0.36, 0.24
and0.22,
from top to bottom, respectively.
0.3
0.2
r
0.1
0 0
'
'
'·�·-·-., c=:t=l
...
.... ... .... ...
..Cb
...
'·,· ......
�-. -·-·-·-·-·-·-·-·-·-·-·-·- Ln M
1 2 3
X
0
.......
.
......... -·-·- ·-·-··-·-·- 0
D. DD, D.
0 ·-·-·- c=J·- ·-·-·-·-·-·-·-·-·-·-·-·
4 5 6 7
Figure 3-4-2. Donnan distribution of NaCl for partially neutralized PA at me = 0.01 tnol kg-1 at 25°C. Solid straight lines represent the results from the LL for a= 0.3, 0.5, 0.8 and 1.0, from top to bottom, respectively. a=
(0)
0.3;(6)
0.5;(D)
0.8;(0)
1.The chain curves are calculated frotn eqn (3- 1-3) with �=0.855, 1.43, 2.28 and 2.85, from top to bottotn, respectively.
increasing x and they were much smaller than the result from the LL. In the present study x----70 corresponds to large excess salt. The limiting law behavior is expected for large x, that is, small m5• But deviation becomes more significant as x increases. At a=0.8, Tvalues can be approximated with the LL, as in the case for a=l.O. Both the
concentration dependence and the deviation from the LL became smaller as a increased.
The x-dependence of the r values decreased as a increased. All the results on partially neutralized PA exmnined can be described by eqn (3-1-6) with single parmneters k. The k values also decreased as a increased, since the interaction between polyions and counterions increases with a at a given me.
Figure 3-4-2 shows the comparison of eqn (3-1-3) with the experimental r data. The values predicted in terms of the D-M treatment were in agreement with the experimental results when a was small.
3-5. Donnan equilibria of a 1-2 salt in polyelectrolyte solutions (NaP A/Na2S04
and N aPSS/N a2S04)
For 1-2 salts, the preceding relation eqn (3-1-1) for 1-1 salts in the ideal Donnan case becomes eqn (3-5-1 ).
r= [(1 + x/2)213- 1] I X (3-5-1)
The value of To is 1/3 rather than 1/2 for the 1-1 salt. The decrease in To is a manifestation that uneven salt distribution is less favored on entropic ground for a 1-2
salt. According to the LL, 1
To= 113 (1 - 112;) (� <1)
or11(6;) (c;> 1)
or equivalentlyTo= ¢PI
3 The Alexandrowicz relation is extended to1-2
salts as follows.( f/Jp me + 2ms)2ms = (2ms')2ms'
This is rewritten as
r= ¢p[1 +¢p xl4 ] l(y2 + y + 1)
In the present study, we employ eqn (3-5-5) with a parameter kin place of
¢p·
T=k
[1 + kxl4]1 (y2 + y + 1)= [(1 + kxl2)213- 1] I
X(3-5-2)
(3-5-3)
(
3-5-4)
(3-5-5)
The last expression is obtained since
y -1 =
r x. Values of k were determined from(y312 -1)
vs. x plot, sincey312 = 1 + kxl2
(3-5-6)Once k is determined, r is calculated according to eqn (3-5-5). It is interesting to examine whether or not k is identical for NaCl and Na2S04 for a given polymer at the
We have determined the Donnan distribution ofNa2S04 for both NaPA and NaPSS (Mw
=
5 x10⁵)
at three polymer concentrations,me= 0.001, 0.01,
and0.10
mol kg-1• In Fig. 3-5-1 and 3-5-2, values of rare shown as functions of x, for NaP A and NaPSS, respectively. In these experiments x was varied whileme
was kept constant. At a low polymer concentration(me=0.001),
Tvalues of both polyelectrolytes were slightly, but significantly, greater than0.058
which is the result from the LL. Atme=0.01
for both polymers, a slight deviation from the LL and a weak x-dependence are both significant.0.16 0.12
f-r 0.08
f-0.04
f-0 0
0.16 0.12
-r 0.08
-0.04
f-0 0
0.16 0.12
f-r 0.08
f-0.04
f-0 0
§E3tPo o··· ·· f3J
I I I I I I
1 2 3 4 5 6
X
C() Q3 0 D(j
� n
·-···o
"Y
I I I I I I
1 2 3 4 5 6
X
6··- � ··· � ···A
I I I I I I
1 2 3 4 5 6
X
a 7
b
7
c 7
Figure 3-5-1. Donnan distribution ofNa2S04 for NaPA at 25°C. The solid straight lines represent the result predicted from the LL for 1-2 electrolytes. (a) me = 0.10 mol kg-1•
The dotted curve is calculated frotn eqn (3-5-5) with k = 0.24.
(b)
me= 0.01 tnol kg-1•The dotted curve is calculated from eqn (3-5-5) with k = 0.23. (c) me= 0.001 mol kg-1•
The dotted curve is calculated frotn eqn (3-5-5) with k = 0.21.
0.16
0.12 - ··· ····
§
······ ···[' 0.08 �
§�� ��� �:
0.04 �
0 I I I I I
0 1 2 3 4 5 6
X
Figure 3-5-2. Donnan distribution of Na2S04 for NaPSS at 25°C. The solid straight line represents the result predicted frotn the LL for 1-2 electrolytes. Sytnbols as given in Fig. 3-2-2. The four dotted curves are calculated frotn eqn (3-5-5) with k = 0.40, 0.34, 0.28 and 0.22, frotn top to bottom, respectively.
At
me=0.1 0,
the x-dependence ofT was weak for NaPA, while T decreased from ca.0.14
atx=1
to ca.0.10
atx=5.4
for NaPSS. The results can be described by with eqn (3-5-5), as shown in Figs.3-5-1
and3-5-2,
with k values of0.21, 0.23,
and0.24
forNaPA and
0.22, 0.28,
and0.37
for NaPSS. These k values are in good coincidence with those obtained on NaCl for both polyelectrolytes. In Table1,
k values together with¢P
values are summarized.In the present study, the Donnan salt distribution was approximately described by eqn (3-1-6) or eqn (3-5-5) for values of
me
between0.001
and0.1
mol kg-1 and ofx
between
1
and5.
We have found that the parameter k depended significantly onme.
This is contrary to Vink's proposal.20
3-6. The estimation of mean activity coefficients of salts in polyelectrolyte solutions
Mean molal activity coefficients
Y±
of NaCl or NaNCS in the polyelectrolyte solutions were calculated from the following equation.(
Y±
)2 (m s + me ) m s
=( Y±' m
s' )2For Na2S04, eqn (3-6-2) was used in place of eqn (3-6-1).
(
Y± )3 ( 2ms +me
)2ms
=4( Y±' ms' )3
(
3-6-1
)(3-6-
2
)For NaCl, mean rational activity coefficients of polyelectrolyte-free salt solutions/±' were calculated as 44
log.f±' =-A(
m5'
)112 I[1 + ( ms'
)112]+
bm5'
(A=0.5115 and b=0.16 ) (3-6-3)Here, Y±' were calculated as
f±'
I (1 + 0.001 vW Am), where v, W A and m represent, respectively, the number of moles of ions formed by the ionization of one mole of solute (NaCl), the molecular weight of the solvent (water), and moles of solute per kilogram of solvent.44For NaNCS45
112 I * ( ) I /2]
log
YNa'
= -A ( ms') [
1 + B a ms' 1 o gYN cs'
= -A ( m s' ) 112 I[
1 + B a* ( m s' ) 1 12](3-6-4) (3-6-5) where A=0.5114, B=0.3291x10⁸, a*=4.5 and 3.5 for Na+ and NCS-, respectively.
Y±' =
(YNa' YNcs')
112logY±'=-0.708(6m5
'
)112 I { 1 +A (6m5')112} + B (6m5')- log (1 + 0.054m5') where A=0.719 and B= - 0.0053.The activity coefficient is related to the salt exclusion parameter r as ( y± I y±')2 = (Tx + 1)2 I (x + 1) for NaCl and NaNCS
Mean activity coefficients predicted from the LL, (y±)LL, are given as follows.
For 1-1 electrolyte, 1 such as NaCl and NaNCS,
In (y±)LL=-�xl{2(x + 2)} (�<1)
For 1-2 electrolyte, such as Na2S04,
(3-6-6)
(3-6-7)
(3-6-8)
(3-6-9)
(3-6-10)
and (�1) (3-6-11) The charge density parameter �is estimated to be 2.85 for NaPA, NaPSS, P AAm, and PMETAC. For partially neutralized PA, �is taken as ax 2.85 in terms of a, the degree of ionization. The values of (y±)LL are shown with dotted lines in all figures.
The activity coefficients ofNaCl and Na2S04 for NaPA are shown in Figs. 3-6-1 and 3-6-2, respectively. Activity coefficients decreased as me or ms increased. At me=O.OOI, the observed values agree with (y±)LL· When me is large, however, the observed values are smaller than (y±)LL in the stnall x region, that is, the large ms region. In particular, they are considerably smaller than (y±)LL for Na2S04 over the entire range of x examined. While small ion- small ion interactions are not taken into account in the LL, or their contributions are assumed to be approximately same to both Y± and Y±', their contribution Y±ss is involved in the observed Y± values. The difference between observed values and (y±)LL will be reduced if the contribution Y±ss is taken into account.
When the electrostatic free energy is assutned to be the sum of two interactions, polyion - small ion and small ion - small ion, we have, Y± = Y±ps Y±ss, where Y±P represents the contribution from the polyion - small ion interaction. When accounts were taken of interactions between small ions, the LL would become applicable to finite concentrations of simple salt under low polyelectrolyte concentrations. Observed activity coefficients should be compared with (Y± 55)(y±)LL rather than (y±)LL·
Wells40 approximated Y±ss with Y±'(ms), the mean activity coefficient in a salt solution at the salt concentration ms. It is to be noted that the external salt concentration in the
Y±
Y±
1 1
0.9 a 0.9
b
0.8 0.8
0.7
Y±
0.70.6 0.6
0.5 0.5
0.4 0.4
0 1 2 3 4 5 6 0 1 2 3 4 5 6
X X
1 1
0.9 c 0.9
d
0.8 0.8
0.7
Y±
0.7 ...0.6 0.6
0···. o···o··o.o
0.5 0.5
0.4 0.4
0 1 2 3 4 5 6 0 1 2 3 4 5 6
X X
Figure 3-6-1. Mean activity coefficients ofNaCl as a function of x in NaP A solutions.
(a) 1ne= 0.001tnol kg-1•
(b)
me= 0.01tnol kg-1• (c) me= 0.10 mol kg-1• (d)ms
= 0.01tnol kg-1. Dotted curves,
(y±)LL,
are predicted from eqn (3-6-1 0). Solid curves represent(y±)LLY±'(ms).
1 0.9 0.8
0.7 Y± 0.6
0.5 0.4
0.3
0 1 2 3 4 5 6 7
X
Figure
3-6-2.
Mean activity coefficients of Na2S04 as a function of x in NaPA solutions.(6) me=
0.001 tnol kg-1; (0)me=
0.01 tnol kg-1;(D) me=
0.10 mol kg-1•The dotted curve,