九州大学学術情報リポジトリ
Kyushu University Institutional Repository
Mechanism of Arsenic Release from Peat
Sediments into the Groundwater of Wells in the Rural Villages of the Bengal Delta
Md. Shamim, Uddin
Graduate School of Social and Cultural Studies, Kyushu University
https://doi.org/10.15017/21701
出版情報:Kyushu University, 2011, 博士(理学), 課程博士 バージョン:
権利関係:
Mechanism of Arsenic Release from Peat Sediments into the Groundwater of Wells
in the Rural Villages of the Bengal Delta
(ベンガルデルタの農村における泥炭質堆積物から
地下水(井戸水)へのヒ素溶出のメカニズム)
Graduate School of Social and Cultural Studies KYUSHU UNIVERSITY
MD. SHAMIM UDDIN
2012
ii Abstract
Groundwater arsenic (As) contamination in the Bengal Delta is one of the most severe environmental problems in Bangladesh. Millions of village people, who drink the As-contaminated groundwater of wells, are suffering from As poisoning. The main source of As is of geological origin, i.e., the As is contained in the sediments accumulated in the Bengal Delta. The problem has become apparent in the last 20-30 years, to which the release of As from the sediments into groundwater of wells is concerned. However, the mechanisms of the As release are still not well understood. The peat sediment, originated from decayed plant material, is often present in the sediments of the As-contaminated area. In addition, the chemical fertilizers are applied massively in recent decades in the rural villages of the delta. Therefore, this study was made to clarify the mechanism of As release from sediments into groundwater in the rural villages of the delta, considering the effects of peat sediment and massive chemical fertilizers application.
For the sediments bored from the As-contaminated village, the As concentration in the peat sediment was higher than in the other sediments, i.e., the order of the As concentration of sediments was peat>peaty clay> clay>silty clay>sand. A positive relationship between the As concentration, %C and %N was identified in these sediments.
The N and C in the peat sediment were identified to be sourced from the chemical N fertilizer and aquatic plants, respectively, according to the δ15N and δ13C analyses. Thus, it is thought that As concentration in peat sediment is increased by the absorption of As by aquatic plants that had grown there long time ago, and the C concentration was increased by the accumulation of the decayed material of the plants. The positive correlation between %C and %N observed for the peat sediment may have been induced by the
iii
mechanism that the C absorbed N sourced from the chemical N fertilizer with a comparatively weak chemical bond. The peat sediment had a thickness of 0.6-1.8 meters and was located in a shallow layer in between the groundwater table and the bottom of the well at the As-contaminated village. In contrast, peat sediment was not observed in the sediments bored from the non-As-contaminated village, where a thin peaty clay layer was observed at a deeper layer.
From the measurement of groundwater quality at the As-contaminated village, the As concentration of groundwater was maximally as high as 30 times the Bangladeshi drinking water standard. There was a positive relationship between the concentrations of As and ammonium-N. According to the δ15N analysis on the groundwater, the inorganic-N, most of which was the ammonium-N, was identified to be sourced from the chemical N fertilizer, i.e., the same source as that of the peat sediment. The ORP of the groundwater was found to be low, showing a reducing condition of the groundwater. The release of As from peat sediment into groundwater was thought to be induced by the mechanism of “the reduction of iron hydroxides and release of involved As from the peat sediments,” based on the fact that the groundwater As concentration was high when the groundwater was in the reducing condition. A large concentration of ammonium-N in the groundwater observed at a high As concentration may have been sourced from the N in the peat sediment. In the non-As-contaminated village, the concentrations of As and ammonium-N of the groundwater were very low, and the ORP showed that the groundwater was in non-reducing or oxidizing condition. The result of the δ15N analysis showed that the source of the inorganic-N in the groundwater was not the chemical N fertilizer, but animal or human waste. Hence the above-mentioned release of As under the reducing condition did not occur in the village.
iv
From the above comparisons, it was concluded that peat sediment is important and plays a critical role in groundwater As contamination. Concerning the substances of peat sediment to affect the As contamination, As is the most important substance, followed by N. The peat sediment is a place to preserve a lot of As and N. In addition, C and inorganic substances in the peat sediment are important to bond N and inorganic As, respectively. Concerning the groundwater quality parameters to affect the As contamination, ORP is the most important parameter, followed by ammonium-N. Both of them could prompt the release of As into groundwater. A substance of peat sediment can affect a groundwater quality parameter, i.e., N in peat sediment contributes to create the reducing ORP of groundwater through the microbial activity that consumes oxygen by using N as a nutrient. Chemical N fertilizer, i.e., the source of N in peat sediment, eventually contributes to provide the reducing condition. The release of As is prompted by the reducing condition.
Thus, it was concluded that the concentrations of As, C and N, and the source of C and N in the peat sediment, and groundwater parameters of ORP and ammonium-N affect groundwater As contamination. Based on the results, the mechanism of As release from peat sediment into groundwater of wells was clarified in the villages of the Bengal Delta.
For further study, it is important to clarify the topographical conditions favorable for the formation of peat sediment, and the kinds of microorganisms living in peat sediment and their activity in terms of the release of As.
v CONTENTS
CHAPTER 1 General Introduction……… 1
1.1 Background of the study………. 1
1.2 Natural arsenic in the environment………. 3
1.3 Geography and water resources in Bangladesh……….. 4
1.4 Arsenic in the groundwater, sediments and crops in Bangladesh………… 6
1.5 Arsenic occurrence, sources, and mobilization in the groundwater in Bangladesh……… 9
1.6 Proposed mechanisms of arsenic release from sediments into groundwater…. 11 1.7 Toxicity of arsenic………... 13
1.8 Acceptable limit of arsenic for human ingestion………. 17
1.9 Diagnosis and treatment of arsenicosis patients……….. 17
1.10 Screening of tube wells water for arsenic concentration and mitigation activities in Bangladesh……… 18
1.11 Annual consumption of chemical fertilizers in Bangladesh………... 19
1.12 Method of arsenic analysis……… 20
1.13 Objective of the study……….. 21
CHAPTER 2 Materials and Methods……….. 23
2.1 Study area………. 23
2.2 Samples of groundwater, sediments and chemical N fertilizer………… 25
2.3 Measurements of ORP, and concentrations of inorganic-N and As for the groundwater samples………. 29
vi
2.4 Classification of the sediments……….. 30
2.5 Pretreatment of the sediments for As analysis………... 32
2.6 Measurement of %N, %C, δ15N and δ13C values of the sediments and δ15N values of groundwater and chemical N fertilizer……… 32
2.7 Chemicals and reagents………. 34
CHAPTER 3 Comparison of Arsenic Status between Arsenic Contaminated and Non-Contaminated Villages………... 35
3.1 Introduction……….. 35
3.2 Results……….. 37
3.2.1 Geological features of sediments………. 37
3.2.2 Arsenic status of sediments and relevant parameters……….. 41
3.2.3 Relationship of arsenic-carbon-nitrogen in sediments……… 45
3.3 Discussion………... 47
3.3.1 Source of N and C of the peat sediment and their bonding……… 47
3.3.2 The existence of C and N in peat sediments and the role of it on the release of As from the sediments… ……… 49
3.4 Conclusion………. 50
CHAPTER 4 Mechanism of Arsenic Release from Peat Sediments into Groundwater………. 51
4.1 Introduction……… 51
4.2 Results……… 53
4.2.1 Groundwater quality………... 53
vii
4.2.2 Relationships between concentrations of As and ammonium-N, and
ORP for the groundwater……… 57
4.2.3 Depth of the groundwater table and bottom of the tube wells…… 60
4.2.4 δ15N values of the groundwater samples……… 62
4.3 Discussion……….. 63
4.3.1 Source of N in the groundwater samples……… 63
4.3.2 Mechanism of As release from peat sediments into groundwater…. 64
4.4 Conclusion………... 66
CHAPTER 5 Factors Affecting Arsenic Concentration of the Groundwater in the Arsenic Contaminated Village……… 68
5.1 Introduction……… 68
5.2 Factors affecting groundwater As concentration………... 69
5.2.1 Effects of the substances of the peat sediment………. 69
5.2.2 Effects of groundwater quality parameters……….. 71
5.2.3 Relationship between the effects of the substances of peat sediment and groundwater quality parameters……….. 72
5.3 Conclusion………... 73
CHAPTER 6 General Conclusions……… 74
ACKNOWLEDGEMENTS………..………. 77
REFERENCES……… 80
APPENDIX………. 94
viii List of Tables
Table 2.1 Latitude and longitude location of each point Table 2.2 Soil textural classification chart of the sediments
Table 3.1 The concentration of As of each sediment at the S6 site of Dhannokola Village Table 3.2 The %N, δ15N, %C and δ13C values of the peat sediment, and %N and δ15N
value of the chemical N fertilizer
Table 3.3 The concentration of As, %N and %C of each sediment at the S1 site of Samta Village
Table 4.1 The depth of the sampled groundwater, and ORP and concentrations of As, ammonium-N, nitrate-N and nitrite-N for each groundwater sample at the S1-S5 sites of Samta Village
Table 4.2 The depth of the sampled water, ORP and concentrations of As, ammonium-N, nitrate-N and nitrite-N of each groundwater samples at the S6-S7 sites of Dhannokola Village
Table 4.3 The depth of the peat layer, groundwater table and bottom of wells from the ground surface at the S1 to S5 sites in Samta Village
Table 4.4 The depth of the sampled water, δ15N and the concentrations of ammonium-N, nitrate-N and nitrite-N of the groundwater samples for the 5 selected wells at sites S1, S3 and S6
ix
List of Figures
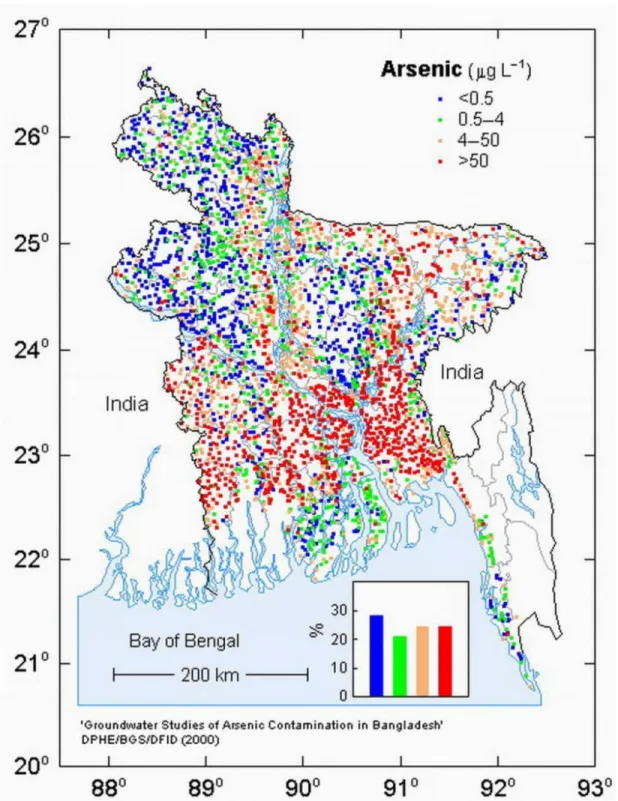
Figure 1.1 Groundwater arsenic contamination map of Bangladesh surveyed by DPHE/BGS/DFID in 2000
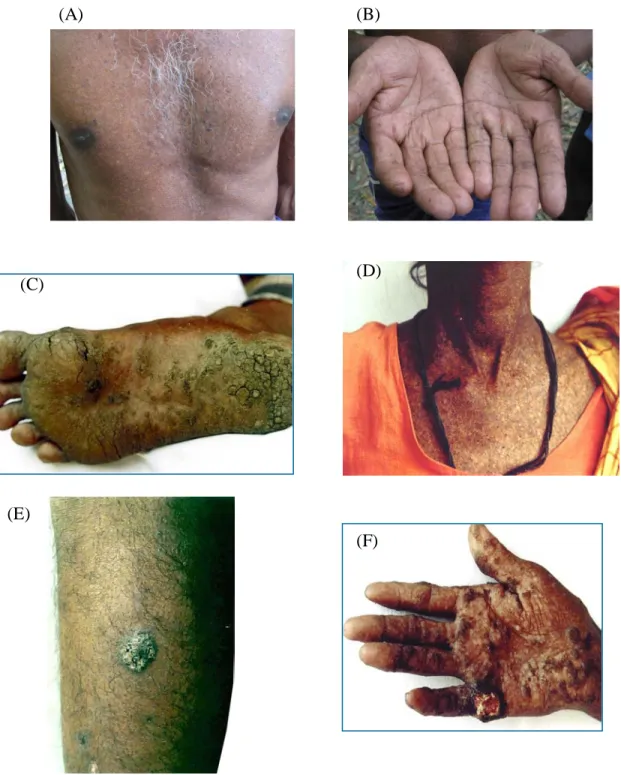
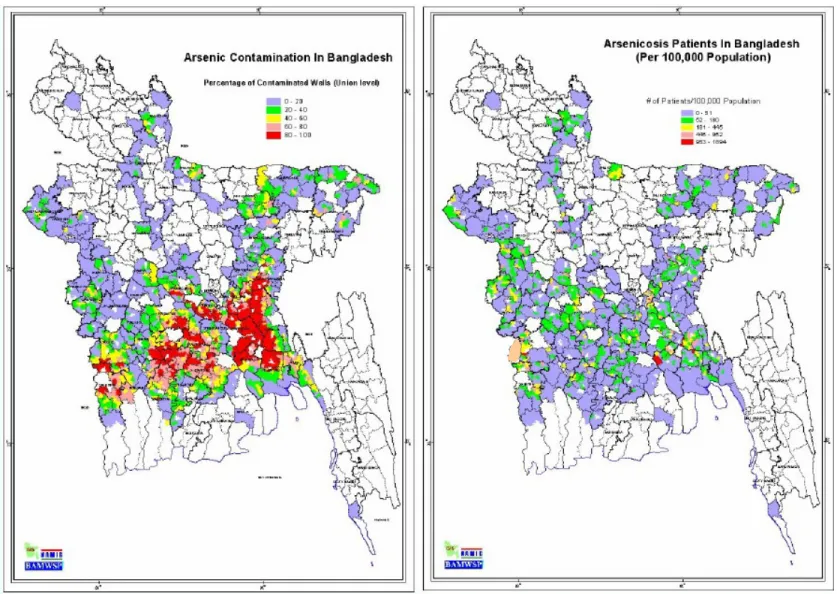
Figure 1.2 Photographs of the arsenicosis patients: (A) Melanosis, (B) Keratosis in palm, (C) keratosis in foot, (D) Severe melanosis, (E) Bowens, and (F) Cancer patients caused by chronic groundwater arsenic pollution in Bangladesh Figure 1.3 (A) Distribution of wells with As concentrations in the groundwater above the
Bangladeshi standard, and (B) the location where arsenicosis patients were mainly identified
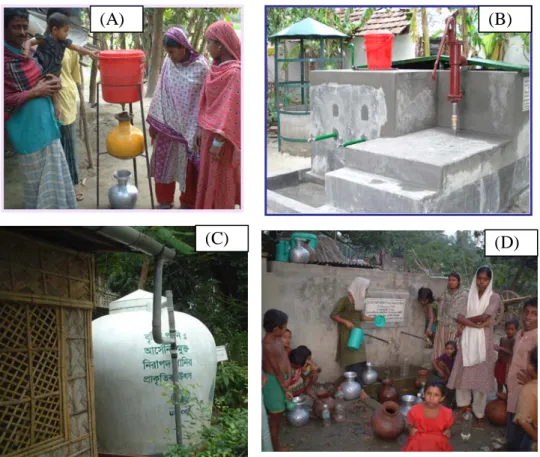
Figure 1.4 Photograph of alternative safe water devices: (A) Household As removal filter, (B) Dug well sand filter, (C) Rain water harvester, and (D) Pond sand filter Figure 1.5 Consumption of fertilizers with years in Bangladesh
Figure 2.1 Location of the study area
Figure 2.2 Photograph of the sampling: (A) Sediment collection using pressure boring, (B) Sediments in a collection tube, (C) Sediment collection using local boring method, (D) Collected sediments in a rack, and (E) Groundwater sampling from wells
Figure 2.3 Photograph of the water quality testing (A) Field water quality test and (B) As test by ICP-MS in the laboratory
Figure 2.4 Photograph of the classified sediments: (A) Peat, (B) Peaty clay, (C) Clay, (D) Silty clay, (E) Fine sand, and (F) Medium sand
Figure 2.5 Photograph of the ANCA mass-spectrometer (SL/20-20, SerCon) in the laboratory
Figure 3.1 Geological profiles of the sediments in the As-contaminated village
x
Figure 3.2 Geological profiles of the sediments in the non-As-contaminated village Figure 3.3 The As concentration of each sediment by depth at site S1
Figure 3.4 Relationship between concentration of As and %C in sediments (**:
significant at 1% level)
Figure 3.5 Relationship between %N and %C in sediments (**: significant at 1% level) Figure 3.6 Bond between N, C and As molecules in peat sediments, and As release Figure 4.1 Relationship between concentrations of As and ammonium-N in groundwater
samples in the As-contaminated village
Figure 4.2 Relationship between As concentration and ORP of groundwater samples in the As-contaminated village
Figure 4.3 Relationship between As concentration and ORP of groundwater samples in the non-As-contaminated village
1
CHAPTER 1
General Introduction
1.1 Background of the present study
Groundwater arsenic (As) pollution is one of the most severe environmental problems in Bangladesh, where millions of people are suffering from As poisoning. The main source of As in Bangladesh is of geological origin (British Geological Survey, 1999). Millions of shallow tube wells have been drilled in the delta to supply drinking water, but the water contains a lot of As.
Much research has been conducted on the groundwater As pollution in Bangladesh, but it has not produced an outcome that can satisfactorily mitigate the As poisoning. Year by year, the As poisoning problem becomes more severe. The mechanisms through which As is released from sediments into groundwater are still not well understood. It is thought that the complex geological and geochemical changes within the Ganges Delta (or Bengal Delta) may be responsible for the occurrence of As- rich groundwater. Rabbani et al. (1999) claimed that since the Bengal Delta is a most recently formed alluvium, the source of As in Bangladesh might be associated with the sedimentary deposits as a similar problem experienced in the adjoining Indian portion of the Gangetic alluvial aquifers in West Bengal of India. According to this source, mobilization of As is regulated by a chain of complex chemical reactions such as oxidation, reduction, precipitation, dissolution, absorption-desorption and methylation.
2
Arsenic comes into the sediments in the state involved in particles from the parent rock and is carried into the stream during erosion.
After the first identification of groundwater As contamination in 1993 in Bangladesh, peat and peaty sediments were considered to be the main sources of As in groundwater of the Bengal Basin due to their rich content of As.
The widespread occurrence of peat layer at a shallow depth in Bangladesh has been noted by Brammer (1996). Peat layer is common beneath the Old Meghna Estuarine Floodplain in Greater Comilla (Ahmed et al. 1998), Sylhet, and the Gopalganj-Khulna basins (Reimann 1993; Brammer 1996). Also, McArthur et al.
(2004) suggested that the peat layer is the driver for the reduction of iron oxyhydroxides, which may be related to the mechanism of As release.
Peat layer occurs extensively beneath the As-affected areas of Samta Village in southwestern Bangladesh, which is the present study area (Ishiga et al. 2000; Yamazaki et al. 2000; AAN, 2000).
However, concentrations of not only As but also C and N of peat layer, all of which show larger values, and the relationship of depth between peat layer and groundwater table, and their contributions to the groundwater As contamination have not been studied well.
In Bangladesh, massive application of chemical N fertilizer to grow crops and vegetables might be considered a possible cause of As pollution in groundwater. On the other hand, the ammonium-N concentration in groundwater was found to be high in the same district of Bangladesh in the present study (Kurosawa et al., 2008a). Thus, the concentration of N in groundwater and sediments were targeted in this study, and to know the source of N, the δ15N values of groundwater and peat sediments were
3
measured. The ORP of groundwater was measured to know the oxidation or reduction characteristic of groundwater. The %C of sediments was measured to know the total organic matter content of the sediments, and the δ13C value of peat sediments was targeted to know the source of C in the sediments.
1.2 Natural arsenic in the environment
Arsenic is the twentieth most abundant element in the earth’s crust, and naturally occurs as sulfide (S2-) in a variety of mineral ores containing copper (Cu), lead (Pb), iron (Fe), nickel (Ni), cobalt (Co), and other metals. It is found in trace quantities in all living things, the atmosphere, water and geologic formations. High concentrations of As (>10 μg/L) in groundwater from natural geological sources have been reported in many countries, such as Bangladesh, India, Nepal, Pakistan, China, Myanmar, Cambodia, Vietnam, Taiwan, Iran, Mongolia, Hungary, Romania, Ghana, Nigeria, Nicaragua, Argentina, Chile, Bolivia, Peru, Mexico, Australia, Canada and many areas in the United States of America (Bhattacharya et al., 1997, 2002, 2006; Welch et al., 2000;
BGS/DPHE, 2001; Mandal & Suzuki, 2002; Nickson et al., 2005; Bundschuh et al., 2006; Berg et al., 2007; O’Shea et al., 2007; Mukherjee et al., 2008).
Arsenic is a toxic metalloid, typically low in concentration (1-5 mg/kg) in igneous and metamorphic rocks, but slightly high in concentration (5-10 mg/kg) in soils and sedimentary rocks (Bhattacharya et al., 2002; Smedley & Kinniburgh, 2002). More than 200 As-bearing minerals are found in rocks in different forms, such as sulfides, oxides, arsenates, arsenites, etc., of which sulfides, especially arsenopyrite (FeAsS) and As-bearing pyrite (FeS2), are the most common minerals. Arsenic is released into the
4
environment (e.g. into air, water or soil) either from natural sources through volcanic activity and weathering of As-bearing minerals or by human activities such as mining, smelting, burning of coals, uses of pesticides, herbicides, fertilizers and wood preservatives, and as discharge from other chemical industries. Naturally occurring As is generally leached into the groundwater system by the interaction of water with rocks, minerals and soils in different geological, hydro-geological and geochemical environments. The As concentration in sea water is low, averaging about 2 µg/L (Ahmed, 2003a).
1.3 Geography and water resources in Bangladesh
Bangladesh, one of the largest deltaic countries of the world, occupies an area of 147,570 square kilometers. It lies in the north eastern part of South Asia, between 20°34́
and 26°38́ north latitude and 88°01́ and 92°41́ east longitude. The country is bounded by India on the west, north and north-east, Myanmar on the south-east, and the Bay of Bengal on the south. Most of the country is composed of the floodplains formed by the three major rivers of the Ganges, Brahmaputra and Meghna. These rivers and their distributaries discharge about 142 thousand cubic meters of water per second into the Bay of Bengal at the peak periods (Rahman et al., 1990). About 80% of the country is floodplains, 12% is hills and 8% is uplifted fault blocks. Bangladesh is endowed with water resources from rainfall, river flow and groundwater. Besides these natural water bodies, there are over one million ponds of various sizes. The total area of the water bodies is over 12,000 square kilometers, which is equivalent to about 8% of the total land area of Bangladesh (BBS, 2009).
5
Groundwater is a major component of the water resource in Bangladesh. Use of groundwater becomes vital during the dry season and drought periods when surface water is insufficient. The groundwater, owing to its better quality, serves for agricultural and industrial uses in most parts of the country during the whole year and 90% of the population depends on the groundwater for drinking purposes. About 97% of the world’s fresh water is groundwater, but its quality is seriously affected by pollution from human activities. The quality of groundwater is mostly good with some variation from place to place, but industrial, agricultural and domestic wastes seriously threaten groundwater quality.
In Bangladesh, groundwater exists in two aquifers, the upper and main aquifers, which probably interconnect hydraulically in most areas. About 90% of the annual rainfall occurs in the period between June and September. Thus, the groundwater level is highest during the monsoon season from August to October, and lowest in the dry season from April and May. Although Bangladesh is countries having one of the most accessible groundwater resources in the world, large-scale withdrawal of groundwater due to uses for irrigation and other household purposes has resulted in a lowering of the groundwater level in many parts of the country. In recent years, water shortages and scarcity have been an usual phenomena in the country during the dry season. The groundwater level in Dhaka City has been declining at a rate of 0.75 meter/year by the increased pumping for domestic water use. It has also been reported that dug wells are becoming dry in many areas of Bangladesh, suggesting that the lowering of the groundwater level is a serious problem for the water supply. It can also be considered that unplanned large-scale withdrawal of groundwater is likely to cause further lowering of groundwater level and widespread As contamination in many areas of Bangladesh.
6
1. 4 Arsenic in the groundwater, sediments and crops in Bangladesh
Groundwater As contamination occurs over a large area of Bangladesh, particularly in the southern half of the country where groundwater is primarily used for drinking purposes for millions of people and is pumped up from the upper aquifer (20-50 m depth). After gaining independence in 1971, the Government of Bangladesh undertook a massive program to provide safe drinking water for the people of the country. The Government of Bangladesh has installed around 8-10 million tube wells to pump up safe water for drinking and domestic purposes in rural areas. In 1993, a high concentration of dissolved As in the tube well groundwater was first reported by the Department of Public Health Engineering, Bangladesh. Since then, As concentrations exceeding 50 µg/L, i.e. the Bangladeshi drinking water standard, have been detected in groundwater in 61 out of 64 districts of Bangladesh by national surveys (BGS/DPHE, 2001; BAMWSP, 2002). According to the National Hydrochemical Survey of Bangladesh conducted in 1998-99, nearly 35 million people drink As contaminated tube well water (DPHE/BGS/DFID, 2000). The As contamination is mainly restricted to groundwater that is from shallower than a depth of 150 meters. The deeper aquifers are consistently low in As concentration. Arsenic contamination is restricted to young alluvial aquifers occurring in the floodplains. There are 8,540 villages in Bangladesh, where more than 80% of the wells, used as the single source of drinking water, are contaminated with As. A randomly sampled groundwater As contamination map of Bangladesh is shown in Fig.1.1 which was surveyed by DPHE/BGS/DFID (DPHE/BGS/DFID, 2000). The map shows that highly As-contaminated areas are found in the surrounding adjacent areas of the Ganges, Brahmaputra and Meghna rivers.
7
Figure 1.1 Groundwater arsenic contamination map of Bangladesh surveyed by DPHE/BGS/DFID in 2000
8
In addition to the use of groundwater for domestic purposes, a significant amount of groundwater is used for irrigation purposes during the dry season for rice planting. To meet the food demands for the increasing population in Bangladesh, the number of croppings has been expanded from one time to several times per year, and it is estimated that about 86% of the total groundwater pumped up is utilized for crop planting because of the limited rainfall during the rainy season. About 75% of the total irrigation water is provided by groundwater, and use of groundwater for irrigation may cause As contamination of paddy fields and rice grain. Apart from the health problem caused by drinking high As-containing groundwater, irrigation by As-contaminated groundwater threatens human health through intake of it by crops. There are some reports which have reported on the significant intake of As from rice and vegetables (Farid et al., 2003;
Meharg & Rahman, 2003; Correll et al., 2006; Huq et al., 2006). It has been estimated that more than 1,000 tons of As transferred annually from groundwater to arable land by groundwater irrigation, which poses a potential risk for future food production (Roberts et al., 2007).
Numerous studies have been done on the As contamination of groundwater, soils and crops in Bangladesh, as introduced by Heikens (2006). Some other studies have focused on the relationships between groundwater-soils-crops (Kurosawa et al., 2008b), groundwater-soils (Jahiruddin et al., 2000; Ali et al., 2003), and soils-rice (Chaturvedi, 2006) in the paddy fields. Heikens et al.(2007) stated that soil As concentration had increased with years due to the development of irrigation. The growth of rice plants was affected negatively by the amount of As in the soil, and As damaged the roots of the rice plants, resulting in suppression of the uptake of nutrients by the roots (Abedin et al.,
9
2002). Therefore, the contamination of soil and agricultural products by As is also of great concern.
1.5 Arsenic occurrence, sources and mobilization in the groundwater in Bangladesh
Arsenic can exist in groundwater with various oxidation numbers including +5 (arsenates), +3 (arsenites), +1 and -3 valences, and rarely in the elemental form. In these different oxidation numbers, As can form organic and inorganic compounds. The toxicity of As compounds depends largely on the oxidation number whether As is present in an organic form or not. The order of toxicity (from the highest to the lowest) is as follows:
arsine (-3), arsenites (+3), arsenates (+5), and arsonium metals (+1). Under the reducing condition, As is a stable solid, and dissolved, As is present in oxygenated water. There are about 320 As-bearing minerals in nature, and the most commonly existing ones are:
realgar (AsS), orpiment (As2S3), arsenopyrite (FeAsS), arsenolite (As4O6), and As pentoxide (As2O5). Among them, arsenopyrite is the most common (Ahmed, 2003a).
Arsenic can occur in groundwater due to natural geochemical processes or anthropogenic activities. The groundwater As contamination in Bangladesh arises from the presence of As in the aquifer sediments and its release from the sediments into the groundwater.
Geological source of arsenic: The Ganges Delta (or the Bengal Delta) is the largest delta in the world, where these rivers contribute to the transport of one-third of the global sediments from the Himalayas to the world’s oceans (Loving-bengal.net, 2007). It can be considered that these sediments are transported from the Himalayas created by the land in
10
the present form and carry As. Thus, there is no doubt that the source of As in the sediments is of geological origin. Arsenic is usually contained in the range of 2-20 mg/kg in the alluvial sediments; which is greater than the range found in typical sediments (2-6 mg/kg) (British Geological Survey, 1999). However, it appears that a large proportion of As is present in a potentially soluble form. The greatest As concentrations are mainly found in the fine-grained sediments, especially of the grey clays (British Geological Survey, 1999). A large number of other elements, including iron, phosphorus and sulfur, are also enriched in the clays. The mobilization of As from sediments to water depends on the sediment-water interaction in different environments.
Mobilization of arsenic in the reducing condition: The reducing environment is believed to release As into groundwater because the reducing environment transforms ferric iron (III) to its ferrous (II) form, accompanied by the dissolution of both iron and As into groundwater (Ahmed, 2003b). A positive relationship was found between the degree of reduction and the As concentration in groundwater (British Geological Survey, 1999). It has been observed that high organic matter in sediments produces strong reducing condition in the sediments and groundwater (British Geological Survey, 1999).
This process is aided by the high groundwater table and by the presence of fine-grained layers in the surface which impede entry of air to the aquifers. Microbial oxidation of organic carbon has depleted the dissolved oxygen in the groundwater. This is reflected by the high bicarbonate concentrations found in groundwater in recent sediments (British Geological Survey, 1999).
11
1.6 Proposed mechanisms of arsenic release from sediments into groundwater
The main source of As in the Bengal Delta is of geological origin, and As is contained in the sediments of the shallow Holocene aquifers of the delta (Ravenscroft et al., 2005). Millions of shallow tube wells have been drilled in the Delta to supply drinking water to local people, but the water contains a lot of As. Much research has been conducted on the groundwater As pollution in Bangladesh, but the mechanism of As release from sediments into groundwater is still not well understood. Several hypotheses on the As release mechanism have been proposed, including (i) reduction of iron hydroxides and the release of involved As from the sediments (Nickson et al., 2000;
McArthur et al., 2001; Dowling et al., 2002), (ii) release of As following oxidation of As- rich pyrite in the sediments (Chowdhury et al., 1999), and (iii) anion exchange of adsorbed As with P originating from fertilizers (Acharyya et al., 2000). Among these mechanisms, (i) is the most widely accepted at present. Microbial activity is considered to be a factor to create the reducing condition in groundwater through decomposition of organic matter (Wang and Mulligan, 2006).
On the other hand, intensive cropping has been done in Bangladesh to produce food the 151.1 million people living in the small country area of only 147 thousand km2. The Government of Bangladesh has subsidized chemical N fertilizer to farmers to grow crops and vegetables (Ministry of Industries, Bangladesh, 2008). However, massive application of chemical N fertilizer to the fields is a possible cause of the As contamination in the groundwater.
12
Three hypotheses regarding As release from sediments into groundwater leading to the As contamination of groundwater in the Bengal Delta, i.e., (i) reduction, (ii) oxidation, and (iii) anion exchange associated with phosphate fertilizer application, are described in detail below:
Reduction: Nickson et al. (1998) proposed the reduction hypothesis as the source of As in groundwater of the Bengal Delta. Therein, As is released by the reductive dissolution of As-rich iron hydroxides derived from the weathering of base-metal sulphides. It has been suggested that the As-rich groundwater is mostly restricted to the Holocene aquifers of the Bengal Delta. As the region where the concentration of iron and As is positively correlated is in the Bengal Delta, the source of As-rich iron hydroxides must lie in the Himalayas.
Oxidation: According to this hypothesis (Chowdhury et al., 1999), As is derived from the oxidation of As-rich pyrite in the sediments of the Bengal Delta aquifer as atmospheric oxygen invades the aquifer in response to a lowering of the groundwater table carried by the excessive withdrawal of water.
Anion exchange associated with phosphate fertilizer application: Phosphate fertilizer itself contains As because it is made from phosphate rock that contains As. In addition, As in the sediments is combined with iron. When phosphate enters the sediments, the phosphate combines with the iron, resulting in the release of As into the groundwater (Acharyya et al., 2000).
According to Kurosawa et al. (2008a), the ammonium-N concentration in groundwater was high in an As-contaminated area in Bangladesh, and the possible source of ammonium-N would be chemical N fertilizers.
13
1.7 Toxicity of arsenic
From ancient times, As compounds have been known as agents of committing suicide and murder, and as a common environmental agent. Arsenic has a metallic taste and slight garlicky odor. It is toxic and carcinogenic, and only a small quantity of it can cause serious health hazards. Dosages of 70-180 mg of As trioxide (As2O3) have been reported to be lethal to human beings in acute toxicity (Leonard, 1991). The toxicity and health effect of As depends on the chemical and physical states of gas, solution and powder particle size of the As compounds, the rate of absorption into cells, and of course, the preexisting state of the patient. Arsenic is present as organic and inorganic forms in the environment. Inorganic As is exist in groundwater and is more toxic than the organic As. High concentrations of inorganic As in groundwater induce a risk of As poisoning and poisons people slowly.
There is clear evidence that long-term use of As-contaminated water for drinking purposes increases the risk of getting cancer (Hopenhayn, 2006; Yuan et al., 2007). It was confirmed from the epidemiological studies that long-term exposure to As- contaminated drinking water above the permissible limit causes melanosis, lewcomelanosis, keratosis, hyperkeratosis, skin pigments, Bowens, gangrene and causes cancer in the kidneys, bladder, skin, lungs and liver. These symptoms are the common types of chronic As poisoning. Arsenic is also deposited in bones, teeth and hair. For manifestation of the symptoms of As toxicity in a person’s body it may take several years after the start of drinking of As-contaminated water. 38,430 arsenicosis patients were identified in 270 out of the total 460 Upazilas (meaning sub-districts) up to 2004 in Bangladesh (NAMIC, 2005), where the drinking water quality did not meet the
14
Bangladeshi drinking water standard for As. The World Health Organization recommends a safety standard of 10 µg/L of As for drinking water, which is lower than the 50 µg/L of the standard set for the drinking water in Bangladesh.
In the present study, As concentrations of up to 1.5 mg/L were found in tube well water in Samta Village, which is 30 times higher than the Bangladeshi drinking water standard. In Samta village, 153 arsenicosis patients were identified in 2003 (JICA/AAN, 2004), and the photos of some patients are shown in Fig. 1.2. According to the national screening report of wells (NAMIC, 2005), groundwater As contamination has been identified in 61 out of 64 districts in Bangladesh where 38,430 arseniccosis patients were identified in 2005 (NAMIC, 2005). The groundwater As contamination map and the location map where patients were identified, both maps being divided by district, are shown in Fig. 1.3.
15
Figure 1.2 Photographs of the arsenicosis patients: (A) Melanosis, (B) Keratosis in palm, (C) keratosis in foot, (D) Severe melanosis, (E) Bowens, and (F) Cancer
patients caused by chronic groundwater arsenic pollution in Bangladesh (E)
(A) (B)
(C) (D)
(F)
16
Figure 1.3 (A) Distribution of wells with As concentrations in the groundwater above the Bangladeshi standard, and (B) the location where arsenicosis patients were mainly identified
17
1.8 Acceptable limit of arsenic for human ingestion
Intake of As by the human body from foods, especially from sea food, is probably greater than that from drinking water. However, As species from sea food are mostly in organic form with a low toxicity. Arsenic present as an inorganic form in drinking water is more toxic. The World Health Organization established a guideline for drinking water quality in 1984 in the first edition (Ahmed, 2003a), where the water quality standard for As was set as 50µg/L, which was reduced to 10µg/L in 1993. The Government of Bangladesh adopted the value of 50µg/L in its Environmental Quality Standards (Ahmed, 2003a) in 1991.
As-contaminated groundwater is also used for irrigation. Therefore, a permissible limit for irrigation water should be established. The Food and Agriculture Organization showed that if As-contaminated water is used for agricultural purposes, As may enter in to the food chain (Meharg and Rahman, 2003; Dittmar et al., 2007; Roberts et al., 2007), and set the permissible limit of As, as 0.1 mg/L, 20 mg/kg and 1 mg/kg for irrigation water, soil and food, respectively.
1.9 Diagnosis and treatment of arsenicosis patients
No effective treatment is known for treating As poisoning, but drinking As-free water can help affected people get rid of or alleviate the symptoms of As poisoning.
Hence, provision of As-free water is urgently needed to mitigate As poisoning and health damage caused by drinking As-contaminated water. The intake of high proteins and a vitamin-rich diet help affected people in the alleviation of arsenicosis diseases and
18
protects them against the toxic effects of As. The antioxidant vitamins A, E and C also play an important role in the detoxification of As. The cancer and Bowens organs of the body caused by drinking As-contaminated water can be removed through surgical operation. Finally, the use of As-safe water for drinking and cooking purposes and an intake of high proteins and vitamin-rich diet most effectively help affected people to recover from arsenicosis diseases.
1.10 Screening of tube wells water for arsenic concentration and mitigation activities in Bangladesh
The As concentration of tube well water was screened in 270 out of the total 460 Upazilas (meaning sub-districts) by the Government of Bangladesh with the help of some donor agencies and NGOs. If the As concentration exceeded 50 µg/L, which is the Bangladeshi drinking water standard for As, the mouth of the tube well was painted red, while it was painted green when the As concentration was below the standard. At the same time as the screening of the tube well water, an awareness raising program was implemented to educate the village people about As poisoning from drinking water and it’s toxicity. However, many village people are still not aware of the groundwater As pollution and are still using the contaminated water.
The groundwater from non-As-contaminated wells, deep tube wells and dug wells, water from water treatment plants and rain water can be potential water supply sources to mitigate the As problem in Bangladesh. On the other hand, there are several As removal methods available for both household and community-based plants, which can also play a vital role in the supply of safe drinking water to many As-contaminated areas in
19
Bangladesh. These alternative safe water devices play an important role in mitigating the As problem in many victim areas in Bangladesh, a photo of some alternative devices is shown in Figure 1.4.
1.11 Annual consumption of chemical fertilizers in Bangladesh
Fertilizer provides the most important nutrient elements to soils and plays the most vital role in crop production in the 8.29 million hectares of lands used for agricultural purposes in Bangladesh. The annual consumption of chemical fertilizers for crop production has remarkably increased over the last 40 years, as shown in Fig. 1.5.
Figure 1.4 Photograph of alternative safe water devices: (A) Household As removal filter, (B) Dug well sand filter, (C) Rain water harvester, and (D) Pond sand filter
(A) (B)
(C) (D)
20
Rice is the staple food of the 151.1 million people in Bangladesh, and a large quantity of chemical N fertilizer (mainly urea) is used by farmers for rice cropping. The groundwater As contamination in Bangladesh is considered to have started at the time when the application of chemical fertilizers was initiated.
1.12 Method of arsenic analysis
There are a number of instruments for the analysis of As in water. Commonly used instruments are spectrophotometers, atomic absorption spectrophotometers (AAS) and inductively coupled plasma mass spectrophotometers (ICP-MS). These instruments can measure As concentration down to a very low level. Field methods on site are also available, but give only a rough concentration of As. In Bangladesh, all the tube well water samples have been screened for As measurement by the field test kit, which is good
1980-85 1985-90 1990-95 1995-00 2000-05 2005-08
Urea TSP MOP Others
Fig. 1.5 Consumption of fertilizers with years in Bangladesh
21
to measure As concentration above 0.05 mg/L. However, the accuracy of the value measured by the field test kit is not good for scientific research, and the use of AAS or ICP-MS is preferable.
Pretreatment is necessary to determine As concentration for waste water, soils, sediments, crops, vegetables and biological samples. Several procedures are available for pretreatment, such as (1) decomposition with nitric acid and hydrochloric acid, (2) decomposition with nitric acid and perchloric acid, (3) decomposition with nitric acid and sulfuric acid (Japanese Standards Association, 2002), and (4) decomposition with nitric acid and hydrogen peroxide solution, USEPA 3050B method (USEPA, 1996).
1.13 Objective of the study
The As, observed in groundwater in the Bengal Delta, is of geological origin, but the level of As concentration differs from village to village in the delta, to which some factors of the mechanism of As release are thought to be concerned. In previous studies on mechanism of As release, the chemical properties of peat sediments, high ammonium- N in groundwater, application of huge amounts of chemical N fertilizer have not recently included.
Therefore, the specific objective of this research was to clarify the As releasing mechanism from sediments, in particular from peat sediments, into groundwater. Here, As concentration, oxidation-reduction-potential (ORP), inorganic-N (ammonium-N, nitrate-N, nitrite-N) and δ15N of groundwater, As concentration, %C, %N, δ15N and δ13C of sediments, and δ15N of the chemical N fertilizers were targeted. The following points were focused on:
22
(1) How the sediments structure is organized and how the %C is correlated with the concentration of As and %N in the sediments in the As-contaminated area.
(2) What the effects of C and N in sediments on the release of As from sediments, particularly peat sediment, into groundwater are, and what the source of C and N in the peat sediment is.
(3) What the effects of groundwater ORP, ammonium-N concentration and As, C, N contained in peat sediment on the groundwater As contamination are, and what the source of ammonium-N in the groundwater in the As-contaminated area is.
(4) Finally, the above parameters were compared with those of a non-As-contaminated village where peat sediment was not observed in the sediments.
23
CHAPTER 2
Materials and Methods
2.1 Study area
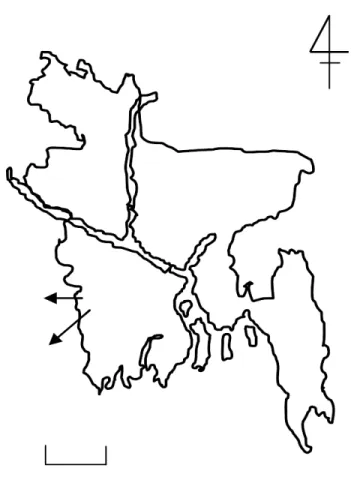
The present study was conducted in the rural villages of Samta and Dhannokola in Sharsha Upazila, Jessore District in southwestern Bangladesh. The location of these villages is shown in Fig. 2.1. Samta Village is an As-contaminated village, i.e., groundwater of 86% of tube wells was contaminated by As in concentrations of greater than 0.05 mg/L, and 153 arsenicosis patients were identified up to 2003 (JICA/AAN, 2004). Dhannokola Village is a non-As-contaminated village, where the As concentration of groundwater of all tube wells was less than the Bangladeshi drinking water standard and no arsenicosis patients were identified (JICA/AAN, 2004). The study area was located on the High Ganges River Floodplain in the agro-ecological regions of Bangladesh (UNDP/FAO, 1988). The soil distributed in the area is Calcareous Dark Grey or Brown Floodplain Soil with low fertility (Bangladesh Bureau of Statistics, 2004a).
According to the meteorological data recorded at Jessore City from 1999 to 2007, the mean annual rainfall was 1,864 mm, mean annual maximum and minimum temperatures were 37°C and 10°C, respectively, and the mean annual relative humidity was 79%
(Bangladesh Bureau of Statistics, 2003, 2004b, 2005, 2007, 2008, 2010). Groundwater is used for the purposes of domestic consumption and irrigation. In the area, large quantities of chemical N fertilizer have been used for crop and vegetable production. The main
24
cropping patterns are rice-rice double cropping and sugarcane monoculture. Although the amount of fertilizers applied was not available for the study area, the national average rate of chemical N fertilizer application is 72 kg/ha for rice and 85 kg/ha for sugarcane for a single cropping (FAO, 2007).
Figure 2.1 Location of the study area
25
2.2 Samples of groundwater, sediments and chemical N fertilizer
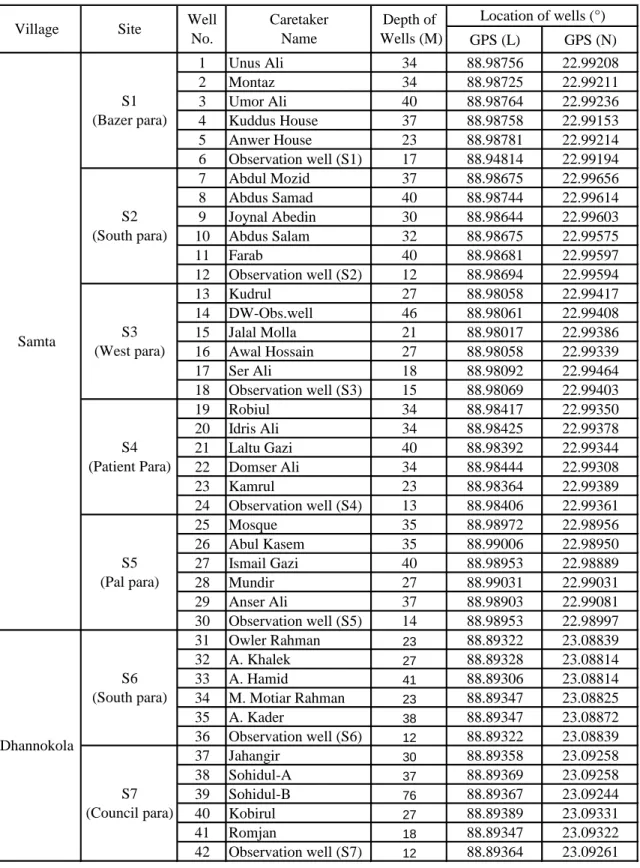
Groundwater was sampled from shallow tube wells. In Samta Village, 30 water samples were collected, six at each of the five sites, and in Dhannokola Village, water was sampled from 12 tube wells, six at each of the two sites. A total 42 of sampling points are shown in Table 2.1. The ORP and concentrations of different forms of inorganic N of groundwater were measured immediately after sampling at each point.
Each sample was preserved in a high density polyethylene bottle and acidified by addition of a nitric acid solution at the sampling point for the subsequent As analysis.
Information on the depth of the tube wells from the ground surface was gathered through interviews with local people, and the depth of the groundwater table was measured with a surveying tape.
Next, two liters of groundwater samples were filtered using a 0.45-µm paper filter to remove suspended particles after back being brought to the AAN laboratory at Jessore City and preserved in a high density polyethylene bottle for measurement of the δ15N value of the groundwater. The sampling was done at 5 selected points (well no. 2, 6, 16, 18 and 36 from Table 2.1), i.e. 4 from Samta and 1 from Dhannokola Villages, which showed high ammonium-N or nitrate-N concentrations of the groundwater.
Sediments were sampled using both hand and pressure boring methods (Fig. 2.2) from the ground surface to a depth of 60 m at intervals of 0.6 m. Here, each sample was taken from the sediments of 1-3 cm in thickness, and a total of 100 samples were collected from each site. Sediment samples were taken at five sites in Samta Village of S1-S5 sites and two sites in Dhannokola Village of S6 and S7 sites as shown in Table 2.1, and preserved in a zip-locked polyethylene bag. The chemical N fertilizer (Urea) used in
26
the study area was sampled from fertilizer shops at a Jamtala Bazaar very close to Samta Village.
The groundwater sampling was done in February-March 2009, March 2010 and December 2010, and the sediments and fertilizer samplings were done in February-March 2009. The samples were brought to Japan for the analyses of As concentration and δ15N for the groundwater, and chemical N fertilizers, and concentrations of As, N and C, and δ15N, and δ13C for the sediments, respectively.
Each sampling point in the Samta and Dhannokola Villages is shown in Table 2.1
27
GPS (L) GPS (N)
1 Unus Ali 34 88.98756 22.99208
2 Montaz 34 88.98725 22.99211
3 Umor Ali 40 88.98764 22.99236
4 Kuddus House 37 88.98758 22.99153
5 Anwer House 23 88.98781 22.99214
6 Observation well (S1) 17 88.94814 22.99194
7 Abdul Mozid 37 88.98675 22.99656
8 Abdus Samad 40 88.98744 22.99614
9 Joynal Abedin 30 88.98644 22.99603
10 Abdus Salam 32 88.98675 22.99575
11 Farab 40 88.98681 22.99597
12 Observation well (S2) 12 88.98694 22.99594
13 Kudrul 27 88.98058 22.99417
14 DW-Obs.well 46 88.98061 22.99408
15 Jalal Molla 21 88.98017 22.99386
16 Awal Hossain 27 88.98058 22.99339
17 Ser Ali 18 88.98092 22.99464
18 Observation well (S3) 15 88.98069 22.99403
19 Robiul 34 88.98417 22.99350
20 Idris Ali 34 88.98425 22.99378
21 Laltu Gazi 40 88.98392 22.99344
22 Domser Ali 34 88.98444 22.99308
23 Kamrul 23 88.98364 22.99389
24 Observation well (S4) 13 88.98406 22.99361
25 Mosque 35 88.98972 22.98956
26 Abul Kasem 35 88.99006 22.98950
27 Ismail Gazi 40 88.98953 22.98889
28 Mundir 27 88.99031 22.99031
29 Anser Ali 37 88.98903 22.99081
30 Observation well (S5) 14 88.98953 22.98997
31 Owler Rahman 23 88.89322 23.08839
32 A. Khalek 27 88.89328 23.08814
33 A. Hamid 41 88.89306 23.08814
34 M. Motiar Rahman 23 88.89347 23.08825
35 A. Kader 38 88.89347 23.08872
36 Observation well (S6) 12 88.89322 23.08839
37 Jahangir 30 88.89358 23.09258
38 Sohidul-A 37 88.89369 23.09258
39 Sohidul-B 76 88.89367 23.09244
40 Kobirul 27 88.89389 23.09331
41 Romjan 18 88.89347 23.09322
42 Observation well (S7) 12 88.89364 23.09261 Location of wells (°) Depth of
Wells (M)
S7 (Council para)
Caretaker Site Well Name
No.
Samta
Dhannokola Village
S1 (Bazer para)
S2 (South para)
S3 (West para)
S4 (Patient Para)
S5 (Pal para)
S6 (South para)
Table 2.1 Latitude and longitude location of each point
28
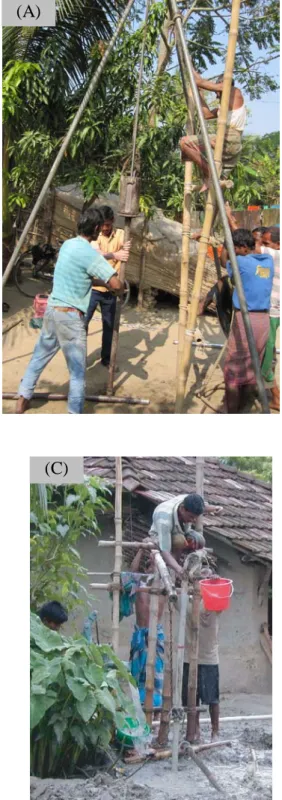
Figure 2.2 Photograph of the sampling: (A) Sediment collection using pressure boring, (B) Sediments in a collection tube, (C) Sediment collection using local
boring method, (D) Collected sediments in a rack, and (E) Groundwater sampling from wells
(A) (B)
(C) (D)
(E)
29
2.3 Measurements of ORP, and concentrations of inorganic-N and As for the groundwater samples
The ORP of groundwater was measured immediately after sampling using a portable ORP meter (Horiba D53, Horiba Co. Ltd). The measured ORP value was then converted to a value corresponding to the standard hydrogen electrode. Concentrations of ammonium-N (NH4-N), nitrate-N (NO3-N) and nitrite-N (NO2-N) of the groundwater were measured immediately after sampling using a field kit (Aqua tester, KRK). The As concentration of groundwater was determined by the inductively coupled plasma mass spectroscope (ICP-MS) (Agilent 7500, Agilent Technologies) at Kyushu University after being brought to Japan. A photo of the field water quality testing and laboratory As test by ICP-MS is shown in Fig. 2.3.
Figure 2.3 Photograph of the water quality testing (A) Field water quality test and (B) As test by ICP-MS in the laboratory
(A) (B)
30
2.4 Classification of the sediments
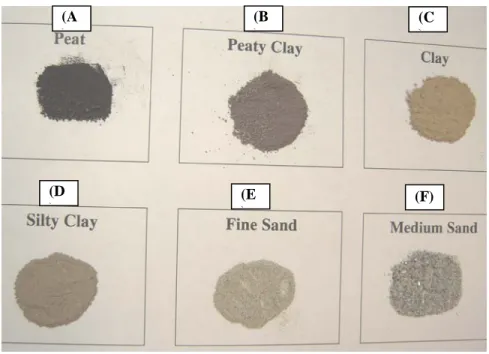
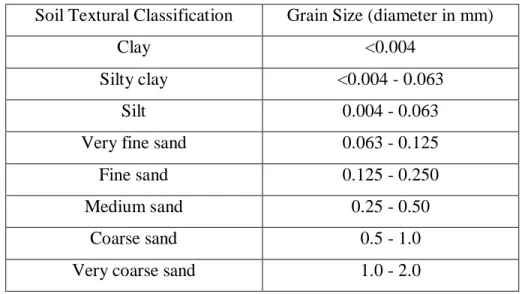
After collecting sediment samples from the sites in Samta (S1-S5) and Dhanokola (S6-S7) Villages, the samples were classified as peat, peaty clay, clay, silty clay and sand in a wet condition, according to the soil textural classification system given by Roy et al.
(2005). Sediments were air-dried at room temperature for 3 to 4 days at Kyushu University and then ground to a powder by using a porcelain mortar pestle. The pretreatment for As analysis for the sediments was done from the powdered sediments. A photo of the air-dried sediments samples is shown in Fig. 2.4.
(B ) (A
)
(E (F) ) (D
)
(C )
Figure 2.4 Photograph of the classified sediments: (A) Peat, (B) Peaty clay, (C) Clay, (D) Silty clay, (E) Fine sand, and (F) Medium sand
31
The soil textural classification chart of the sediments is shown in Table 2.2, and the clay sediments are divided into the 3 groups of peat, peaty clay and clay, depending on the color, touch and smell. The peat sediment was a tropical peat and which belongs to the low moor peat according to Andriesse (1988).
Soil Textural Classification Grain Size (diameter in mm)
Clay <0.004
Silty clay <0.004 - 0.063
Silt 0.004 - 0.063
Very fine sand 0.063 - 0.125
Fine sand 0.125 - 0.250
Medium sand 0.25 - 0.50
Coarse sand 0.5 - 1.0
Very coarse sand 1.0 - 2.0
Table 2.2 Soil textural classification chart of the sediments
32
2.5 Pretreatment of the sediments for As analysis
The air-dried sediment samples were mixed homogeneously, and 0.5 - 1.0 g of the sample (dry-weight basis) was taken into a digestion vessel. After that, 10 mL of a 1:1 nitric acid (HNO3) solution was added and the vessel was covered with a watch glass.
The mixture was heated at 95°C on a hot plate and refluxed for 30 minutes without boiling. Then, 5 mL of concentrated HNO3 was put into the mixture and the mixture was refluxed for 30 minutes. This reflux process was repeated until no brown fumes appeared from the mixture. After that, the mixture was cooled, and 2 mL of water and 3 mL of 30% hydrogen peroxide (H2O2) were added. The mixture was heated at 95°C on a hot plate for peroxide reaction until effervescence subsided and then was cooled. The peroxide reaction was continued by adding 1 mL of 30% H2O2 until the mixture appeared to be unchanged. Finally, the mixture was covered with a watch glass and heating was continued until the volume was reduced to approximately 5 mL. After cooling, the mixture was diluted to 100 mL by adding pure water and was filtered through Whatman no. 41 filter paper. This method of digestion is the USEPA 3050B method (USEPA, 1996), and the filtered mixture was provided for the determination of As by ICP-MS.
2.6 Measurement of %N, %C, δ
15N and δ
13C values of the sediments and δ
15N values of groundwater and chemical N fertilizer
Sediment samples were pre-frozen in a deep freezer for a minimum of 10 minutes and then freeze-dried overnight by using an Eyela freeze dryer (Tokyo-Rika, FDU 506).
The samples were powdered with a porcelain mortar and pestle. Exactly 0.80 mg
33
(duplicate measurements for each sample) was weighed in a tin capsule, and %N, %C, and δ15N and δ13C values of the sediments were measured using continuous-flow stable isotope ratio mass-spectrometry by an ANCA mass-spectrophotometer (SL/20-20, SerCon) at Kyushu University. Glycine and citric acid were used as running standards.
Measurement errors were within 0.3% for δ15N and within 0.1% for δ13C. If the difference of the duplicate values was larger than the measurement error, the measurement was repeated. With reference to the δ15N and δ13C values, the sources of N and C in the peat sediments were identified. The δ15N value of the chemical N fertilizer was measured the same way as for the sediments. The δ15N analysis of groundwater to identify the source of inorganic-N (ammonium-N plus nitrate-N plus nitrite-N) in the water was done at Shoko Co. Ltd., Japan. A photo of the ANCA mass-spectrophotometer is shown in Fig. 2.5.
Figure 2.5 Photograph of the ANCA mass-spectrometer (SL/20-20, SerCon) in the laboratory
34
2.7 Chemicals and reagents
All the chemicals and reagents used in this study were of analytical grade. MilliQ water was used in all steps. Stock solution of As with a concentration of 100 mg/L (Wako Pure Chemical Industries Ltd., Japan) was used in the preparation of the standard solution for ICP-MS analysis. The chemicals used for the digestion of sediment samples were concentrated nitric acid (HNO3 69%) and high purity hydrogen peroxide (H2O2 30%) manufactured by Wako Pure Chemical Industries Ltd., Japan.
35
CHAPTER 3
Comparison of Arsenic Status between Arsenic Contaminated and Non-Contaminated Villages
3.1 Introduction
The occurrence of groundwater As contamination has been identified in many areas of Bangladesh, and most of the rural people face serious environmental health hazards of As poisoning. According to UNICEF (2010), 12.6% of drinking water samples collected from nearly 13,000 households around the country did not meet the Bangladesh drinking water standard of As (≤0.05 mg/L). This is equivalent to approximately 20 million people being exposed to excessive quantities of As. The As poisoning problem is becoming more severe with time, but details of the As releasing mechanism have not yet been clarified. A possible mechanism of As contamination in water for streams in mountain areas is the weathering of As-rich minerals (McArthur et al., 2001). Harvey et al.
(2002) and Islam et al. (2004) suggested that the penetration of labile dissolved organic carbon compounds into the shallow aquifers by pumping for irrigation enhances the significant reduction of As-rich iron oxyhydroxides, thereby resulting in increased As concentration in groundwater.
36
Geochemical studies have suggested that the reducing condition of the subsurface aquifers and the reductive dissolution of As-rich iron oxyhydroxides through microbial oxidation of organic matter could be the dominant factor controlling As mobilization in groundwater (Anawar et al., 2003; Nickson et al., 2000). The microbial oxidation of organic matter coupled with the reduction of iron (III) to iron (II) appears to be an important process in the mobilization of As in a variety of subsurface environments. Iron- reducing bacteria may play a significant role in mobilizing As from As-rich iron oxyhydroxides and iron-arsenate minerals by direct reduction of iron (III) in sediments. It has been also observed that a great deal of chemical fertilizer is used for cultivating crops and vegetables in Bangladesh. Chemical N fertilizer application is considered a possible cause of As pollution in groundwater. According to Uddin and Kurosawa (2011), the groundwater, collected from the same area as the present study, showed to be in the reducing condition accompanied with high concentrations of As and ammonium-N, where the source of ammonium-N could be chemical N fertilizer.
Sharsha Upazila of southwestern Bangladesh, which is included in the present study area, is one of the most seriously As contaminated areas in Bangladesh (Rahman et al., 2006). There were 312 arsenicosis patients identified in 2003 in Sharsha Upazila, and the number of patients increased to 478 in 2008 (JICA/AAN, 2004; LGD/JICA, 2008), indicating a severe environmental health hazard problem in the area.
The sediment samples collected from the As-contaminated and non-contaminated areas were measured for As concentration, %C (organic matter) and %N. These values are supposed to play an important role in the release of As from peat sediments into groundwater. The stable isotope ratios of nitrogen (δ15N) and carbon (δ13C) were
37
measured to identify the origin of the C and N in the peat sediment. The specific objectives of this chapter are to clarify: (1) difference of As status of sediments between As-contaminated and non-contaminated villages, (2) the relationship of As-C-N in sediments, (3) the source of C and N and the chemical bond of As-C-N in peat sediment that has the highest As concentration among the sediments, and (4) the role of C and N in the release of As from peat sediment, respectively.
3.2 Results
3.2.1 Geological features of sediments
Figure 3.1 shows the geological profiles of the sediments from the ground surface to a 60 m depth at sites S1 through S5 in As-contaminated Samta Village. From Fig. 3.1, silty clay, clay, peaty clay and peat layers were mainly located within a 12 m depth from the ground surface at each site, and a sandy layer was located below this depth. A peat layer, with a thickness of 0.6-1.8 m, was located in the 6-9 m depth from the ground surface at sites S1, S3, S4 and S5, however at site S2 the peat layer was not observed until a depth of 60 m. At depths of deeper than 13 m, the sandy layer was more than 15 m thick at most sites, whereas the peat and peaty clay layers were less than 2 m thick. The peat or peaty clay layers were also located at a 36 m to 48 m depth at sites S1, S2, S3 and S5, but were not observed at site S4 at these depths.
38
The geological profile of non-As-contaminated Dhannokola Village is shown in Fig.3.2. Here, the sites are S6 and S7. In both S6 and S7, peat layer was not observed at any depth. Peaty clay layer was not observed either, but clay and silty clay layers were observed within a 6 m depth from the ground surface at sites S6 and S7. Thick sandy layer was observed below a 6 m depth, and a thin peaty clay layer was observed at the relatively deeper zone of 51 m and 28 m from the ground surface at sites S6 and S7, respectively.
39
S1 S2 S3 S4 S5
24 Depth (m)
3 6 9 12
27 15 18 21
33 36 39 42
57 60 51 45 48
Peaty-clay
SandClay Peat
54 30
Silty-clay
Figure 3.1 Geological profiles of the sediments in the As-contaminated village
40
S6 S7
Silty clay Peaty clayClay 60
SandLegend 54
57 48 51 42 45 36 39 30 33 24 27 18 21 12 15 6 9 Depth
(m) 3
Figure 3.2 Geological profiles of the sediments in the non-As-contaminated village
41
3.2.2 Arsenic status of sediments and relevant parameters
Figure 3.3 shows the As concentration of sediments at site S1 by depth. The As concentration varied with sediment and ranged from 34.9 mg/kg to 75.3 mg/kg for peat, 16.5 mg/kg to 19.8 mg/kg for peaty clay, 5.9 mg/kg to 15.6 mg/kg for clay, 1.7 mg/kg to 3.2 mg/kg for silty clay and 0.7 mg/kg to 2.8 mg/kg for sand. The As concentration of the peat sediment was higher by more than 3 times compared to that of the peaty clay sediment, which had the second highest As concentration among the sediments.
Although the sediments were collected from the five sites of S1-S5 in Samta Village, the As concentration in the sediments was measured only for the S1 site because the measurement took a long time and the S1 site can represent Samta Village because it is located at the middle of the village.
42 0
20 40 60 80
0 10 20 30 40 50 60
Depth (m)
As concentration (mg/kg)
Sand Silty Clay Clay Peaty Clay Peat
Figure 3.3 The As concentration of each sediment by depth at site S1
43
In Dhannokola Village, the maximum, minimum and average As concentrations of the sediment at site 6 are shown in Table 3.1. The As concentration of the peaty clay sediment was 6.9 mg/kg, that of clay ranged from 2.8 to 4.8 mg/kg, and that of sand ranged from 0.4 to 2.2 mg/kg; peat and silty clay layers were not observed. The average As concentrations of the sediments were in the order of peaty clay > silty clay > sand, and were nearly half of those corresponding sediments of site S1 in Samta Village (Table 3.3).
When the As concentrations of peaty clay and clay sediments are compared between the As-contaminated and non-contaminated villages, the As concentration of peaty clay and clay sediments were observed to be 2-3 times higher in the contaminated village than the non-contaminated village from Table 3.1 and Table 3.3.
Concen-
tration Param-eters Peat Peaty Clay Clay Silty Clay Sand
Min N.A. 6.9 2.8 N.A. 0.4
Max N.A. 6.9 4.8 N.A. 2.2
Ave N.A. 6.9 4.1 N.A. 0.6
n N.A. 1 7 N.A. 18
As (mg/kg)
Table 3.1 The concentration of As of each sediment at the S6 site of Dhannokola Village