Haptic Modulation of High-frequency Vibration
based on Human Perceptual Similarity
著者
Cao Nan
学位授与機関
Tohoku University
学位授与番号
11301甲第18767号
TOHOKU UNIVERSITY
Graduate School of Information Sciences
Haptic Modulation of High-frequency Vibration based on
Human Perceptual Similarity
(ヒトの高周波振動知覚の類似特性に基づく触覚変調)
A dissertation submitted for the degree of Doctor of Philosophy
(Information Science)
Department of Applied Information Sciences
by
Nan CAO
January 29,2019
Haptic Modulation of High-frequency Vibration Based on Human Perceptual Similarity
Nan Cao
Abstract
This study aims to investigate the human perception of high-frequency vibrations via the haptic modulation method. Haptic modulation is the modulation of the waveform of high-frequency vibrations while maintaining a similar tactile sensation to preserve the original tactile information. There are several issues caused by high-frequency vibrations. First, the available actuators used for generating the vibrations have a limited range of acceleration along the frequency; this means the available actuators may not be able to generate the necessary range of amplitude.. Second, the sounds of the vibration increases with frequency, and the sounds of high-frequency vibrations are loud. Haptic modulation could be a suitable solution for these issues. The purpose of this type of modulation is to maintain a similar envelope sensation while adjusting the carrier frequency to the appropriate frequency range. Tactile sensation shouldbe retained after the modulation. An example of application of haptic modulation is the teleoperation of construction robots. . However, envelop discrimination ability, envelop detection range, and the perceptual model of envelop sensation are some of the concepts of human perception that scientists do not fully understand.
With respect to continuous high-frequency vibrations, the perceptual characteristics of envelope and amplitude-modulated (AM) vibrations have been investigated by several researchers. The intensity of high-frequency vibrations (i.e., vibrations > 100 Hz), which is defined as the integral of the intensity of stimulus over time or the sum of the spectral power across all frequencies, has been identified as a primary cue with which to convey vibrotactile information as per the Pacinian system. However, the intensity is insufficient when interpreting the perception of an envelope of high-frequency vibration. Together, the intensity and envelope affect the ability of humans to discriminate high-frequency vibrations. In this study, we focus on investigating the perception of high-frequency vibration, especially the effects of envelope, intensity, and other factors on the perceptual similarity of collision vibration and amplitude-modulated vibrations. This study can contribute to the high-frequency perceptual characteristics and act as a guide for high-frequency vibration design in terms of the perceptual similarity.
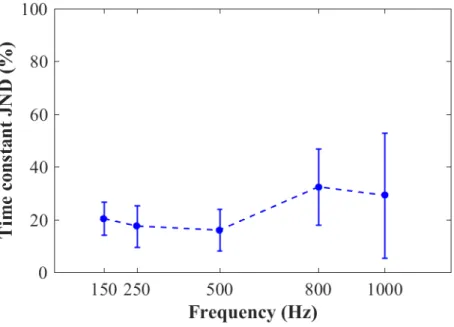
Firstly, we investigate envelope perception for one impulse vibration such as collision vibration. The experimental results of this investigation suggest that humans can perceive the envelope of vibration for a single pulse vibration such as collision vibration. Our results indicate that the discrimination of the envelope of collision vibration, the upper just-noticeable difference (JND) of time constant, increases marginally with an increase in frequency from 250 Hz to 1,000 Hz, and JND of time constant tends to increase for a smaller time constant. With respect to the discrimination of continuous amplitude-modulated vibration, our results indicated that a higher carrier frequency of periodic AM vibration shows a higher discrimination ability. These results contradict our assumption that a lower carrier frequency, which has a lower threshold, is more sensitive. In general, our investigation results suggested that humans can perceive the envelope for both single-impulse and continuous high-frequency vibrations. The ability of an envelope to discriminate a collision has not been investigated. We believe these results will contribute to the understanding of hardness discrimination by tapping and will help to find a suitable carrier frequency that enhances envelope perception.
Secondly, we introduce a time-domain segment to the intensity-based perception model. In particular, we investigate the discrimination ability of the reproduced, time-segmented waveform, which has the same intensity as that of the original vibration in each segment, to investigate the suitable segment size for the intensity-based modulation. The results suggest that the time-segmented intensity-based model can reproduce perceptually similar vibrations for the AM vibrations, as opposed to the conventional intensity-based model. Furthermore, we found that a small segment number of the envelope period (rs = 1/4)
transmission of high-frequency vibrations, especially AM vibrations.
Thirdly, we investigate the perceptual property of an envelope and the intensity that affects a persons ability to discriminate high-frequency vibrations, as well as the effects of carrier frequency on this ability. For the envelope frequency of an AM vibration ranging from 12–50 Hz, a higher degree of discrimination was observed compared to the sinusoidal vibration, while the intensity did not have a significant effect on the discrimination ability in this range. When the envelope frequency of an AM vibration is 125 Hz, a lower degree of discrimination occurred compared to the sinusoidal vibration. The boundary for the perception of an envelope is based on the envelope frequency (80–125 Hz). The intensity model works well in the higher envelope frequency ranging up to 125 Hz. However, when the intensity is the same, it is difficult to discriminate the vibration. We also found that the carrier frequency has little effect on discrimination of a vibration.
Finally, we developed a methodology for modulating noisy, high-frequency vibrotactile signals to noise-free, perceptually similar collision vibrations in the frequency range of 300–1,012 Hz. The results of this investigation suggest that the new modulation method can reduce the decibels of the collision vibration while preserving the perceptual quality. Additionally, the perceptual similarity stimuli occurred over broad ranges of amplitude and frequency.
This dissertation makes four majors contributions to the literature on high-frequency perceptual characteristics. First, our results reveal that humans can perceive both periodic and non-periodic, high-frequency vibration envelopes. Second, it introduces a time-domain segment to the intensity-based per-ception model and reproduced perceptually similar vibrations for the AM vibrations in contrast to the conventional intensity-based model. Third, it finds that the perceptual discrimination of the vibration has an envelope frequency dependence; the discrimination ability decreases as the envelope frequency in-creases. Fourth, it develops a methodology for modulating noisy and high-frequency vibrotactile signals to create noise-free, perceptually similar collision.
Contents
Contents iii
List of Figures vii
List of Tables xiii
1 Introduction 1
1.1 Background . . . 1
1.2 Human tactile sensation . . . 3
1.2.1 Human skin and receptors . . . 3
1.2.2 Exploration procedure . . . 4
1.3 Psychophysics of high-frequency vibration . . . 5
1.3.1 Basic psychophysical measurements of high-frequency vibration . . 5
1.3.2 Psychophysical modeling . . . 6
1.3.3 Envelope perception in previous studies . . . 7
1.4 Current issues concerning haptic modulation . . . 8
1.4.1 Envelope discrimination of high-frequency vibrations . . . 9
1.4.2 Sensitivity of periodical high-frequency vibrations . . . 10
1.4.3 Envelope perceptual boundary of the high-frequency vibrations . . . 10
1.4.4 Transmission of the high-frequency vibrations . . . 11
1.4.5 Sound of the high-frequency vibrations . . . 11
1.5 Research objectives and approaches . . . 12
1.5.1 Objectives . . . 12
1.5.2 Approaches to fulfill objectives . . . 12
1.6 Structure of the thesis . . . 14
2 Investigating the envelope discrimination ability of a high-frequency vi-bration 17 2.1 Introduction . . . 17
2.2 Objectives of the chapter . . . 18
CONTENTS
2.4 Study of envelope effect on collision vibration perception through
investi-gating just noticeable difference of time constant . . . 19
2.4.1 Specific objective . . . 19
2.4.2 Methods . . . 19
2.4.2.1 Materials . . . 19
2.4.2.2 Apparatus . . . 22
2.4.2.3 Subjects . . . 23
2.4.2.4 Tasks and procedures . . . 23
2.4.3 Results . . . 24
2.4.4 Discussions . . . 27
2.4.4.1 Sensitive frequency of time constant . . . 27
2.4.4.2 Time constant range effects on JNDs . . . 28
2.5 Frequency discrimination of amplitude-modulated vibration . . . 29
2.5.1 Specific Objective . . . 29
2.5.2 Methods . . . 29
2.5.2.1 Materials . . . 29
2.5.2.2 Apparatus . . . 29
2.5.2.3 Subjects . . . 31
2.5.2.4 Tasks and procedures . . . 31
2.5.3 Results . . . 31
2.5.4 Discussion . . . 33
2.6 Limitation of the study . . . 33
2.7 Summary . . . 34
3 Introduction of time-domain segment to intensity-based perception model of high-frequency vibration 37 3.1 Introduction . . . 37
3.2 Objectives of the chapter . . . 39
3.3 Significance of the Study . . . 40
3.4 Proposed Model . . . 40
3.5 Method . . . 41
3.5.1 Materials . . . 41
3.5.2 Participants . . . 42
3.5.3 Apparatus . . . 42
3.5.4 Tasks and procedures . . . 43
3.6 Results . . . 45
3.7 Discussion . . . 48
3.8 Limitation of the study . . . 49 iv
CONTENTS
3.9 Summary . . . 50
4 Dependence of Perceptual Discrimination of High-frequency Vibration on Envelope and Intensity Properties of Waveform 53 4.1 Introduction . . . 53
4.2 Objectives of the Chapter . . . 55
4.3 Significance of the Study . . . 55
4.4 Beats and Envelope Perception . . . 55
4.5 Related Intensity Models . . . 56
4.5.1 Power Intensity Model . . . 56
4.5.2 Mobile Intensity Model . . . 56
4.5.3 Spectral Intensity Model . . . 57
4.6 Methods . . . 57
4.6.1 Amplitude-modulated vibration . . . 57
4.6.2 Stimuli . . . 58
4.6.3 Apparatus . . . 63
4.6.4 Participants . . . 63
4.6.5 Tasks and procedures . . . 64
4.7 Results . . . 64
4.7.1 Discrimination between sinusoidal and AM vibrations at different intensity levels . . . 64
4.7.2 Discrimination between sinusoidal and AM vibrations of different carrier frequencies . . . 66
4.7.3 Discrimination of the AM vibration of different carrier frequencies . 67 4.7.4 Discrimination of the AM vibration of different intensity . . . 70
4.7.5 Comparing the stimuli with different envelopes and stimuli with the same envelope . . . 70
4.8 Discussion . . . 73
4.8.1 Perception of the envelope frequency . . . 73
4.8.2 Perception of intensity . . . 73
4.8.3 Perception of carrier frequency . . . 74
4.9 Limitation of the study . . . 74
4.10 Summary . . . 74
5 Perceptual Modulation Application: Sound reduction of vibration feed-back by perceptually similar modulation 77 5.1 Introduction . . . 77
5.2 Objectives of the Chapter . . . 78
CONTENTS
5.4 Experiment One: Investigating the perceptually similar collision vibrations 79
5.4.1 Stimuli . . . 79
5.4.2 Subjects . . . 81
5.4.3 Experimental Setup . . . 81
5.4.4 Tasks and Procedures . . . 81
5.4.5 Results . . . 82
5.5 Experiment Two: Comparing the perceptual similarity of the collision vi-brations . . . 83
5.5.1 Stimuli . . . 83
5.5.2 Subjects . . . 84
5.5.3 Experiment Setup . . . 84
5.5.4 Tasks and Procedures . . . 84
5.5.5 Results . . . 84
5.6 Experiment Three: Sound measurement of collision vibrations . . . 86
5.6.1 Experiment Setup . . . 87
5.6.2 Results . . . 87
5.7 Discussion . . . 88
5.8 Limitations of the study . . . 90
5.9 Summary . . . 90
6 Conclusions 93 List of Publications and Awards 99 Peer-reviewed Publications . . . 99 Non-peer-reviewed Publications . . . 100 Bibliography 101 Copyright Notice 109 Acknowledgements 111 vi
List of Figures
1.1 Two-point touch and point localization thresholds are shown for various body sites.[1] . . . 3 1.2 (a) Section of glabrous skin showing the physical location and classification
of various mechanoreceptors. (b) Tactile signal transmission from fingertips to somatosensory area of brain. (c) Functional events during tactile signal transmission from contact point to brain. Image is adopted from [2]. . . 4 1.3 Lateral motion EP and tapping or collide EP with their corresponding
high-frequency vibrations on the contact areas of human body or robot . . 5 1.4 Threshold frequency characteristics of vibration showing the directed
measured threshold: • • • and of the various channels: — Merkel Cells; -Meissner Corpuscle; – - – Pacinian Corpuscle [3]. . . 6 1.5 Relationship between perceived dissimilarity of fine texture-induced
vibra-tions and intensity dissimilarity DS1S2 by spectral intensity model is
ap-proximately linear. DS1S2 accounts for 81.6 % of the variance in perceived
dissimilarity [4]. . . 7 1.6 Detection threshold of 75 % correct performance was measured on the finger
pad [5]. . . 8 1.7 Original wave of high-frequency vibration. The red curve showed the
en-velope signal detected by the peaks the wave. . . 9 1.8 Envelope signal extracted by all the peaks of the original wave. . . 9 1.9 Changes in the envelope of the collision vibration by the time constant τ . 10 1.10 Imperceptible high-frequency envelope components could not be
main-tained. The red curve represents the envelope signal. . . 11 1.11 Improving the envelope extraction, a lower frequency carrier can be used
to preserve the envelope sensation. The red curve represents the envelope signal. . . 11 1.12 Time segments used to modulate the wave. The dashed lines are the
bound-aries of the segments. . . 12 2.1 Frequency characteristics of the vibrator from 10 Hz to 2,000 Hz . . . 20
LIST OF FIGURES
2.2 Time constant measured by piezo signal . . . 22 2.3 Distinguished time constant outside of the test range for the reference
stim-ulus frequency, 800 Hz, and the time constant, τo, is 30 ms. . . 22
2.4 Experimental apparatus. Actuator is suspended in air, and a subject gripped the actuator between the thumb and the index finger. . . 23 2.5 Reference 50 ms: average upper JND and standard error of time constant . 25 2.6 Reference 50 ms: average lower JND and standard error of time constant.
* p < 0.05, ** p < 0.01 . . . 25 2.7 Reference 10.8 ms: average upper JND and standard error of time constant 26 2.8 Comparison between upper JND of reference 50 ms, lower JND of reference
50 ms, and upper JND of reference 10.8 ms. *p < 0.05 . . . 27 2.9 (a) Participant perceiving vibrotactile stimulation generated by a vibrator 30 2.10 Vibrotactile stimulation represented by the combination of envelope and
carrier frequencies . . . 30 2.11 Maximum amplitude of the generated stimuli at different frequencies along
with the time constant. . . 34 3.1 Waveforms of the same segmental energy for different segment cases . . . . 39 3.2 Method processes: (a) The original vibration signal is segmented into small
pieces of time sets using time segment size tp in the time domain; (b) The
intensity of each segment is calculated by Eq. 3.1; (c) The amplitudes of each segment are calculated based on the energy in the original data using Eq. 3.2; and (d) The stimuli are reproduced using Eq. 3.3. . . 41 3.3 Measured displacement profile of stimuli . . . 43 3.4 Experimental apparatus: A participant presses their index finger pad on
the contact part of the actuator and rests their hand on the plate to stabilize the contact with the actuator. . . 44 3.5 Contact part between the index finger pad and the piezo vibrator . . . 44 3.6 Relationships between the discrimination ratio and the segment ratio under
different combinations of the carrier and envelope frequencies . . . 45 3.7 Relationships between the discrimination ratio and the segment ratio under
different combinations of carrier and envelope frequencies . . . 46 3.8 Relationships between the discrimination ratio and the segment ratio under
different combinations of carrier and envelope frequencies . . . 46 3.9 Relationships between the discrimination ratio and the segment ratio under
different combinations of carrier and envelope frequencies . . . 47 3.10 Relationships between the discrimination ratio and the segment ratio under
different combinations of carrier and envelope frequencies . . . 47 viii
LIST OF FIGURES
3.11 Relationships between the discrimination ratio and the segment ratio under different combinations of carrier and envelope frequencies . . . 48 3.12 Measurement of the wave of stimuli by the accelerometer when the actuator
was pressed with a constant force of 0.5 N . . . 50 3.13 Different ratios of the amplitude of waves were measured with the
ac-celerometer when the finger was pressing on the actuator compared to the generated wave without contact force . . . 51 3.14 Compared results between the conditions (fc, fe, rs) = (300, 15, 1/6) and
(fc, fe, rs) = (600, 15, 1/6). No significant difference was observed. . . 51
4.1 Interpolated amplitude threshold (AT ) based on experimental measure-ments of the five subjects listed in Table 4.2. The results are denoted by the blue circles with a standard error of mean (SEM). The interpolated curve is described by log(AT (f )) = a + be−(f +c)2d , in which a, b, c and d
were the fitting parameters. . . 61 4.2 Exponent a(f ) [4] fitted using values listed in Table 4.2. The results are
indicated by the blue circles. The fitting curve was based on the equation, a(f ) = kf + c, in which k and c were the fitting parameters. . . 61 4.3 Examples of stimuli waves measured by the laser sensors. (a) Stimuli pair
number 9 on the Table 4.3; (a) Stimuli pair number 21 on the Table 4.4; (c) Stimuli pair number 39 on the Table 4.5; . . . 62 4.4 Subjects place their hand on the plate and contact the actuator with their
finger . . . 63 4.5 Sensitivity d0 of a comparison between the stimuli with an envelope
fre-quency fe1 = 0 Hz and different envelope frequencies fe2 from 12–125 Hz
at an intensity I = 25. Here, *p < 0.05, **p < 0.01, ***p < 0.001, and the error bars represent the standard error of the mean. . . 65 4.6 Sensitivity d0 of a comparison between the stimuli with an envelope
fre-quency fe1 = 0 Hz and different envelope frequencies fe2 from 12–125 Hz
at an intensity I = 50. Here, *p < 0.05, **p < 0.01, ***p < 0.001, and the error bars represent the standard error of the mean. . . 65 4.7 Sensitivity d0 of a comparison between the stimuli with an envelope
fre-quency fe1 = 0 Hz and different envelope frequencies fe2 from 12–125 Hz
at an intensity I = 75. Here, *p < 0.05, **p < 0.01, ***p < 0.001, and the error bars represent the standard error of the mean. . . 66
LIST OF FIGURES
4.8 Sensitivity d0 of a comparison between the stimuli with an envelope fre-quency fe1 = 0 Hz and different envelope frequencies fe2 from 12 to 125 Hz
and the same carrier frequency fc = 300 Hz. The intensity conditions are
I = 25, 50, and 75. There are significant differences between I = 25 and I = 75 at fe = 80 Hz, and between I = 25 and I = 75 at fe = 125 Hz.
Here, *p < 0.05, **p < 0.01, ***p < 0.001, and the error bars represent the standard error of the mean. . . 66
4.9 Sensitivity d’ of the comparison between the stimuli with an envelope fre-quency fe1 = 0 Hz and different envelope frequencies fe2 from 12–125 Hz.
The carrier frequency condition was fc1 = 300 Hz vs fc2 = 400 Hz and the
intensity was I = 50. Here, *p < 0.05, **p < 0.01, ***p < 0.001, and the error bars represent the standard error of the mean. . . 67
4.10 Sensitivity d0 of a comparison between the stimuli with an envelope fre-quency fe1 = 0 Hz and different envelope frequencies fe2 from 12–125 Hz.
The carrier frequency was fc = 400 Hz and the intensity was I = 50. Here,
*p < 0.05, **p < 0.01, ***p < 0.001, and the error bars represent the standard error of the mean. . . 68
4.11 Sensitivity d0 obtained from comparing the stimuli with an envelope fre-quency fe1 = 0 Hz and different envelope frequencies fe2 from 12–125 Hz.
The carrier frequencies were fc1 = fc2 = 300 Hz, and fc1 = 300 Hz, fc2 =
400 Hz, and fc1 = fc2 = 400 Hz, which are represented by the red circles,
blue squares, and black triangle, respectively. Significant differences were observed between fc1 = f c2 = 300 Hz and fc1 = fc2 = 400 Hz at fe =
125 Hz. Here, *p < 0.05, **p < 0.01, ***p < 0.001, and the error bars represent the standard error of the mean. . . 68
4.12 Sensitivity d0 of the comparing stimuli with the same envelope frequency fe1 = fe2 from 12–125 Hz and two carrier frequency fc1 = 300 Hz vs fc2 =
400 Hz. The intensity conditions are I = 25, 50, and 75 shown by the red circle, blue square, and black triangle respectively. *p < 0.05, **p < 0.01, ***p < 0.001. The error bars represent the standard error of the mean . . . 69
4.13 Sensitivity d0 of a comparison between stimuli with the same envelope fre-quency fe1 = fe2 from 12 to 125 Hz and different carrier frequencies fc1 =
300 Hz vs fc2 = 400 Hz. The intensity conditions were I = 25, I = 50 and
I = 75. Here, *p < 0.05, **p < 0.01, ***p < 0.001. . . 69 x
LIST OF FIGURES
4.14 Sensitivity d0 of the comparative stimuli with the same envelope frequency fe1 = fe2 from 12– 125 Hz and different intensities I = 35, 50 and 75. The
different intensity conditions are I1 = 25 vs I2 = 50 , I1 = I2 = 50, and
I1 = 50 vs I2 = 75 shown as the red circle, blue square, and black triangle
respectively. *p < 0.05, **p < 0.01, ***p < 0.001. The error bars represent the standard error of the mean. . . 70 4.15 Sensitivity d0 of comparing all stimuli with the same envelope frequency,
fe1 = fe2, from 12–125 Hz and different intensities I = 35, 50 and 75. The
different intensity conditions are I1 = 25 vs I2 = 50 , I1 = I2 = 50, and I1
= 50 vs I2 = 75. *p < 0.05, **p < 0.01, ***p < 0.001. . . 71
4.16 Sensitivity d0 of a comparison between the stimuli with envelope frequen-cies, fe1= fe2, from 12 to 125 Hz. The cases for different envelope frequency
are denoted with red circles while those when the envelope frequencies were the same are denoted with blue squares. The carrier frequencies were fc1 =
fc2 = 300 Hz and fc1 = 300 Hz, fc2 = 400 Hz, respectively. The intensities
were I = 25. Here, *p < 0.05, **p < 0.01, ***p < 0.001, and the error bars represent the standard error of the mean. . . 71 4.17 Sensitivity d0of a comparison between the stimuli with envelope frequencies
fe1 = fe2 from 12–125 Hz. The cases for different envelope frequencies are
denoted with red circles while those when the envelope frequencies were the same are denoted with blue squares. The carrier frequencies were fc1 =
fc2 = 300 Hz and fc1 = 300 Hz, fc2 = 400 Hz, respectively. The intensities
were I = 50. Here, *p < 0.05, **p < 0.01, ***p < 0.001, and the error bars represent the standard error of the mean. . . 72 4.18 Sensitivity d0of a comparison between the stimuli with envelope frequencies
fe1 = fe2 from 12–125 Hz. The cases for different envelope frequencies are
denoted with red circles while those when the envelope frequencies were the same are denoted with blue squares. The carrier frequencies were fc1 =
fc2 = 300 Hz and fc1 = 300 Hz, fc2 = 400 Hz, respectively. The intensities
were I = 75. Here, *p < 0.05, **p < 0.01, ***p < 0.001, and the error bars represent the standard error of the mean. . . 72 5.1 Experimental stimulus example: A = 13.4 µm, τ = 5 ms, f = 450 Hz . . 80 5.2 Wave of collision vibration measured by a laser sensor . . . 81 5.3 Relationship between the input voltage and the maximum amplitude of the
measured wave . . . 82 5.4 Subject resting the arm on a foam with the piezo actuator fixed to the palm 83
LIST OF FIGURES
5.5 Correct answer ratio for subjects judging the comparing reference stimulus 6 µm and 300 Hz, and the perceptually similar stimuli of frequency ranging from 300–1,012 Hz. . . 85 5.6 Correct answer ratio for subjects judging the comparing reference stimulus
12 µm and 300 Hz, and the perceptually similar stimuli of frequency ranging from 300–1,012 Hz. *p < 0.05 . . . 85 5.7 Correct answer ratio for subjects judging the comparing reference stimulus
6 µm and 450 Hz, and the perceptually similar stimuli of frequency ranging from 300–1,012 Hz. . . 86 5.8 Correct answer ratio for subjects judging the comparing reference stimulus
12 µm and 450 Hz, and the perceptually similar stimuli of frequency ranging from 300–1,012 Hz. . . 86 5.9 The sound pressure meter is on a box at a height of 35 cm from the actuator.
The actuator is placed on a rubber plate. The experiment is conducted in an anechoic room. . . 87 5.10 A-weighted sound pressure levels of the reference stimulus 6 µm and 300
Hz, and the perceptually similar stimuli of frequency ranging from 300– 1,012 Hz. . . 88 5.11 A-weighted sound pressure levels of the reference stimulus 12 µm and 300
Hz, and the perceptually similar stimuli of frequency 300–1,012 Hz. . . 88 5.12 A-weighted sound pressure levels of the reference stimulus 6 µm and 450
Hz, and the perceptually similar stimuli of frequency 300 Hz–1012 Hz. . . . 89 5.13 A-weighted sound pressure levels of the reference stimulus 12 µm and 450
Hz, and the perceptually similar stimuli of frequency 300–1,012 Hz. . . 89
List of Tables
2.1 Stable range of time constant . . . 21
2.2 Lower JND of reference 50 ms: Result of a multiple-comparison test per-formed using the Bonferroni method . . . 26
2.3 Stimulus sets . . . 31
2.4 Answer ratio for stimulus set 1. ∗∗:p < 0.01. . . 32
2.5 Answer ratio for stimulus set 2. ∗:p < 0.05. . . 32
2.6 Answer ratio for stimulus set 3. ∗ ∗ ∗:p < 0.001, ∗∗:p < 0.01. . . 32
2.7 Answer ratio for stimulus set 4. ∗:p < 0.05. . . 32
4.1 Coefficients of the Psychophysical Intensity Model [6] . . . 56
4.2 Amplitude thresholds and exponents of the sinusoidal waves for the differ-ent frequencies . . . 58
4.3 Stimuli parameters: Pairs of stimuli comparing different intensities of si-nusoidal and AM waveforms, when I1 = I2 . . . 59
4.4 Stimuli parameters: Stimuli pairs comparing sinusoidal and AM waves of different carrier frequencies fc1 6= fc2 . . . 59
4.5 Stimuli parameters: stimuli pairs comparing AM waves with different car-rier frequencies fc1 6= fc2 and different intensity levels. . . 60
4.6 Stimuli parameters: Stimuli pairs comparing AM waves with same envelope frequencies, fe1 = fe2, and different intensities, I1 6= I2. . . 60
5.1 Parameters of the reference stimuli and the test stimuli in experiment 1 . . 80
5.2 Amplitudes of the test stimuli exhibiting the most similarity to the reference stimuli . . . 83
Chapter 1
Introduction
1.1
Background
Haptic technology aims to emulate or enhance the tactile experience of manipulating or perceiving real or virtual contact stimuli through mechatronic devices and computer controls. Conventional human–machine interactions are visual and auditory. Recently, many researchers have noted the importance of haptics in the interaction between hu-mans and robots [7, 8, 9, 10], as well as huhu-mans and virtual reality (VR) environments [11, 12, 13, 14, 15]. Haptic technologies combine the sense of touch to help the users to have a more realistic, immersive experience while remotely interacting with machines and virtual environments and help them work more efficiently. Teleoperated robots are benefi-cial in that they can reach treacherous and/or narrow spaces while being controlled by an operator from a remote location. The use of teleoperation for robots dates back to nuclear research the 1930s and 1950s [16] wherein Goertz et al. created systems with robots that could be operated by human operators to handle radioactive material from behind the shielding walls of a reactor. However, because of the lack of stimuli, these operations took longer and felt inconvenient. Later, Goertz et al. built a master–slave robotic systems to help operators employ more natural hand gestures. The systems transmitted forces and contact vibrations to the operator to reduce the difficulties during teleoperation. The application of haptic technologies for teleoperation to other fields such as space, medicine, and underwater projects began in the 1980s and 1990s. In the early 1990s, a dual-arm, force reflecting, telerobotic system was built by Bejczy et al. [17] at National Aeronautics and Space Administration (NASA)s Jet Propulsion Laboratory (JPL) for space applica-tions. Kuchenbecker et al., [18] measured the tactile vibrations induced by the contact between the tools and objects and found that the haptic devices immediately recreate the vibration on the master handles for the surgeon to perceive. Their augmentation method enables surgeons to perceive the rough texture feelings of the contact surfaces and the start and the end of the contact, as well as other tactile events, when using the system to manipulate objects.
1. INTRODUCTION
High-frequency vibrations play an essential role in producing tactile sensation. Hap-tic sensation marks contact activities between the human body and the object, or the tool-mediated activities with the kinesthetic information (e.g., low-frequency forces) and vibrotactile information (e.g., high-frequency vibrations). In [19], Kuchenbecker et al. suggested that high-frequency vibration feedback could improve the realism in touch sen-sations on haptically rendered surfaces. They demonstrated this by considering the tap-ping on a wood surface holding a pen-shape tool, each collides during the taptap-ping event creating sudden transient acceleration signal with a frequency of up to several hundreds of Hertz. The sudden high-frequency vibration signal was overlaid with traditional force feedback for its short duration. When compared to the conventional force feedback, the new feedback only needed to be fed with high-frequency vibrations to increase realism in touch response. These high-frequency contact vibrations provide richer information on the material properties of the contact object, such as hardness of the contact surface [20]. This study focuses on the haptic modulation of high-frequency vibrations and con-siders haptic modulation as the modulation of the waveform of a high-frequency wave while maintaining similar tactile sensation to preserve the original tactile information. There are several issues with modulating high-frequency vibrations using conventional methods. First, the available actuators used for generating the vibrations have a limited range of acceleration along the frequency, i.e., a large amplitude of the high-frequency vibration cannot be generated by using available actuators. Second, sound increases with frequency, and the sound from a high-frequency vibration is loud. Haptic modulation can be a suitable solution for these issues. Modulation of high-frequency vibration is achieved by maintaining the similarity of envelope sensation while adjusting the carrier frequency to the suitable frequency range. The tactile sensation should be maintained after the modulation. An example of the application of haptic modulation methods was the tele-operation of a construction machine [21]. Because a construction machine is accompanied with several haptic interactions, such as digging holes and handling heavy loads, the lack of tactile output is a serious disadvantage for teleoperation. The stiffness of a robots chassis may be high, and the frequencies of the contact vibration are often higher than the perceivable somatosensory range of the human body. If the haptic system transmits the contact vibration directly to the operators, the operators cannot perceive the contact sensation. The purpose of the modulation was to maintain the envelope signal while shift-ing the imperceptible high-frequency carrier to the human bodys perceivable frequency range. The results demonstrated that the modulated waves perceived upon contacting different materials are distinguishable and suggested that the envelope contains the nec-essary tactile contact information. However, the understanding of human perception of high-frequency vibrations are still under investigation. The study in this thesis aims to investigate human perception for supporting the rendition of high-frequency vibrations.
1. Introduction
1.2
Human tactile sensation
1.2.1
Human skin and receptors
The skin on different parts of the human body have different sensitivities. Figure 1.1 shows the two-point touch and the point localization thresholds for different parts of the body. The two-point touch threshold representing the smallest spatial separation can be detected between two different stimuli applied on the skin. For example, the threshold of the fingertip is 2–4 mm, while it exceeds 40 mm for the back. When evaluating the point-localization threshold, a stimulus is applied to the skin of humans subjects and a second stimulus may or may not be applied at the same point in succession. The subjects answer whether they feel the two stimuli at the same location. In general, the point-localization thresholds are lower than the two-point touch thresholds (e.g., 1–2 mm on the fingertip).
Figure 1.1: Two-point touch and point localization thresholds are shown for various body sites.[1]
Generally, there are two types of human skin: hairy skin and glabrous skin (also called no-hair skin). Glabrous skin is found on the palm of the hand, as well as the fingertips and foot soles. Both types of surfaces have a layered structure. Figure 1.2 (a) shows the cross-section view of the smooth, glabrous skin of the fingertip of humans. Tactile receptors are located from the border of the epidermis and the dermis to the subcutaneous tissue. There are four types of mechanoreceptors: slowly adapting type 1 (SA1), or Merkel’s disks; slowly adapting type 2 (SA2), or Ruffini corpuscles; rapidly adapting type 1 (RA1), or Meissner corpuscles; and rapidly adapting type 2 (RA2), or Pacinian corpuscles. Their classifications (types, adaption rate, spatial acuity, threshold, frequency range, conduction velocity, effective stimuli, and sensory function) are described in Figure 1.2(a).
When the skin is stimulated, a series of complex mechanical, perceptual, and cognitive phenomena will occur. As shown in Figure 1.2(b), the related information is transmit-ted to the central nervous system (CNS) for higher-level processing and interpretation, majorly via two pathways: spinothalamic and dorsal-column-medial lemniscus (DCML).
1. INTRODUCTION
The spinothalamic pathway carries temperature and pain-related information. DCML, on the other hand, conveys pressure/vibration-related information to the brain and helps to compare the spatial and temporal information on stimuli. Figure 1.2(c) showed a sequence of events during tactile transmission.
Figure 1.2: (a) Section of glabrous skin showing the physical location and classification of various mechanoreceptors. (b) Tactile signal transmission from fingertips to somatosen-sory area of brain. (c) Functional events during tactile signal transmission from contact point to brain. Image is adopted from [2].
1.2.2
Exploration procedure
Human tactile sensory information is derived from the mechanoreceptors and ther-moreceptors across the surface of the body. Lederman and Klatzky classified six EPs as lateral motion EP, pressure EP, static contact EP, unsupported holding EP, enclosure EP (global shape), and contour EP (exact shape), while some other researchers also men-tioned tapping or collide EP in [22, 23, 20]. In these seven basic EPs, lateral motion EP and tapping or collide EP induce high-frequency vibrations on the contact areas of a human body or a robot. These EPs are as follows:
1. The lateral motion EP is the lateral movement between the skin and an objects surface, i.e., rubbing or scratching. Typically, the fingers rub back and forth across an area
1. Introduction
on the surface. During the stick-slip transition [24], continuous high-frequency vibrations with the envelope are generated.
2. The tapping or collide EP is that a finger or the hand moves up and down contacting a surface of the object. Typically, tapping occurs when the finger or the hand contacts the surface of the object. Tapping can sense the hardness of the contacted surface. During the tapping motion, single-impulse collision vibrations with a damping envelope are generated.
Figure 1.3: Lateral motion EP and tapping or collide EP with their corresponding high-frequency vibrations on the contact areas of human body or robot
1.3
Psychophysics of high-frequency vibration
In this study, we aim to understand the perceptual characteristics of high-frequency vibration in the haptic modulation method. Psychophysical investigations are connecting human sensation to the physical parameters of the stimuli. It mainly focuses on the detection and discrimination of the vibration and contributes to its modeling. These investigations help determine the parameters suitable for generating the vibration.
1.3.1
Basic psychophysical measurements of high-frequency
vi-bration
Psychophysical measurements are an essential source for defining the requirements of sensors and actuators. A considerable number of stimuli for the sense of vibration are still under investigation. For high-frequency vibration, parameters such as amplitude, frequency, and duration of stimuli play a significant role in creating the sensation. There are two essential parameters of the necessary psychophysical measurements: threshold, which decides whether a stimulus can be perceived, and just-noticeable difference (JND),
1. INTRODUCTION
which measures whether the differences between stimuli can be perceived.
One of the basic measurements of human perception, the amplitude threshold (AT), is defined as the minimum amplitude of the stimulus barely perceivable to a human being. Previous studies have shown that the human detection threshold curve for sinusoidal vibrations and the thresholds depend on the frequency related to the activities of the receptors. The measurements of ATs are shown in Figure 1.4.
Figure 1.4: Threshold frequency characteristics of vibration showing the directed mea-sured threshold: • • • and of the various channels: — Merkel Cells; - - - Meissner Corpuscle; – - – Pacinian Corpuscle [3].
The JND is a measuring of the minimum difference between two stimuli, which could be necessary for a human being to reliably perceive. JND is conventionally measured for the force feedback. In the early 19th century, Weber et al. measured JNDs of roughly 10 % in experiments involving the active lifting of 2-oz weights by the hand and arm [25]. Hatzfeld et al., measured the JNDs of vibrotactile force amplitudes in a bandwidth of 5-1,000 Hz. The measuring of the AT and JNDs can contribute to the designing of haptic vibrations, such as data reduction through signal sampling [26, 27].
1.3.2
Psychophysical modeling
Many researchers are working on modeling the intensity of high-frequency vibrations(> 100 Hz), which is generally regarded as the integral of stimulus intensity over time or the spectral power summed across all frequencies. This intensity has been considered to be a primary cue in conveying vibrotactile information perceived by the Pacinian sys-tem [28, 29, 30, 4]. Makous et al. [28] modeled the intensity as a function of spectral power divided by the corresponding threshold power related to the frequency of the wave. Bensmaia et al. enhanced the ability of the intensity model as a spectral model to
1. Introduction
terpret the perceptual similarity of stimuli with spectral characteristics based on the psychophysical and neurophysiological findings [30]. Bensmaia et al. also improved the intensity model based on the spectral model to infer the perceptual dissimilarity of the finely textured stimuli [4], as shown in Figure 1.5.
Figure 1.5: Relationship between perceived dissimilarity of fine texture-induced vibra-tions and intensity dissimilarity DS1S2 by spectral intensity model is approximately linear.
DS1S2 accounts for 81.6 % of the variance in perceived dissimilarity [4].
1.3.3
Envelope perception in previous studies
In [31, 32], researchers found that a human being can perceive the low-frequency envelope of an amplitude-modulated (AM) vibration even when the carrier frequency is above the perceivable frequency range. In addition, Lim et al. [5] found that humans can perceive beats for the envelope frequencies from 2.5–10 Hz, and the ratio of beats detection threshold ATB(f ) to amplitude thresholds AT (f ) decreases from 20 to 1.25 as
carrier frequency increases from 63.1 Hz to 398 Hz. Figure 1.6 shows the beats detection threshold was measured on the finger pad. They also found that when fc is increased, the
beats can be perceived for very low envelope frequencies and closer to the AT of sinusoidal vibration. These results suggest that humans can perceive the envelope of high-frequency vibrations.
There are many applications that the envelope plays an important role in that require the forming of sensation of modulated vibrations and vibration patterns, which are used to generate the textures of message or tactile messages. Decaying sinusoidal waves applied
1. INTRODUCTION
Figure 1.6: Detection threshold of 75 % correct performance was measured on the finger pad [5].
to the skin have been used to indict the roughness or collisions in a virtual environment [24, 33]. In [34], Ahmaniemi et al. applied modulated vibrations to render the texture of a contact surface. Image-based tactile vibration are used modulated vibrations to render different contact surfaces in a flat tablet [35]. Vibration patterns are widely used for tactile generation in VR environments [34] for supporting the teleoperation of robots [36, 37]. Takenouchi et al., [21] extracted the envelope of a high-frequency vibration for which the carrier frequency was above the range of human perception.
Currently, psychophysical measurements are primarily on the threshold and JND of amplitude or frequency of a sinusoidal wave. Detection and discrimination for envelope perception have not been fully investigated yet. The current psychophysical intensity models focusing on the intensity or spectral intensity information have not been successful in interpreting the perception of the envelope of high-frequency vibrations either. The range of intensity models that can predict the perceptual discrimination may be affected by the envelope. Therefore, The understanding of the effect of an envelope on human perception is needed for further investigation of the intensity models.
1.4
Current issues concerning haptic modulation
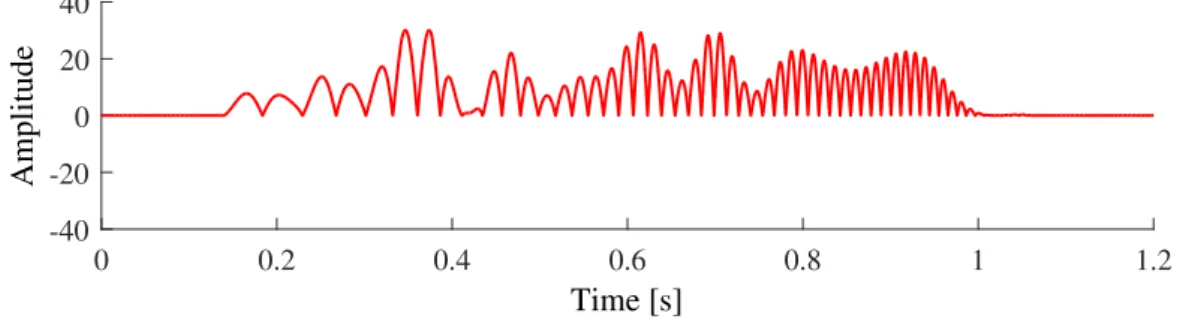
This study aims is to investigate the human perception of high-frequency vibration through the haptic modulation method for the high-frequency vibrations. Humans can perceive the vibration envelope, which contains information on contact characteristics such as material properties. The proposed method modulates the envelope of an original vibrotactile signal to enhance the perceptual feeling of the transmitted vibration applied in [21]. The original wave is shown in Figure 1.7 and the envelope extraction is shown in
1. Introduction
Figure 1.8. However, the previous studies could gather little knowledge of the perceptual characteristics of the envelope of high-frequency vibrations. Therefore, this study is to bridge this knowledge gap and focus on investigating the perceptual characteristics of the envelope. To the best of our knowledge, these investigations can improve our modulation method for the design of teleoperation of a construction machine and devices in other applications that use the high-frequency vibration feedback.
0 0.2 0.4 0.6 0.8 1 1.2 Time [s] -40 -20 0 20 40 Amplitude
Figure 1.7: Original wave of high-frequency vibration. The red curve showed the envelope signal detected by the peaks the wave.
0 0.2 0.4 0.6 0.8 1 1.2 Time [s] -40 -20 0 20 40 Amplitude
Figure 1.8: Envelope signal extracted by all the peaks of the original wave.
1.4.1
Envelope discrimination of high-frequency vibrations
Several researchers have found that humans can perceive the envelope of high-frequency vibration. This thesis examines the perceptual discrimination ability of high-frequency vibrations and the effect of carrier frequency on a humans ability to discriminate a vibra-tion envelope. One of the high-frequency vibravibra-tions with an envelope is the single-impulse collision vibration. In [38], Okamura found that amplitude, frequency, and time constant τ work together to emulate the hardness of tapping. The time constant τ is a parameter that decides the envelope shape of collision vibration, as shown in Figure 1.9. The dis-crimination ability of the envelope of collision has not been examined yet. By knowing the discrimination ability and carrier frequency effect of the collision vibration, collision vibration can be modulated for various applications, e.g., sound reduction.
1. INTRODUCTION
Figure 1.9: Changes in the envelope of the collision vibration by the time constant τ .
1.4.2
Sensitivity of periodical high-frequency vibrations
For the transmission of high-frequency vibrations, the proposed method preserves the envelope of the original vibrotactile signal to enhance the perceptual feeling of the trans-mitted vibration. The carrier frequency is modulated for enhancing the perception and the carrier frequency range that is sensitive enough for human perception is estimated. This will contribute to finding the carrier frequency suitable for envelope perception en-hancement.
1.4.3
Envelope perceptual boundary of the high-frequency
vi-brations
The intensity of high-frequency vibrations (i.e., vibrations > 100 Hz) has been identi-fied as a primary cue with which to convey the vibrotactile information as per the Pacinian system. However, the intensity itself is insufficient when interpreting the perception of a high-frequency vibration envelope. The intensity and envelope together affect the ability of humans to discriminate high-frequency vibrations. Park et al.[39] found that AM vibra-tions at a very high frequency envelope are similar to sinusoidal vibravibra-tions (fe = 0), which
suggests that when the envelope frequency is high, the beats cannot be perceived and the waveform is therefore perceptually similar to vibrations without an envelope frequency. For the teleoperation of a construction machine, one of the modulation procedures is to extract the envelope. However, it is not known which envelope frequency range is suitable for maintaining. By investigating the boundary where the envelope has a strong impact on vibration discrimination, the extraction of envelope signal of modulation in the teleop-eration system can be guided. By knowing the perceivable envelope frequency range, the envelope of frequency lower than the boundary can be preserved and a relatively lower carrier could be used for the modulation. We can improve the envelope extraction as executed in the example shown in Figure 1.10, which compares the extraction of all the envelope signals shown in Figure 1.8. After improving the envelope extraction, a lower frequency carrier can be used to preserve the envelope sensation, as shown in Figure
1. Introduction
1.11. It may contribute toward reducing the difficulties in generating the high-frequency vibration and the sound of the vibration.
0 0.2 0.4 0.6 0.8 1 1.2 Time [s] -40 -20 0 20 40 Amplitude
Figure 1.10: Imperceptible high-frequency envelope components could not be maintained. The red curve represents the envelope signal.
0 0.2 0.4 0.6 0.8 1 1.2 Time [s] -40 -20 0 20 40 Amplitude
Figure 1.11: Improving the envelope extraction, a lower frequency carrier can be used to preserve the envelope sensation. The red curve represents the envelope signal.
1.4.4
Transmission of the high-frequency vibrations
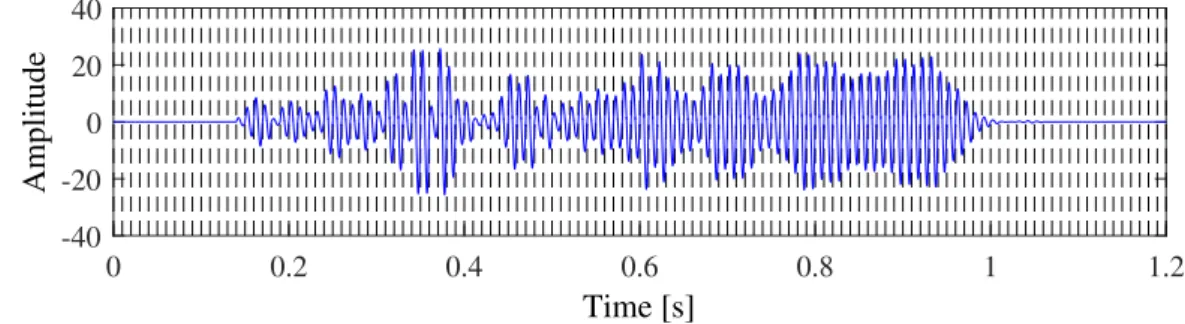
The intensity of high-frequency vibration can help predict the perceptual differences of fine texture vibrations. However, if the vibration has a low-frequency envelope, the intensity itself cannot interpret the perceptual similarity. The intensity change (caused by the envelope modulation) in the time domain may also affect the human perception. The high-frequency vibration is transmitted in packets. We want to investigate how the perceptual characteristic of a vibration can be affected by these packets. We introduce the segment in the time domain to analyze the psychophysical characterization of AM vibration using its intensity and frequency information. As shown in Figure 1.12, the wave is modulated from the wave of Figure 1.11 in the segments of the time domain. It will contribute to the transmission of high frequencies, especially the AM vibrations with the envelope sensation.
1.4.5
Sound of the high-frequency vibrations
The high-frequency vibrations introduce noise in the audible range. For example, a loud sound generated by the haptic feedback system will occur in the teleoperation of a construction machine, when a high-frequency vibration is generated[21]. The sound
1. INTRODUCTION 0 0.2 0.4 0.6 0.8 1 1.2 Time [s] -40 -20 0 20 40 Amplitude
Figure 1.12: Time segments used to modulate the wave. The dashed lines are the bound-aries of the segments.
level of the vibrations increases with frequency when the amplitude is constant [40]. It is necessary to establish a modulation method that can reduce the sound while preserving perception.
1.5
Research objectives and approaches
1.5.1
Objectives
The broader objectives of this thesis are to investigate the human perceptual charac-teristics of the high-frequency vibration concerning the haptic modulation method And the relationships between the intensity, the envelope, and the perceptual discrimination of high-frequency vibrations.
To achieve these objectives, we set the following specific objectives:
• We investigate the human envelope detection ability of the impulse envelope of a high-frequency collision vibration and periodic high-frequency AM vibration. • We introduce the time segment to the intensity model for reproducing the
percep-tually similar vibration from the original high-frequency AM vibration, which has a low-frequency envelope.
• Measuring the boundary where the envelope has a strong impact on vibration dis-crimination. In addition, the effects of the carrier frequency and intensity on the discrimination was also investigated.
• Investigating the envelope modulation of high-frequency vibrations to the percep-tually sound reduction of high-frequency collision vibrations for the users in the teleoperating system and VR environment.
1.5.2
Approaches to fulfill objectives
The general research methodology of the thesis is divided into four parts. Specific techniques employed in each section are detailed as follows.
1. Introduction
1) Investigating the envelope discrimination ability of the high-frequency vi-bration
In this study, we investigated the discrimination ability of the envelope perception of single-impulse, high-frequency collision vibrations by measuring the JNDs of time con-stant. Here, JNDs are frequently measured to evaluate the discrimination ability of the differences of the target parameters. Several studies have measured the JNDs of the amplitude (e.g. [41, 42] ) and frequency (e.g. [43, 44]) of sinusoidal vibrations. The re-lationships between hardness perception and mechanical parameters, including the time constant, have been investigated; however, perceptual resolutions for the time constant are yet to be investigated. We investigated the JND of time constant at several different frequencies. Generally, the most sensitive frequencies for human beings are in the range 200–300 Hz; hence, for the time constant, the highest perceptual resolution (lowest JND) range may also be in the range of 200–300 Hz. High frequencies like 1,000 Hz are not per-ceived by humans, and the JNDs of time constants in high-frequency waves are expected to be high. By investigating JND of time constants, we can find how it will change with frequency, for example, in which frequency range the JND of time constant will be the lowest or highest, whether the JND of time constant was linearly changed by frequency and if not in which frequency range the JND of time constant changed most rapidly. 2) Investigating the time unit of integrating the intensity for the high-frequency vibration of a time-variant envelope.
We introduce a time-domain segment to the intensity-based perception model and in-vestigate the discrimination ability of the reproduced, time-segmented waveform that has the same intensity as the original vibration on each segment, as a pilot study to determine the suitable segment size for the intensity-based modulation. This study targets the AM high-frequency vibrations (carrier frequency fc= 300 or 600 Hz) that have relatively low
envelope frequencies (fe =15, 30, or 45 Hz). To simplify the experimental conditions, we
incorporated several assumptions:
1. The original and reproduced vibrations have identical carrier frequency.
2. The stimulus energy is the general integral power of vibration displacement in the time domain.
We aim to verify whether the segmented intensity model can reproduce similar per-ceptual vibrations and what could be the proper segment size for the model.
3) Measuring the boundary where the envelope has a strong effect on discrim-inating vibrations and the effects of carrier frequency and intensity
The intensity of high-frequency vibrations (i.e., vibrations > 100 Hz), which is gen-erally defined as the integral of the intensity of stimulus over time or the spectral power summed across all frequencies, has been identified as a primary cue that helps convey
1. INTRODUCTION
vibrotactile information as per the Pacinian system. However, the intensity model is in-sufficient when interpreting the perception of a high-frequency vibration envelope. The intensity and envelope together affect the ability of humans to discriminate high-frequency vibrations.
We ran an experiment to assess the discrimination ability of subjects exposed to sinusoidal and AM vibrations of different envelope frequencies, carrier frequencies, and intensity levels using the intensity model developed in previous studies. This allowed us to investigate the effect of intensity and envelope on a human beings ability to discriminate high-frequency vibrations. Our results revealed the envelope frequency dependence of perceptual discrimination of the tested stimuli, where the ability to discriminate increased with the envelope frequency.
4) Apply the modulation of high-frequency vibration to realize the perceptual sound reduction
For perceptually reducing the sound, we focus on modulating the high-frequency col-lision vibration that occurs when we tap on the surface of the object by hands or tools. In [33], Okamura et al. found that the perception of collision vibration can be modeled by using three parameters (amplitude A, frequency f, and time constant t) of their decay-ing sinusoidal model. It can generate the perception of tappdecay-ing different materials such as wood, metal, and rubber. Our modulation method aims to use perceptually similar low-frequency collision vibrations to represent high-frequency collision vibrations, which is assumed to reduce the sound. We conducted a psychophysical experiment to adjust the amplitude of low-frequency test collision vibrations to produce a sensation as close to that provided by the reference high-frequency collision vibrations as possible.
1.6
Structure of the thesis
The thesis is composed of six chapters. To the best of the authors knowledge, these are original contributions in envelope sensation of the high-frequency vibrations.
In Chapter 1, the background and the objective of this study are presented. The needs of haptic feedback and an introduction to haptics was described at Section 1.1. The exploration procedure that induces tactile vibration, the function of mechanoreceptors in human skin, and the sensation of high-frequency vibrations were described in Section 1.2. Basic psychophysics measurements and modeling for high-frequency vibrations were described in Section 1.3. The research objectives and approach are described in Section 1.4.
In Chapter 2, by investigating the JND of time constant, we could find the degree of sensitivity of the envelope for human beings and whether this degree would be changed by frequency. In addition, we also conduct the preliminary experiment to investigate the envelope and carrier discrimination of the AM vibration. The AM vibrations have different carrier frequencies with frequency less than 1 kHz, which is supposed to be in
1. Introduction
the somatosensory range of frequency for human beings and frequencies higher than 1 kHz, which are beyond this range.
In Chapter 3, we find the boundary for the perception of the envelope and investigate the intensity and carrier effect on human beings ability to discriminate high-frequency vibrations. We conduct a psychophysical experiment using the amplitude-modulated vibration of different envelope frequency and intensity. By comparing the AM vibration with the sinusoidal vibration at different intensity conditions, we intend to find how the similarity between the two vibrations varies. By comparing the vibrations of different envelopes and vibrations of the same envelope, we aim to examine the effect of envelope on perception. By comparing the stimuli at different intensities, we aim to investigate the effect of intensity on perception. In addition, we also verify the effect of carrier frequency on discrimination.
In Chapter 4, we introduce a time-domain segment to the intensity-based perception model. In particular, we explore the discrimination ability of a reproduced time-segmented waveform that has the same intensity as that of the original vibration on each segment, as a pilot study to determine the suitable segment size for the intensity-based modulation. This study targets the AM high-frequency vibrations (carrier frequency fc = 300 or 600
Hz) that have relatively low envelope frequencies (fe = 15, 30, or 45 Hz). We found that
a small segment number of the envelope period (rs = 1/4) could emulate the perception
of the AM vibration in the experiment.
In Chapter 5, we develop a methodology for modulating noisy and high-frequency vibrotactile signals to noise-free, perceptually similar collision vibrations in the frequency range of 300 Hz–1,012 Hz. Firstly, we conduct a psychophysical experiment to adjust the amplitude of low-frequency test collision vibrations to produce a sensation as close to that provided by the reference high-frequency collision vibrations as possible. Secondly, we verify whether a human could perceive the difference between the perceptually similar collision vibrations obtained. Thirdly, we measure the sound pressure level of the exper-imental collision vibrations at different frequencies. besides reducing the sound level, we can also reduce the frequency of collision vibrations to maintain a similar sensation.
Chapter 2
Investigating the envelope
discrimination ability of a
high-frequency vibration
2.1
Introduction
Humans can perceive the frequency of AM) vibrations even when the carrier frequency is higher than their perceivable somatosensory frequency range [31, 32]. These findings reveal that humans can perceive the envelope of continuous AM sinusoidal vibrations. Regarding the continuous high-frequency vibrations, the perceptual characteristics of an envelope and a carrier of vibrations have been investigated in earlier studies [31, 32]; however, those characteristics for one-impulse high-frequency vibrations such as a collision vibration have not yet been investigated.
The high-frequency collision vibrations occur when we tap a surface and its waveform helps us to perceive the different characteristics of the contact materials. The perceptual characteristics of collision vibrations, which contribute to the discrimination of tapped surfaces, have been investigated [38] to virtually represent collision sensation by simu-lating transient collision vibrations. Okamura et. al [38] parametrically modeled collision vibrations in which the amplitude, the frequency, and the time constant (which present the shape of the envelope) partially reflect the materials. Okamura et al. used the model to present the collision vibrations by the frequencies that differ from the measured fre-quencies of vibrations. These frefre-quencies enabled people to distinguish materials [33]. This collision vibration model, which is combined with kinesthetic force displays, has been used to represent hardness sensations that are stronger than the limited levels of hardness in the force devices [19]. In the transient collision vibration, the role of frequency has been investigated. These studies found that higher frequencies in the model led to the perception of a greater level of hardness.
2. INVESTIGATING THE ENVELOPE DISCRIMINATION ABILITY OF A HIGH-FREQUENCY VIBRATION
model, have not yet been thoroughly investigated.
Our study in this chapter is to investigate the degree of sensitivity of the human beings discrimination ability, and the effect of varying carrier frequencies on this ability. The investigation is conducted by measuring the JND of time constant. Here, JND is frequently used to evaluate the perceptual resolutions for target parameters, as several studies found for the amplitude (e.g. [45]) and frequency (e.g. [44]) of periodic vibrations. The relationships between hardness perception, and mechanical parameters including time constant have been investigated [46, 22]; however, the perceptual resolutions for the time constant have been investigated.
To efficiently generate the collision vibrations induced by tapping, we need to inves-tigate the perceptual resolutions for the parameters of the models. For example, we can produce the perceptually different collision vibrations by using two perceptually different time constants from the generated model based on its perceptual resolutions.
We investigated the JND of time constant at several different frequencies. Generally, the most perceived frequencies for humans lie in the 200–300 Hz range; hence, for the time constant, the highest perceptual resolution (lowest JND) range may also be in the 200–300 Hz range. High frequencies like 1,000 Hz are not perceivable to humans and the JNDs of time constant are expected to be high. By investigating the JND of time constant, we can find how it will be affected by frequency; for example, in which frequency range the JND of time constant will be the lowest or highest, whether the JND of time constant was linearly changed by frequency, and if not, in which frequency range the JND changes most rapidly.
In addition, a human being can perceive the frequency of AM sinusoidal vibration even when the carrier frequency is higher than the perceivable frequency range [31, 32]. It suggests that humans can perceive the envelope of high-frequency vibration. In this chapter, we also conduct the preliminary experiment to investigate the envelope and carrier discrimination of the AM) vibration. The AM vibration has a different carrier frequency less than 1 kHz, which is in the perceivable frequency range, and a frequency higher than 1 kHz, which is beyond the range. We aim to know whether there is a possibility that these two types of carrier frequencies will induce a different discrimination ability of human. The work in this chapter was published in [47, 48].
2.2
Objectives of the chapter
As mentioned earlier, several studies have found that humans can perceive the enve-lope of frequency vibration. However, this perceptual ability to discriminate high-frequency vibration envelope are not quantified. This ability plays an important role in generating tactile vibrations especially for virtual texture or collision vibration rendering. We investigated the ability to detect an envelope of the one-pulse high-frequency collision vibration and continuous high-frequency AM vibration.
The objectives of this chapter are:
• To investigate how much is the discrimination ability of the envelope of the vibration especially for the one pulse vibration such as collision vibration.
• To find whether the carrier frequency range will affect the ability to discriminate the envelope difference.
2.3
Significance of the Study
By understanding the ability of a human being to discriminate an envelope, we can find whether the envelope can be considered for designing the artificial tactile vibration or understanding the perception of tactile vibration. Primarily, we aim to know whether the envelope of the tactile vibration could help humans to discriminate a short, one-impulse vibration such as collision vibration. This can help us to design a short-duration collision on a human–tactile interface that supports VR experience or teleoperation. The high-frequency vibration can be regarded as both carrier signal and envelope signal. If the carrier can affect envelope discrimination, we can find the suitable carrier frequency that helps accurately discriminate the envelope difference by the modulation. If the carrier does not affect the envelope discrimination, we can shift the carrier frequency but still preserve the envelope sensation by modulation. A lower carrier frequency could reduce the difficulties of generating high-frequency vibration and reduce its sound.
2.4
Study of envelope effect on collision vibration
perception through investigating just noticeable
difference of time constant
2.4.1
Specific objective
By measuring the JNDs of time constant, we can find whether collision vibration will be affected by the carrier frequency. For example, in which frequency range the JND of time constant will be the lowest or highest, whether the JND of time constant was linearly altered by frequency, and if not, in which frequency range the JND of time constant changed most rapidly.
2.4.2
Methods
2.4.2.1 Materials
• Decaying sinusoidal vibration
The collision vibration feedback model developed from the measured data is a de-caying sinusoidal waveform[38], where Q(t) is the vibration produced by contact, A is the attack amplitude, τ is the time constant, and f is the frequency.
2. INVESTIGATING THE ENVELOPE DISCRIMINATION ABILITY OF A HIGH-FREQUENCY VIBRATION
Q(t) = Ae−τtsin(2πf t) (1)
Assuming the observed amplitude changes with a change in time constant, a dynamic amplitude was applied to keep the maximum value of the waveform a constant. This process eliminated the possible perception difference caused by the amplitude. When Q0(t0) = 0 and t0 = tan−1(2πf τ )/2πf , Q(t0) = Q0 is the maximum value
of the waveform. The maximum value Q0 is set to a constant value. Finally, the
collision vibration model after amplitude is
P (t) = Q0
e−t0τ sin(2πf t0)
e−τtsin(2πf t) (2)
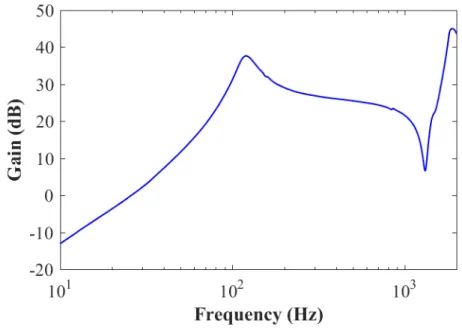
In addition, the generated vibrations cannot reflect the vibratory input profiles of signals because of the frequency characteristics of a voice coil actuator apparatus. Therefore, we preliminarily analyzed the frequency characteristics of the actuator and then modified the input signals using the frequency characteristics to generate the desired output. The frequency characteristics of the actuator was measured and its result are shown in Figure 2.1.
Figure 2.1: Frequency characteristics of the vibrator from 10 Hz to 2,000 Hz
• Time Constant
The time constants of the vibrations were measured by the output signal from a piezo sensor rather than by the input signal. As shown in Figure 2.2, function y = A ∗ e−τt was found by a least-square fit to all the positive and negative peaks
in the waves of the vibrations. The absolute maximum amplitude value of the 20
Table 2.1: Stable range of time constant Frequency (Hz) Lower boundary (ms)
150 10.8
250 5.6
500 5
800 2.4
1000 8
waveform was set as the starting point for fitting the function. Figure 2.2 shows that time constant τ reflected the envelope shape of the stimuli (matching the peak values). When τ is longer, the envelope shape of stimuli is smoother, and when τ is smaller, the envelope shape is steeper.
The input time constant τi and output time constant τo were measured in five
iterations and the standard errors of five times τo were calculated. The test time
constants were used only when the standard errors were less than 5% of the average value. The input values were tested several times. These measured values linearly interpolated other time constants. In addition, the lower boundaries of the time constant at different frequencies are shown in Table. 2.1.
To obtain the JNDs at all the test frequencies, a relatively high time constant of 50 ms was used based on the preliminary experiments. The lower reference of time constants was not chosen in this experiment because some of the subjects were unable to distinguish the time constants at certain frequencies, and an example of this is shown in the test range in Table. 2.1. One of the results obtained using the experimental procedures in this research is shown in Figure 2.3. While the reference time constant was 30 ms and the frequency of vibration was 800 Hz, the possible distinguished time constant could not be derived owing to the limited low boundary of the time constant 2.4 ms.
• Just Noticeable Difference of time constant
This psychophysical parameter is defined by Webers Law as the detectable difference between a reference stimuli and test stimuli. JND of time constant in this research was calculated as following,
J N D = |τt− τo| τo
× 100 (3)
Where the τt is a time constant of the test stimuli and τo is a time constant of the
reference stimuli. Both sides of the JNDs were investigated in this research. When the test time constant is lower than the reference time constant, the calculated JND is called lower JND. When the test time constant is higher than the reference time
2. INVESTIGATING THE ENVELOPE DISCRIMINATION ABILITY OF A HIGH-FREQUENCY VIBRATION
Figure 2.2: Time constant measured by piezo signal
0 10 20 30 40 50 Trail number 2 4 6 8 10 12 14 Time constant (ms)
Figure 2.3: Distinguished time constant outside of the test range for the reference stimulus frequency, 800 Hz, and the time constant, τo, is 30 ms.
constant, the calculated JND is called upper JND.
2.4.2.2 Apparatus
As shown in Figure 2.4, a subject gripped the actuator between the thumb and index finger to perceive collision vibrations while the gripped normal force was being measured. The test apparatus comprised an actuator (Vp210, ACOUVE LABORATORY, INC., JAPAN), an amplifier, and a computer. The actuator was suspended in air by a sewing thread. A force sensing resistor was attached to the center of the actuator to measure the force by which the subjects gripped the actuator.
The generated waves of the actuator were measured by a piezoelectric vibration sensor 22
![Figure 1.1: Two-point touch and point localization thresholds are shown for various body sites.[1]](https://thumb-ap.123doks.com/thumbv2/123deta/5908610.1050021/20.892.172.725.451.706/figure-point-touch-point-localization-thresholds-shown-various.webp)
![Figure 1.6: Detection threshold of 75 % correct performance was measured on the finger pad [5].](https://thumb-ap.123doks.com/thumbv2/123deta/5908610.1050021/25.892.163.739.104.445/figure-detection-threshold-correct-performance-measured-finger-pad.webp)