Evaluation of Household Solid Waste Treatment Alternatives toward GHG Mitigation in Vietnam
ベトナムにおける温室効果ガス削減に向けた家庭系廃棄物の処理手法に関する評価
August 2018
LE HOANG SON
Graduate School of Environmental and Life Science
OKAYAMA UNIVERSITY
ABSTRACT
Rapid urbanization, economic growth, and changing life style have led to a drastic increase in the amount and the variety of municipal solid waste (MSW) in Vietnam. . Household solid waste (HSW) has become a major challenge for waste management authorities in urban areas of developing countries. The total amount of collected municipal solid waste in Vietnam was estimated to be 15.6 million tons as of 2015, of which 71.1% (11.1 million tons) was directly landfilled, and the total solid waste generated in 2020 and 2025 are expected to be approximately 67.6 million tons, and 91 million tons, respectively. To establish sustainable society, the central government and local government in Vietnam have established various kinds of laws and regulations. According to the national strategy to manage waste and discarded material (Decree no. 38/2015/NĐ-CP) issued by Vietnamese central government in 2015, the daily-life solid waste must be sorted and collected separately by three categories:
biodegradable organic, reusable and recycled, and other.
To develop a rational strategy of waste management toward sustainable society, it is important to understand the amount of waste generation, the waste composition, the waste stream,and the contribution by each source. However, the reliable data on MSW in Vietnam are limited and not comparable; because of the main categories of waste classification are variety between municipal, region levels and national levels. Some past literatures examined the waste generation from HSW by detailed categories and estimated the total waste amount; but the waste generation rates (WGRs) was described by mean and standard deviation, without mention about the distribution and reliability of data. In addition, waste treatment technologies such as incineration, composting, bio-gasification have been not applied successfully in Vietnam due to lack of technical attention, lack of feasibility study for local waste such as waste generation, characterization, waste practice at source. Implementation of waste separation at source is also a cause of ineffective treatment application. Therefore, the study on HSW characteristic with the influencing factors and the efficiency of waste treatment alternatives is meaningful for waste management authorities. The limited reliable data on HSW generation and characteristics has become a burden for decision makers in waste management. It is important to understand the amount of waste generated, the waste composition, and the waste treatment alternatives as the first step in developing an effective HSW strategy that includes 3R promotion (reduce, reuse, and recycle).
This dissertation focuses on (1) waste generation and characteristic from household in urban areas in Danang, the third largest city in Vietnam, (2) Greenhouse gas (GHG)
emissions and reduction of heat recovery technology in Japan, and (3) GHG emission and reduction of recycling technologies. The author presents the following issues: (i) HSW generation and composition in Danang (physical composition, basis composition, recovery potential by detailed composition, and energy content); (ii) Influence factors for HSW generation(iii) Estimation of total household solid waste generation and recycling potential;
(iv) GHG emission and reduction heat recovery technology in Japan and modeling; (v) Scenario analyses on GHG mitigation alternatives by heat recovery and recycling; (vi) Interval estimation and uncertainty analysis of parameters.
First, to understand the characteristics of HSW, the author conducted surveys of 150 households in Danang, Vietnam in December 2016. The target samples were selected by consideration of socioeconomic factors, such as urbanization level, population density, family size and income level. Daily discharged waste from each target was collected and classified into ten physical categories and 66 sub-categories. The compositions of ten physical components were analyzed to identify the moisture content, volatile solid content, and ash content. Meanwhile, the heating values of these components were also examined at laboratory to estimate the energy content in HSW. The recycling and composting potentials were aggregated based on the detail composition by 66 sub-categories. The average HSW generation rate was 231.5 g/cap/day. For ten physical waste compositions, the food waste accounted the highest proportion (68.23%), followed by plastic (10.95%) and paper (9.40%).
The composting potential and recycling potential accounted for 72.73% and 13.77%, respectively. The average moisture content, volatile solid content, and ash content were 45.16%, 42.75%, and 12.08%, respectively. The energy content of household solid waste was calculated to be 6,801 kJ/kg, which was acceptable for incineration treatment processes.
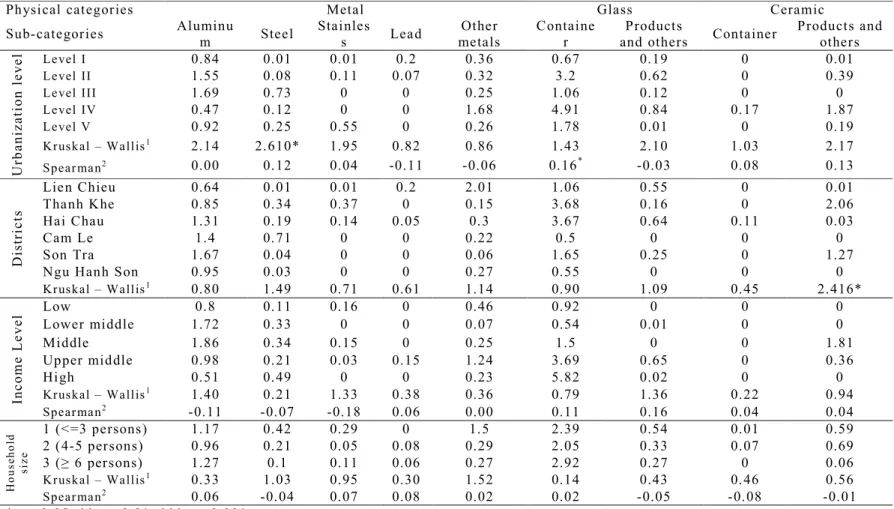
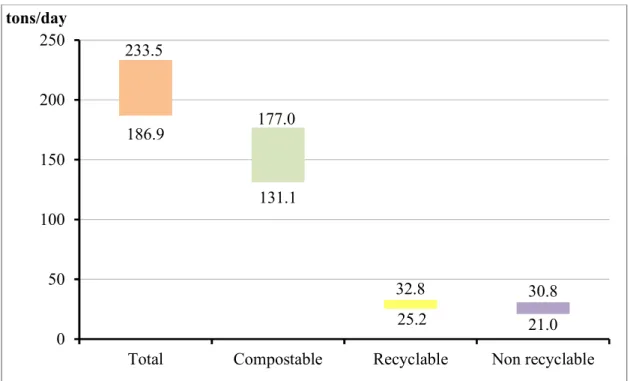
Second, the author analyzed the relations between HSW generation rates and influence factors by physical categories and sub-categories by non-parametric methods. The positive correlations between waste generation rates (WGRs) and urbanization level, population density, income level were indicated by rank correlation analysis. On the other hand, the WGRs were negatively correlated with family size. Factors significantly affecting WGRs were also discussed by Kruskal-Wallis H test. Based on the WGRs and population in Danang, the total HSW amount in urban areas was estimated to be 210 tons/day, and the 95%
confidence interval was estimated to be 187 – 234 tons/day by non-parametric bootstrap method. Compostable waste, Recyclable waste and Non-recyclable waste were 155 tons/day (131 – 177 tons/day, 95%CI), 29 tons/day (25 – 33 tons/day, 95%CI), and 26 tons/day (21 – 31 tons/day, 95%CI), respectively. The expected revenue from recyclable contained in HSW
was estimated to be 79 million VND/day (71 – 89 million VND/day, 95%CI), which was equivalent to 716 labors to be employed by the minimum wage standard. The sensitivity analysis shows that kitchen waste generation rate had highest contribution to the variance of total estimation of waste. Further study should focus on kitchen waste to improve the reliability of estimation.
Third, in order to understand the Waste-to-energy technology, the author aims to estimate the detailed composition of GHG emissions and reductions from the waste incineration facility and their influence factors using two Japanese databases on the operation of incinerators from Japan Ministry of the Environment (1,243 facilities) and Japan Waste Research Foundation (814 facilities). The databases cover detailed data on MSW amount and characteristics, specifications of the facility, annual utility consumption, and annual energy/material recovery. The authors analyze the correlations among them and develop predictive models for the detailed components of GHG emissions and reductions. Japan Ministry of the Environment intended to group small municipalities for replacing small-scale incinerators to large-scale waste-to-energy (WtE) facilities with a higher energy recovery efficiency. Based on the abovementioned data and models, the authors estimate the expected effects of the block formation and major technological alternatives for GHG mitigation by the national level. The current net GHG emission rate from 1,243 operating waste incineration plants in Japan in 2009 was estimated to be 653 kgCO2e/t. By the block formation based on the master plans collected from 47 prefectures, 1,007 plants were assumed to be closed; 236 kept operating; and 286 facilities would be newly built. The net GHG emission rate could be cut off to 454 kgCO2e/t by applying the block formation and technological alternatives with a higher energy recovery efficiency (stalker furnace with power generation by extraction condensing turbine providing steam higher than 3MPa and 300 °C). Ash melting caused a larger GHG emission by the increase in energy consumption. The GHG reduction by slag recycling was limited. Furthermore, the net GHG emission rate could be reduced to 242 kgCO2e/t by applying the Best Available Technique (BAT) for combined heat and power plants. When compared with the current status, BAT can reduce 185 kgCO2e/t by improving the power generation efficiency and 187 kgCO2e/t by expanding heat utilization. At present, heat utilization is very limited in Japan, but heat utilization should be more focused and promoted for GHG mitigation decisions.
Finally, the contributions of household solid waste treatment alternatives to mitigate greenhouse gas emissions were investigated by various possible scenarios. The waste treatment alternatives included: (i) landfill without landfill gas recovery; (ii) landfill with
landfill gas recovery and power generation; (iii) Composting; (iv) Anaerobic digestion; (v) Incineration; (vi) Material recycling; (vii) Combination of different treatments. For business as usual scenario, the current GHG emission rate was estimated to be 1,242 kgCO2e per ton of waste (990 – 1,370 kgCO2e/t, 95%CI). The emission could be reduced to 426 kgCO2e/t (410 – 510 kgCO2e/t, 95%CI) by landfill recovery gas for power generation scenario. By assuming 70% of recyclables and food waste were separately collected for recycling and animal feeding, the GHG emission was estimated to be 274 kgCO2e/t (120 – 650 kgCO2e/t, 95%CI). Meanwhile, the GHG emission rates of composting and anaerobic digestion scenario were 408 kgCO2e/t (300 – 800 kgCO2e/t, 95%CI) and 223 kgCO2e/t (200 – 760 kgCO2e/t, 95%CI), respectively. The incineration is the best waste treatment alternative with 96 kgCO2e/t (80 – 150 kgCO2e/t, 95%CI). In addition, the results showed that the integrated HSW management considering material recycling, food waste separation for anaerobic digestion and waste-to-energy was the most favorable alternative for GHG mitigation, with GHG emission rate was estimated to be -5 kgCO2e/t (-50 – 90 kgCO2e/t, 95%CI).
The results of this dissertation suggested the methodology for household solid waste survey, the analysis and evaluation for household solid waste characteristics (waste generation rates based on types, purposes and functions, recovery material and energy contents). For waste to energy incineration, the heat utilization should be improved to enhance the efficiency of facility, as well as cut off the GHG emission. The findings in this study are expected to be useful for decision-makers, planners of 3R programs, authorities of waste management to improve the household solid waste management to achieve the sustainable development.
TABLE OF CONTENT
ABSTRACT ... i
LIST OF TABLE ... ii
LIST OF FIGURE... iii
LIST OF ABBREVIATIONS ... iv
1. INTRODUCTION ... 1
1.1.Research background ... 1
1.2.Objectives of study ... 5
1.3.Scope of study ... 6
1.4.Conceptual outline of the dissertation... 6
1.5.Reference ... 8
2. HOUSEHOLD SOLID WASTE GENERATION AND CHARACTERISTIC ... 10
2.1.Introduction ... 10
2.2.Methodology ... 11
2.2.1. Research area and target sample ... 11
2.2.2. Outline of survey... 12
2.2.3. Analytical procedure ... 16
2.3.Results and discussions ... 17
2.3.1. Waste generation and waste composition ... 17
2.3.2. Influence factors affecting WGRs ... 22
2.3.3. Estimation of waste generation ... 23
2.4.Conclusions ... 30
2.5.References ... 32
3. SCENARIO ANALYSIS ON GREENHOUSE GAS EMISSION FOR WASTE TO ENERGY ALTERNATIVES IN JAPAN ... 34
3.1.Introduction ... 34
3.2.Methodology ... 35
3.2.1. System boundary and calculation condition ... 35
3.2.2. Dataset on the incineration facility ... 36
3.2.3. Analytical procedure ... 36
3.3.Results and discussion ... 39
3.3.1. Outline of incineration in Japan in 2009 ... 39
3.3.2. Outline of combustible waste in Japan in 2009 ... 40
3.3.3. Utility consumption and influence factors ... 40
3.3.4. Energy/material recovery and influence factors ... 42
3.3.5. Mathematical modeling for utility consumption and energy recovery ... 46
3.3.6. Scenario analysis for the GHG emissions and reductions ... 49
3.4.Conclusions ... 56
3.5.References ... 58
4. HOUSEHOLD SOLID WASTE TREATMENT ALTERNATIVES TOWARD GREENHOUSE GAS EMISSION MITIGATION ... 61
4.1.Introduction ... 61
4.2.Methodology ... 62
4.2.1. System boundary and calculation condition ... 62
4.2.2. Scenario definition ... 68
4.3.Results and discussions ... 69
4.3.1. Waste quantity and composition ... 69
4.3.2. GHG emission and reduction ... 69
4.3.3. Scenario analysis on GHG emission mitigation ... 72
4.4.Conclusions ... 72
4.5.Reference ... 74
5. CONCLUSIONS AND RECOMMENDATIONS ... 76
5.1.Conclusions ... 76
5.2.Recommendations ... 79
LIST OF TABLE
Table 2-1. Characteristic of population density distribution of research area and sampling points ... 13
Table 2-2. List of ten physical categories and 66 sub-categories ... 15
Table 2-3. WGRs by ten physical category (g/cap/day) ... 18
Table 2 – 4. Detailed waste composition by subcategory ... 18
Table 2 – 5. Physical waste composition and energy content ... 20
Table 2 – 5. WGRs and influence factors by ten physical category ... 24
Table 2 – 6. WGRs and influence factors by sub-category ... 25
Table 2 – 7. Estimation of recyclable waste and revenue amount ... 27
Table 3-1. GHG emission factors applied in this study ... 38
Table 3-2. Outline of the operating incinerators in Japan (2009) ... 39
Table 3-3. Energy consumption rate by technological options ... 41
Table 3-4. Heat consumption by heat utilization ... 43
Table 3-5. Power generation rate and efficiency by major technological parameters ... 43
Table 3-6. Turbine generator efficiency (%) by steam condition and turbine type ... 46
Table 3-7. Definition of variables ... 47
Table 3-8. Results of the multilinear regression analyses for utility consumption ... 48
Table 3-9. Results of the multilinear regression analyses for energy consumption and recovery ... 48
Table 3-11. Number of WtE plants by the integrated waste management system ... 51
Table 3-12. Definition and technological condition of the scenarios ... 51
Table 3-13. Outline of the applied data for the scenario analysis ... 52
Table 3-14. Scenario estimation results of the GHG emission and reduction rates (kgCO2e/t) ... 55
Table 4-1. Scenario definition and assumption ... 63
Table 4-2. Calculation condition and emission factors ... 64
Table 4–3. Total GHG emission by waste treatment alternatives (unit: tCO2e) ... 70
Table 4-3. Waste quantity and composition for scenario analysis ... 71
LIST OF FIGURE
Figure 2-1. Research area and sampling points ... 12
Figure 2 – 2. Breakdown components of recyclable waste ... 20
Figure 2 – 3. Confidence interval estimation of HSW and its breakdown components ... 28
Figure 2 – 4. Confidence interval estimation of recyclable and its breakdown components ... 29
Figure 2 – 5. Confidence interval estimation of revenue from recyclable ... 29
Figure 2 – 5. Sensitivity analysis results of total waste generation ... 30
Figure 3-1. Distribution of steam condition and turbine type ... 45
Figure 4-1. System boundary for GHG estimation ... 62
Figure 4-2. GHG emission of waste treatment alternative and breakdown components ... 72
1 1. INTRODUCTION
1.1. Municipal solid waste in Vietnam: current status and challenges 1.1.1. General information
Municipal solid waste (MSW) is commonly regarded as the waste generated from residential, commercial, institutional, and municipal activities that are collected and treated by municipalities (Korner et al., 2006). Rapid economic growth recently has led to the phenomenon of “mass production, mass consumption, and mass disposal” in many major cities (Gu et al., 2017; Qu et al., 2009). The amount of MSW throughout the world has increased dramatically, which poses a potential threat of environmental degradation (McDougall et al., 2001; Pariatamby and Tanaka, 2014). MSW, thus, has been one of the key topics for environmental protection and resource utilization nowadays (Essonanawe et al., 2015; Korner et al., 2006; Thanh et al., 2010).
Population growth, urbanization and improving living standard have led to severe waste management problems in the cities of developing countries like Vietnam. Thanks to the widely used products made of plastic and diversified materials, the compositions of MSW are becoming more complex than ever (Pariatamby and Tanaka, 2014; Thanh et al., 2010).
It requires knowledge of what the wastes are comprised of, and how they need to be collected and treated properly (Kumar, 2016). However, it has been widely observed that the municipalities in Vietnam do not have adequate resources or the technical expertise necessary to deal with current issues.
Therefore, the reliable and scientific research on MSW is essential and meaningful for waste management authorities in Vietnam.
1.1.2. Waste generation rate
As a major source of MSW, household solid waste (HSW) is a generated part of daily life activities in urban areas. The household solid waste generation rates (WGRs) per capita per day in major cities in Vietnam have been increased rapidly by years (Byer et al., 2006; Thai, 2009; Thanh et al., 2010). The WGRs are significantly different among area, of which is very high at major cities such as Hanoi, Ho Chi Minh, Da Nang, Hai Phong, Can Tho, and much lower at rural areas. The WGRs range from 0.6 to 1.0 kg/cap/day at urban areas, with the
2
average of 0.814 kg/cap/day. In contrast, the WGRs in rural area are reported to range from 0.6 to 0.8 kg/cap/day with the average of 0.569 kg/cap/day (JICA, 2017)..
The WGRs are reported to be different among areas, due to the unified waste generation survey methods. The quality of waste generation data is highly affected by the sampling procedure. Solid waste sampling may often involve direct sampling, either at the source (e.g. household). Essonanawe et al., (2015) suggested that collecting waste directly from individual households with a certain household type allow the waste data to be more accurately attributed, reliable and associated to generating sources. Otoma et al., (2013) surveyed 50 households in Da Nang by not considering stratification criteria and reported that each resident generates on average 0.71 kg per day. Meanwhile, Thanh et al., (2010) observed 100 households in Can Tho by considering their respective urbanization levels and the geographical distribution and suggested that the average WGR is 285 g/cap/day.
In order to provide a reliable data on WGR, it is needed to conduct HSW generation survey with adequate sample size by considering stratification criteria such as the type of area, geographic location, and socio-economic differences (European Commission, 2004; Sharma and McBean, 2007). In addition, the uncertainty analysis should be carried out in order to evaluate the reliability of data.
1.1.3. Waste composition
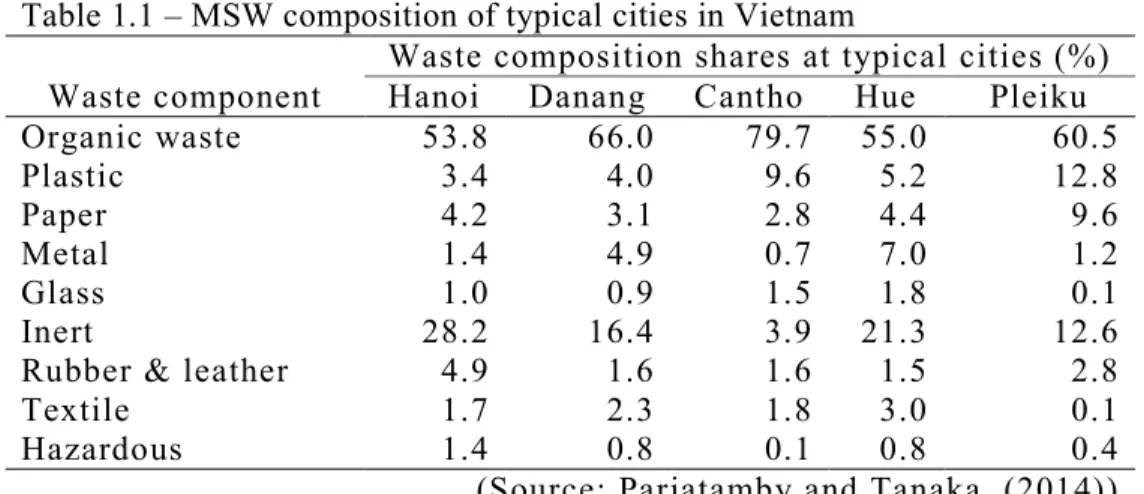
Accurate and reliable data on waste composition are crucial for planning and environmental assessment of waste management as well as for improvement of resource recovery in society. In Vietnam, the absence of national standards for solid waste characterization has led to a variety of sampling and sorting approaches, making difficulties to compare the results between municipalities (Pariatamby and Tanaka, 2014). The MSW composition in Vietnam is reported to be diverse, of which the organic waste is the major component (53.8% – 79.7%), followed by plastic (3.4% – 12.8%), and paper (2.8% – 9.6%) as shown in Table 1.1.
3
Table 1.1 – MSW composition of typical cities in Vietnam Waste component
Waste composition shares at typical cities (%) Hanoi Danang Cantho Hue Pleiku
Organic waste 53.8 66.0 79.7 55.0 60.5
Plastic 3.4 4.0 9.6 5.2 12.8
Paper 4.2 3.1 2.8 4.4 9.6
Metal 1.4 4.9 0.7 7.0 1.2
Glass 1.0 0.9 1.5 1.8 0.1
Inert 28.2 16.4 3.9 21.3 12.6
Rubber & leather 4.9 1.6 1.6 1.5 2.8
Textile 1.7 2.3 1.8 3.0 0.1
Hazardous 1.4 0.8 0.1 0.8 0.4
(Source: Pariatamby and Tanaka, (2014)) Inconsistencies among existing solid waste characterization study, e.g.
definitions of waste compositions, may cause confusion and limit comparability of waste composition data between studies. While Thanh et al., (2010) published a detailed waste composition for household waste, including 83 waste fractions by considering waste material, function, recycling potential, more transparent and flexible classification for the individual waste material fractions are needed to allow full comparability between studies with carrying numbers of material fractions and sorted objectives. In addition, the basis fraction (combustible, ash and moisture content) with heating value is essential for assessing the potential for energy recovery from waste. However, no scientific research on detailed HSW composition considering recycling potential including energy recovery has been carried out to date. Therefore, scientific HSW generation and composition studies with material/energy recovery potential are fundamental for improving the waste management system.
1.1.4. Waste treatment methods
Vietnam’s central government reported that the total amount of collected municipal solid waste in Vietnam was 15.6 million tons as of 2015, of which 28.9% (4.5 million tons) is treated in the intermediate treatment facilities and remaining 71.1% (11.1 million tons) is directly landfilled (JICA, 2017).
Regarding a report of Vietnam’s Ministry of Construction, there were 641 operating domestic waste treatment facilities in 48 cities/provinces in Vietnam.
Figure 1.1 shows the trend of newly constructed waste treatment facilities in Vietnam by year.
The common treatment method for MSW in Vietnam is landfilling. Among
4
hundred operating landfills, there are only 16 sanitary landfill sites, the remaining are open dumping sites or unsanitary landfills (Vietnam Government, 2011). Landfill sites without proper management such as the absence of leachate collection system, poor design of bottom layer, lack of daily cover layer have caused many serious problems to the environment and public health (McDougall et al., 2001). Landfills raise concerns over odor pollution in general, and recently, water pollution by untreated leachate in particular. At the global level, landfills release a large amount of methane gas, which has a high global warming potential. A recent estimation mentioned that the waste sector produced 4.1% of the total greenhouse gas (GHG) emissions from non-Annex I Parties, based on the latest available year (UNFCCC, 2008). Moreover, the disposal of recyclable together with other waste shortens the operating time of landfill as well as wastes society resources. Plastic bag and products can be easily recognized in all dumpsites in Vietnam (Pariatamby and Tanaka, 2014).
Source: (JICA, 2017) Figure 1.1 – Newly constructed MSW treatment facilities in Vietnam by year
Composting has been recently considered as a cost-effective method for MSW treatment. Composting can recover the organic component in MSW to produce a clean soil conditioner, which reduces the amount of MSW to be buried on a landfill site (Byer et al., 2006). The number of operating composting facilities has been increased about four times, from 11 facilities as of 2015 to 41 as of 2016 (JICA, 2017). However, most of composting facilities in Vietnam are
31
176 132 78 38
73
61 7
3 1
2
28 7
3 1
0 50 100 150 200 250 300
(2015-2016) (2010-2015) (2005-2010) (2000-2005) Before 2000
Facility Landfill
Incineration Composting
5
not operating at high efficiency because of the low quality of input material. The input waste is not well separated, and separation is done manually at the treatment facility. (Chi and Long, 2011; Vietnam Government, 2011). The composting of organic waste can be an appropriate technology in Vietnam only if waste can be separated at source properly (Pariatamby and Tanaka, 2014).
Since 2010, the number of waste incineration facilities in Vietnam has been increased rapidly (as shown in Figure 1.1) because of the advantage of this method such as waste volume reduction and energy generation. However, the reliable data of input waste for incineration is lacked due to the insufficient management. (Pariatamby and Tanaka, 2014).
The abovementioned difficulties and environmental impacts relating to MSW could be reduced by efforts both at source and by various techniques like material or energy recovery (Choe and Fraser, 1999). A comprehensive approach to MSW treatment alternatives is obviously needed for Vietnam’s government to establish the sustainable development for waste management in the year to come.
1.1.5. National strategy for integrated management of solid waste
To deal with the increasing problems related to MSW, the Government of Vietnam has considered enhancing the SWM through implementing waste separation at source (WSS). According to Decision No. 2149/QD-TTg on the national strategy for integrated management of solid waste up to 2025, with a vision to 2050, 85% of MSW would be recovered by recycling, composting and thermal recovery. Then, until 2025, the total recovery rate is targeted to be 90%
(Ministry of Construction and Environment, 2013). In addition, municipalities in Vietnam also need to introduce an integrated solid waste management with waste separation and environmentally friendly waste treatment technology (Chi and Long, 2011; Vietnam Government, 2011).
However, even though WSS is regulated, there is no law enforcement and no punishment-rewards system. Furthermore, lacked reliable data on waste characterization has made the target goal achievement challenge. The scientific data on waste composition with recycling potential is essential for municipalities to establish a feasible plan on waste management to fulfill their own target goal.
The techniques and management system of the MSW have changed dramatically, shifting from oversimplified procedures, such as collecting unsorted wastes first and then disposing them in landfills, to integrated and
6
sustainable methods that incorporate waste reduction practices, waste separation at source (WSS), material recycling techniques, biological and thermal processes for energy recovery, and landfill disposal (Pariatamby and Tanaka, 2014). Thus, Vietnam’s national strategy for integrated management of solid waste also considered that waste-to-energy would be the essential treatment method in the near future in major cities (Ministry of Construction and Environment, 2013).
However, there is no scientific study on the energy content of MSW in Vietnam up to date. Therefore, the study on evaluation of self-burning potential of MSW is needed to promote energy recovery techniques for waste treatment in Vietnam.
1.1.6. Waste-to-energy incineration technology under JCM project
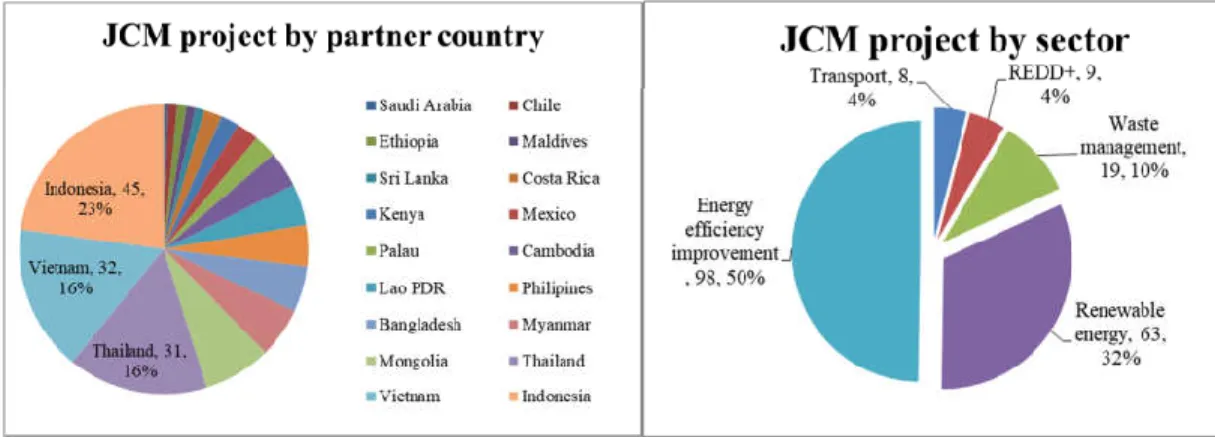
Waste-to-energy incineration technology has been widely used in major cities in developed countries thanks to its advantages such as minimizing the buried amount, controlling the sanitary condition, requiring small construction area, as well as energy recovery (Gabor Doka, 2005; Porteous, 2005; Xin-gang et al., 2016). Since the first introduced waste incineration in Japan in 1924, the waste incineration technology has developed and expanded over the years, and there are 1,243 operating incinerators for MSW in Japan as of 2012 (“Japan Ministry of the Environment database 2009 (In Japanese),” n.d.). To control the air pollution from the combustion process, many advanced technologies are applied to waste incineration facility. Consequently, the investment cost is too expensive for developing countries to cover it by themselves(Xin-gang et al., 2016). In order to support the implementation of the advanced low-carbon technologies, Ministry of the Environment, Japan (MOEJ) has established a financing program under JCM (Joint Crediting Mechanism) which covers up to half of the initial cost of projects that reduce GHG emission by utilizing leading low carbon technologies in developing countries. Figure 1.2 shows the summary of JCM projects by partner country and sector since 2013. Vietnam is considered as one of the most attracted partner countries for JCM project, with 32 projects in 198 projects.
JCM program is a great opportunity for waste management authorities in Vietnam to improve the current waste management system with advanced technologies from Japan. Therefore, a scientific study on GHG emission reduction by waste-to-energy incineration in Japan is needed in order to promote this advanced technology in Vietnam in the year to come.
7
Source: http://gec.jp/jcm/
Figure 1.2 – Summary of JCM projects by partner country and sector since 2013
1.1.7. Scenario analysis for sustainable waste management
One of the more basic requirements for waste planning, regardless of the type of treatment method to be selected, is that the proposed HSW management be viable. Viability can be evaluated by scenario analysis method with current information on waste generation (Unep, 2009). To evaluate the environmental impact from waste treatment alternatives, a scenario analysis by life cycle assessment (LCA) is widely used by Khoo, (2009); Kim and Kim, (2010); Lou et al., (2015); Ogino et al., (2007); Thanh and Matsui, (2013). LCA is an environmental management tool that attempts to predict the overall environmental burden of a product, service or function, and it can be applied to waste management system (McDougall et al., 2001).
In order to receive the financial support for advanced waste treatment technology transfer from Japan under JCM project, the LCA study on GHG emission from MSW in Vietnam is required. However, the study on GHG emission and reduction from MSW in Vietnam is still limited up to date due to the lack of reliable and scientific on waste data. Thanh and Matsui (2013) conducted a scenario analysis on GHG mitigation of waste treatment alternatives for eight major cities in Vietnam. The authors estimated GHG emission and reduction from severe waste treatment practice with referred waste composition data. However, the uncertainty of input data and the sensitivity analysis were not mentioned and discussed in the previous study. Thus, the scenario analysis on GHG mitigation considering decision factors with reliable waste composition data should be carried out in order to provide more scientific information for
8 waste management authorities.
1.1.8. Challenges of waste management
The remaining issues of solid waste management in major cities in Vietnam can be summarized as follows:
Environmental issues
- Improper treatment practices cause a serious impact on the local environment, especially the underground water.
- A large amount of methane gas, having high global warming potential, releases from open dumping site.
Social issues
- Unsanitary landfill causes an adverse impact on human health.
- Recycling material is disposed of together with other waste on landfill.
Technical issues
- Lack of proper waste treatment practice makes sustain source separation be less effective.
- Lack of advanced treatment technology to control the pollution from secondary emission as well as recover material/energy from waste.
Political issues
- Lack of reliable statistic data on waste management. The waste classifications are variety among municipal and national level.
- The local governments are not adequately equipped to provide the proper service due to the lack of reliable information on waste generation and composition.
- Lack of scientific study on evaluation of waste treatment alternatives for authorities, decision-makers and planners.
1.2. Objectives of study
The overall aim of the study is to clarify the pros and cons of municipal solid waste treatment alternatives toward GHG mitigation in major cities in Vietnam. The objectives of the research are to use quantitative and qualitative research methods to gain insight into how much GHG emission can be reduced by advanced technology and by waste management policy. The research aims to: (1) provide reliable and detail information on MSW generation and composition in Da Nang, a representative major city in Vietnam, (2) establish the reliable and
9
basic technological information on W-t-E incineration technology as the most prospected technology in Vietnam based on operation data of Japanese incinerators, and (3) Clarify the pros and cons of MSW treatment alternatives toward GHG mitigation, such as W-t-E incineration, anaerobic digestion to energy, and recycling technologies in consideration of reliable and detail information on characteristics of MSW generation in Da Nang. The main objective and specific objectives are shown in Figure 1.3.
Figure 1.3- Objectives of the study
In order to reach the abovementioned objectives, firstly, the authors conducted HSW surveys at 150 households within six urban districts for ten consecutive days in Da Nang, Viet Nam: 1) the measured survey to identify waste generation, components, and energy content, and 2) the questionnaire survey to determine the relevant factors. Then the authors analyzed the relationship between GWRs and influence factors. Based on WGRs and population, the total HSW in six districts of Da Nang was estimated. The uncertainty analysis was conducted to evaluate the uncertainty of input variables to the total estimation.
Secondly, two Japanese databases on the operation of incineration from
10
Japan Ministry of the Environment (1,234 incinerators) and Japan Waste Research Foundation (814 incinerators) were examined by considering incinerated amount, the specification of the facility, the annual utility consumption, and annual energy/material recovery. The authors analyzed the correlations among them and developed the predictive models for detail components of GHG emissions and reductions. The effectiveness of technical factors and political factors to GHG reduction from WtE incineration in Japan was evaluated and discussed.
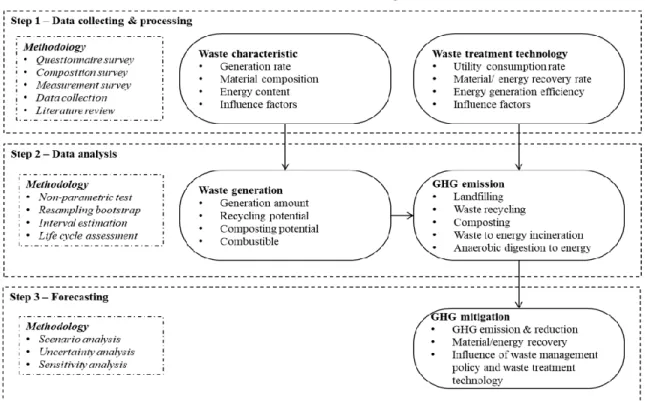
Finally, the scenario analysis by LCA method was conducted for HSW management in Da Nang, Vietnam. The emission factors were selected from past literature and official guideline, which are preferable for Vietnam condition. The LCA mainly focused on the operation process of the treatment facility. The prospective technologies were considered such as landfilling with landfill gas recovery, waste recycling, food waste recycling for animal feeding, composting, anaerobic digestion to energy, and waste-to-energy incineration. The pros and cons of MSW treatment alternatives toward GHG mitigation were assessed and discussed. The research framework is shown in Figure 1.4.
Figure 1.4 – Research framework
11 1.3. A conceptual outline of the dissertation
This dissertation consists of five sections are shown as follows:
Section 1 introduces the research background, an overview of solid waste management in Vietnam, and the scope as well as the objectives of the study. The outline of the whole study was also presented in this section.
Section 2 presents the household solid waste generation rates and influence factors by detailed composition considering the recycling/composting potential.
In addition, the basic composition (moisture, volatile solids, and ash) and energy content were examined to identify the energy content in HSW. Based on the waste generation rates and population, the total household solid waste amount was estimated. The accuracy of predicted estimation by input waste generation rates and influence factors was also discussed.
Section 3 discusses the scenario analysis on greenhouse gas emission for waste-to-energy alternatives in Japan. Two Japanese databases on the operation of incineration from Japan Ministry of the Environment (1,234 incinerators) and Japan Waste Research Foundation (814 incinerators) were examined by considering incinerated amount, the specification of the facility, the annual utility consumption, and annual energy/material recovery. The authors analyzed the correlations among them and developed the predictive models for detail components of GHG emissions and reductions. A scenario analysis by LCA method is conducted and discussed with seven scenarios considering technical option and waste management policy.
Section 4 shows the investigated contribution of household solid waste treatment alternatives to mitigate greenhouse gas emissions by various possible scenarios. The waste treatment alternatives included: (i) landfill without material/energy recovery; (ii) landfill with landfill gas recovery and power generation; (iii) Composting; (iv) Anaerobic digestion to energy; (v) Incineration; (vi) Material recycling; (vii) food waste recycling. The author conducted the multiple assessments based on different aspects such as GHG emissions and reductions, energy consumption and recovery, land use burden.
Finally, section 5 summarizes the main conclusions of the dissertation and shows the reasonable suggestions for improving and managing municipal solid waste in Vietnamese cities. Additionally, recommendations for future research and the possible development are represented.
12 REFERENCE
Byer, P.H., Hoang, C.P., Nguyen, T.T.T., Chopra, S., Maclaren, V., Haight, M., Byer, H.P., Hoang, P.C., Nguyen, T.T.T., Chopra, S., Maclaren, V., Haight, M., 2006. Household, hotel and market waste audits for composting in Vietnam and Laos. Waste Management and Research 24, 465–472.
doi:10.1177/0734242X06068067
Chi, N.K., Long, P.Q., 2011. Solid waste management associated with the development of 3R initiatives: Case study in major urban areas of Vietnam.
Journal of Material Cycles and Waste Management 13, 25–33.
doi:10.1007/s10163-010-0312-y
Choe, C., Fraser, I., 1999. An Economic Analysis of Household Waste Management. Journal of Environmental Economics and Management 38, 234–246. doi:10.1006/jeem.1998.1079
Essonanawe, M., Bang, M., Götze, R., Pivnenko, K., Petersen, C., Scheutz, C., Fruergaard, T., 2015. Municipal solid waste composition : Sampling methodology , statistical analyses , and case study evaluation. Waste Management 36, 12–23. doi:10.1016/j.wasman.2014.11.009
European Commission, 2004. Methodology for the Analysis of Solid Waste ( SWA-Tool ).
Gabor Doka, 2005. Waste Incineration, in: Waste Treatment and Disposal. John Wiley & Sons, Ltd, Chichester, UK, pp. 245–323.
doi:10.1002/0470012668.ch5
Gu, B., Jiang, S., Wang, H., Wang, Z., Jia, R., Yang, J., He, S., Cheng, R., 2017.
Characterization, quantification and management of China’s municipal solid waste in spatiotemporal distributions: A review. Waste Management 61, 67–
77. doi:10.1016/j.wasman.2016.11.039
Japan Ministry of the Environment database 2009 (In Japanese), n.d.
JICA, 2017. Vietnam Waste at a Glance. Vietnam Ministry of Construction, Hanoi, Vietnam.
Khoo, H.H., 2009. Life cycle impact assessment of various waste conversion
technologies. Waste Management 29, 1892–1900.
doi:10.1016/j.wasman.2008.12.020
Kim, M.H., Kim, J.W., 2010. Comparison through a LCA evaluation analysis of food waste disposal options from the perspective of global warming and
13
resource recovery. Science of the Total Environment 408, 3998–4006.
doi:10.1016/j.scitotenv.2010.04.049
Korner, I., Stegmann, R., Visvanathan, C., Norbu, T., Cossu, R., Gadia, R., Awang, M., Aziz, A.A., Chong, M.N.H.T.L., Ming, C.T., 2006. Solid waste management in Asia, Institute of Waste Resource Management, Germany.
Hamburg University of Technology, Hamburg, Germany.
Kumar, S., 2016. Municipal Solid Waste Management in Developing Countries.
CRC Press, New York.
Lou, Z., Bernd, B., Zhu, N., Chai, X., Li, B., Zhao, Y., 2015. Environmental impacts of a large-scale incinerator with mixed MSW of high water content from a LCA perspective. JES 1–7. doi:10.1016/j.jes.2014.10.004
McDougall, F.R., White, P.R., Franke, M., Hindle, P., 2001. Integrated Solid Waste Management: A Lifecycle Inventory, Blackwell Science. Blackwell Publishing, Boston, MA. doi:10.1007/978-1-4615-2369-7
Ministry of Construction, Enviroment, M. of N.R. and, 2013. National Strategy on Integrated Solid Waste Management until 2025, with a vision up to the year 2050. Hanoi, Vietnam.
Ogino, A., Hirooka, H., Ikeguchi, A., Tanaka, Y., Waki, M., Yokoyama, H., Kawashima, T., 2007. Environmental Impact Evaluation of Feeds Prepared from Food Residues Using Life Cycle Assessment. Journal of Environment Quality 36, 1061. doi:10.2134/jeq2006.0326
Otoma, S., Hoang, H., Hong, H., Miyazaki, I., Diaz, R., 2013. A survey on municipal solid waste and residents’ awareness in Da Nang city, Vietnam.
Journal of Material Cycles and Waste Management 15, 187–194.
doi:10.1007/s10163-012-0109-2
Pariatamby, A., Tanaka, M., 2014. Municipal Solid Waste Management in Asia and the Pacific Islands. doi:10.1007/978-981-4451-73-4
Porteous, A., 2005. Why energy from waste incineration is an essential component of environmentally responsible waste management. Waste Management 25, 451–459. doi:10.1016/j.wasman.2005.02.008
Qu, X., Li, Z., Xie, X., Sui, Y., Yang, L., Chen, Y., 2009. Survey of composition and generation rate of household wastes in Beijing, China. Waste
management (New York, N.Y.) 29, 2618–24.
doi:10.1016/j.wasman.2009.05.014
14
Sharma, M., McBean, E., 2007. A methodology for solid waste characterization based on diminishing marginal returns. Waste Management 27, 337–344.
doi:10.1016/j.wasman.2006.02.007
Thai, N.T.K., 2009. Hazardous industrial waste management in Vietnam: current status and future direction. Journal of Material Cycles and Waste Management 11, 258–262. doi:10.1007/s10163-009-0239-3
Thanh, N.P., Matsui, Y., 2013. Assessment of potential impacts of municipal solid waste treatment alternatives by using life cycle approach: a case study in Vietnam. Environmental Monitoring and Assessment 185, 7993–8004.
doi:10.1007/s10661-013-3149-8
Thanh, N.P., Matsui, Y., Fujiwara, T., 2010. Household solid waste generation and characteristic in a Mekong Delta city, Vietnam. Journal of environmental management 91, 2307–21. doi:10.1016/j.jenvman.2010.06.016
Unep, 2009. Developing Integrated Solid Waste Management Plan- Volume 2:
Assessment of Current Waste Management System and Gaps therein 2, 25.
UNFCCC, 2008. Tool to determine methane emissions avoided from dumping waste at a solid waste disposal site.
Vietnam Government, 2011. National Statement of Environment 2011. Hanoi, Vietnam.
Xin-gang, Z., Gui-wu, J., Ang, L., Yun, L., 2016. Technology , cost , a performance of waste-to-energy incineration industry in China. Renewable
and Sustainable Energy Reviews 55, 115–130.
doi:10.1016/j.rser.2015.10.137
15
2. CHARACTERISTICS OF HOUSEHOLD SOLID WASTE GENERATION 2.1. Introduction
Household solid waste (HSW) management is considered to be one of the most serious problem confronting local’ authorities in developing countries mainly due to the increasing generation of waste, the lack of understanding of factors that affect the different stages of waste management (Grazhdani, 2015).
Waste management is a complex process that requires a lot of information from various sources such as reliable data concerning waste generation and composition, influencing factors on waste generation and forecasts of waste quantities, as well as recycling potential rate (Dangi et al., 2008; Eisted and Christensen, 2011; Zhuang et al., 2008).
In general, detail and reliable information about waste generation and composition is required for several purposes from the decision-making concerning waste utilization to the development of local waste management systems and planning information campaigns. Moreover, waste generation and composition studies can be used for landfill design, identifying the sources of component generation, estimating physical, chemical, biological and thermal properties of wastes (Burnley et al., 2007; Shekdar, 2009; United Nations Environment Programme, 2009). In this way, waste composition studies are essential for functional waste management.
There have been a number of scientific studies focusing on HSW generation and composition in major cities in Vietnam. Otoma et al (2013) surveyed 50 households in Da Nang reported that average HSW generation rate is 0.71 kg/cap/day, of which organic waste (food, flowers, leaves, grass) accounts for about 70%, followed by plastic (14%). Dan and Viet (2009) reported that waste generation rate per capita in Ho Chi Minh city is 0.8 kg/cap/day in 2009, of which biodegradable waste, reusable/recyclable waste and other non- recyclable wastes are 60%, 30%, and 10% respectively. Meanwhile, Chi et al (2009) conducted a HSW survey and suggested that average generation rate in Ha Noi is 0.559 kg/cap/day, and waste component are diversified,, decomposed organic counted 47%, recycle plastic 4.66%. Giang et al (2017) conducted a survey in Hoi An to identify the generation rate and composition of household waste from different types of areas of the city. The authors suggested that the
16
mean of HSW generation was 0.223 kg/cap/day, and the composition of HSW was made up of 38% food waste, 19% garden waste, 14% plastic, 15% combustible, and other components constituted less than 5%. The detailed waste composition with recycling potential and specific function was not considered in the previous studies. Thanh et al (2010) conducted a solid waste survey at 100 household in Can Tho by detail waste composition and function, as well as recycling potential.
However, the authors did not considered the heating value of HSW and the energy recovery potential of HSW for thermal treatment technologies. The abovementioned studies estimated the total waste generation amount based on the surveyed WGRs; however, the uncertainty of waste composition to the total estimation has not been assessed and discussed.
This section aims to: 1) Provide the basic information on waste generation, characteristics, and its current material flow including informal sector; 2) Clarify the influence factors of waste generation rate and its modelling; 3) Estimate the total waste generation amount and the material flow by breakdown components;
4) Estimate the market value of valuable components contained in HSW; 5) Estimate the confidential intervals of the material flow and the impact of each parameter on confidential intervals.
2.2. Methodology
2.2.1. Research area and target sample
Da Nang (Vietnamese: Đà Nẵng), the fourth largest city in Vietnam in terms of urbanization and economy, is the commercial and educational center of the region. In addition, being located within 100 km of several UNESCO World Heritage Sites (the Imperial City of Hue, the Old Town of Hoi An, and the My Son sanctuary city), it also becomes a famous tourist destination. Da Nang is the fifth most populated city in Vietnam, with an area of 1,285.4 km² and a population of 1,046,876 as of 2015 (Da Nang People’s Committee, 2016a).
Regarding administrative divisions, Da Nang has 6 districts (Hai Chau, Thanh Khe, Cam Le, Lien Chieu, Son Tra, Ngu Hanh Son) and 2 communes (Hoa Vang, Hoang Sa). They are further subdivided into 45 wards and 14 villages. Da Nang has the highest urbanization ratio among provinces and municipalities in Vietnam with an average annual urban population growth by 3.5% as of 2015, and 87% of the population lived in urban areas (Da Nang People’s Committee, 2018).
17
The Urban Environment Company of Da Nang (Da Nang URENCO), the formal waste collection and treatment Company in Da Nang, reported that the collected amount of municipal solid waste (MSW) has been increased by 16.7%
in five years, from 223,521 tons (2010) to 260,923 tons (2014). In addition, 95%
collected amount was from urban areas (248,995 tons). In rural area, the household solid waste (HSW) is dumped or open burned by residences (Da Nang People’s Committee, 2016b).
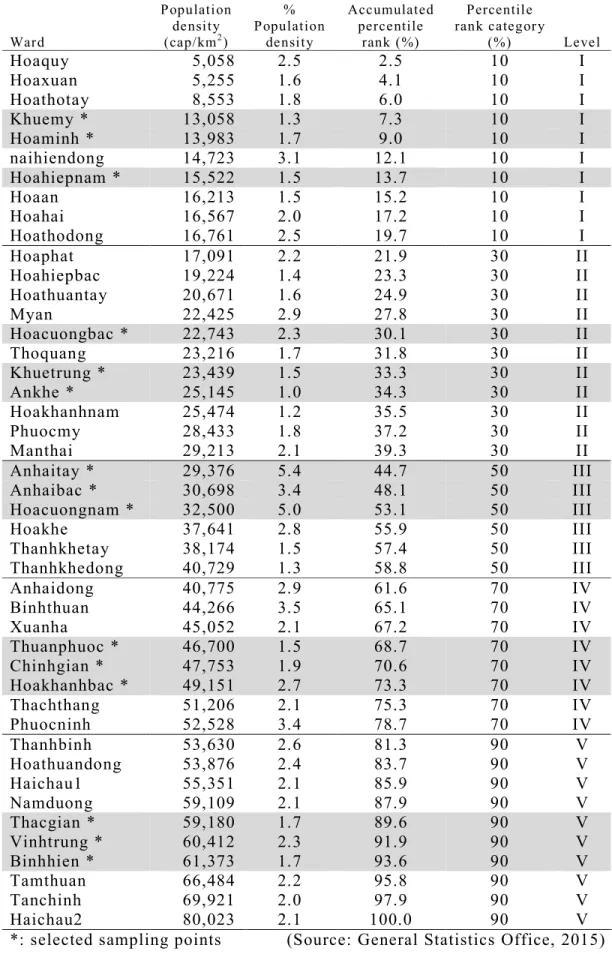
In this study, the author focused on the household solid waste from urban areas considering urbanization levels and geographical distribution. By assuming the population density is the representative indicator of urbanization level, the author defined five levels by accumulated percentile rank on population density, as 10th, 30th, 50th, 70th, and 90th, as levels I, II, III, IV, and V, respectively.
The list of wards and accumulated percentile rank is shown in Table 2-1. The research area and the sampling points are shown in Figure 2-1.
For target sample, the author selected 150 households from 15 sampling points, of which three sampling points for each urbanization level and ten households for each sampling points.
Source: Google map Figure 2.1 – Research area (Da Nang) and sampling points
2.2.2. Outline of survey
The procedure for the waste generation survey followed the methodology presented by Matsui et al., (2015). The authors conducted four surveys for all target facilities: a waste generation survey by actual measurement and a questionnaire survey onsite, a waste detailed composition survey and a basic
Da Nang
18
fraction survey at laboratory. The surveys were conducted from November 21s t to December 5t h, 2016. The waste generation survey was administered to acquire data on the amount of waste generated for ten consecutive days. The first three days were spent to prepare and practice with surveyors and target facilities; the data of latter seven consecutive days were used for analysis.
At first, a questionnaire survey was conducted by face-to-face interview to collect basic information on demographic and the status of waste storage at each target sample (e.g., place and kinds of containers and bags for storage). This step was aimed to invite target household participating the measurement survey, understand their waste separation habit and to design the proper time for daily measurement. Demographics such as age, family size, occupation, and income level were also surveyed.
19
Table 2.1 – Characteristic of population density distribution of research area
Ward
P opulati on de nsi t y (cap/km2)
% P opulation
de nsi t y
Acc umulated perce ntile
rank (%)
Percentil e rank categor y
(%) Leve l
Hoaquy 5,058 2.5 2.5 10 I
Hoaxuan 5,255 1.6 4.1 10 I
Hoathotay 8,553 1.8 6.0 10 I
Khuemy * 13,058 1.3 7.3 10 I
Hoaminh * 13,983 1.7 9.0 10 I
naihiendong 14,723 3.1 12.1 10 I
Hoahiepnam * 15,522 1.5 13.7 10 I
Hoaan 16,213 1.5 15.2 10 I
Hoahai 16,567 2.0 17.2 10 I
Hoathodong 16,761 2.5 19.7 10 I
Hoaphat 17,091 2.2 21.9 30 II
Hoahiepbac 19,224 1.4 23.3 30 II
Hoathuantay 20,671 1.6 24.9 30 II
Myan 22,425 2.9 27.8 30 II
Hoacuongbac * 22,743 2.3 30.1 30 II
Thoquang 23,216 1.7 31.8 30 II
Khuetrung * 23,439 1.5 33.3 30 II
Ankhe * 25,145 1.0 34.3 30 II
Hoakhanhnam 25,474 1.2 35.5 30 II
Phuocmy 28,433 1.8 37.2 30 II
Manthai 29,213 2.1 39.3 30 II
Anhaitay * 29,376 5.4 44.7 50 III
Anhaibac * 30,698 3.4 48.1 50 III
Hoacuongnam * 32,500 5.0 53.1 50 III
Hoakhe 37,641 2.8 55.9 50 III
Thanhkhetay 38,174 1.5 57.4 50 III
Thanhkhedong 40,729 1.3 58.8 50 III
Anhaidong 40,775 2.9 61.6 70 IV
Binhthuan 44,266 3.5 65.1 70 IV
Xuanha 45,052 2.1 67.2 70 IV
Thuanphuoc * 46,700 1.5 68.7 70 IV
Chinhgian * 47,753 1.9 70.6 70 IV
Hoakhanhbac * 49,151 2.7 73.3 70 IV
Thachthang 51,206 2.1 75.3 70 IV
Phuocninh 52,528 3.4 78.7 70 IV
Thanhbinh 53,630 2.6 81.3 90 V
Hoathuandong 53,876 2.4 83.7 90 V
Haichau1 55,351 2.1 85.9 90 V
Namduong 59,109 2.1 87.9 90 V
Thacgian * 59,180 1.7 89.6 90 V
Vinhtrung * 60,412 2.3 91.9 90 V
Binhhien * 61,373 1.7 93.6 90 V
Tamthuan 66,484 2.2 95.8 90 V
Tanchinh 69,921 2.0 97.9 90 V
Haichau2 80,023 2.1 100.0 90 V
*: selected sampling points (Source: General Statistics Office, 2015)
20
For waste generation survey, to avoid the water transition from kitchen waste to other waste categories in composition analysis, the target households were requested to keep and separate their waste basically into three categories;
“Recyclables”, “Food waste/ kitchen waste”, and “General waste”. The definition of waste category in the survey was as follows:
Recyclables: is waste that household keeps for selling to informal sector.
Food waste/ kitchen waste: is waste that target household keeps for animal feeding (pig/ livestock) or composting.
General waste: is waste that target discharges (excluding recyclable and food/kitchen waste).
For waste composition survey, the waste from each household was collected and delivered to laboratory before classifying into 10 physical categories by material (plastic, paper, food waste, rubber & leather, grass &
wood, textile, metal, glass, ceramic, miscellaneous) and 66 sub-categories considering their usage function and purpose, as shown in Table 2-2. The status of recycling potential is defined for each detailed composition, including
“recyclable”, “compostable”, and “non-recoverable” marked as “Re”, “Co”, and
“NRe”, respectively.
Because each type of waste has a unique heating value and basis fraction, a further measurement was conducted for each waste component based on ten physical categories to determine the basis fraction and energy content. For basis composition determination, each waste component was cut into small pieces (less than 5mm) before drying in an oven at 105oC to constant mass. The initial weight of each component sample was around 20 gram. After measuring the dry mass, the sample was incinerated in a furnace at 650oC to constant mass.
The basic fraction (moisture, combustible and ash contents) and energy content of HSW were analyzed and calculated based on the standard test method for gross calorific and ash value of waste materials (ASTM, 2014; MOST, 2012).
For heating value measurement, the waste components were measured individually in an oxygen bomb calorimeter. In this experiment, inert wastes such as metal, glass, ceramic were excluded because they cannot add or remove heat in incineration process. The energy content in household solid waste was calculated
21 as follows:
LHV = ∑( × ) (2-1)
Where:
LHVHSW (kJ/kg): calculated low heating value of household solid waste Proportioni (%): the proportion of waste component i
LHVi (kJ/kg): measured low heating value of waste component i
Finally, a face-to-face interview survey for informal sector was also conducted to identify the detail categories of recyclable items and their market value.
2.2.3. Analytical procedure
The authors intended to calculate the basic statistics relating to waste generation rates (WGRs) by physical categories and sub-category.
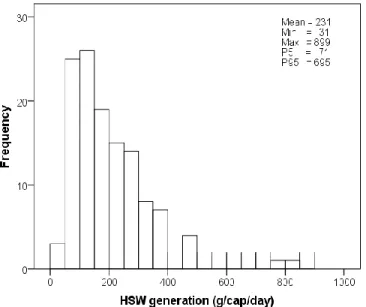
In scientific literature, the statistical procedures including correlation, regression, t tests, and analysis on variance, namely parametric tests, are based on the assumption that the data follows a normal distribution or a Gaussian distribution (Field, 2009). Thode, (2002) mentioned that normality test, such as Kolmogorov-Smirnov test or Shapiro-Wilk test should be conducted to judge whether the data followed normal distribution or not. By Shapiro-Wilk test, the author found that the WGRs of target samples did not follow normal distribution, as shown in Figure 2.2. So, the non-parametric tests were applied for further analysis in this study.
Figure 2.2 – Frequency distribution of HSW in Da Nang (g/cap/day)
22
The WGRs were presented by mean and 95% confidence interval, which were estimated by non-parametric bootstrap with return (10,000 trials). The authors also assessed the difference of WGRs among business categories by Kruskal-Wallis test. In addition, the relationship between influence factors and WGRs were analyzed. Theodorsson-Norheim, (1986) suggested that the non- parametric tests, such as Kruskal-Wallis test, was proved to perform better than their parametric analogues in the practical research situation, where the data are not normally distributed, contain outliers and the size of the groups is small.
The resampling bootstrap methodology was applied to estimate the confidence interval of total waste generated and the breakdown components, as well as the recyclable waste amount and its revenue. The process was repeated with 10,000 iterations. The authors also conducted the sensitivity analysis to identify the contribution of each variance. The parameters having the greatest effect are considered to be the parameters for which additional data should reduce the amount of overall uncertainty in the results. In this study, the method used for the sensitivity analysis was to square the Spearman Rank Coefficients by each parameter, then sum up and adjust them to 100% (Crystal Ball User’s Guide, 11.1.1.3.00, 2009; Hammonds et al., 1994). RStudio (R version 3.3.0) was applied for statistical analysis.
2.3. Results and discussionsWaste generation and waste composition
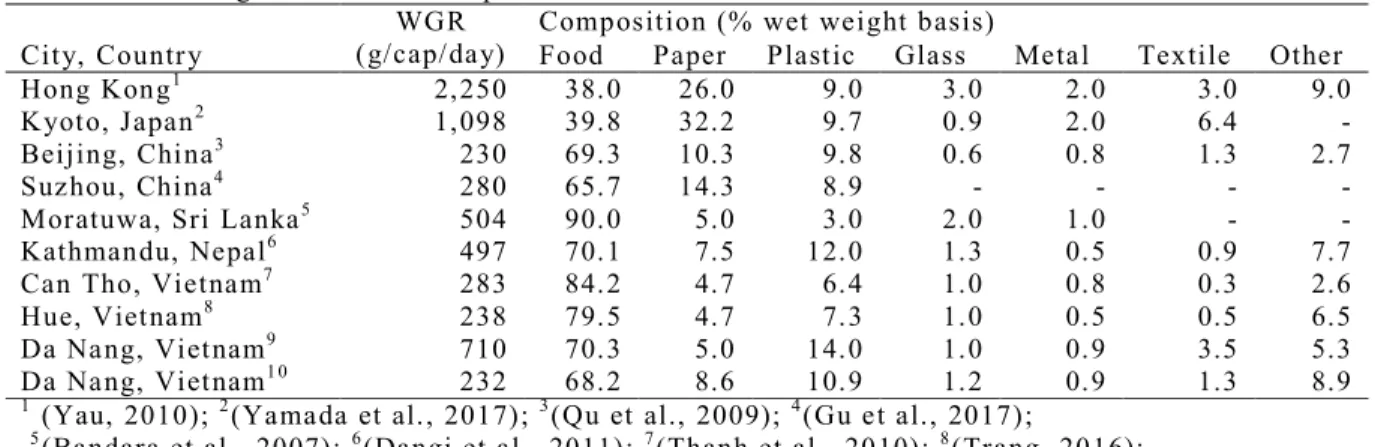
WGRs by 10 physical compositions are presented in weight (g/capita/day) and percentage as shown in Table 2.2. The average total WGR was 232 g/cap/day with an average of 4.6 residents per household of 150 target samples. Regarding the physical categories, kitchen waste contributed the largest part with 157.9 g/cap/day (68.23%), followed by plastic (25.3 g/cap/day, 10.95%) and paper (19.9 g/cap/day, 9.4%).
Table 2.2 also introduces HSW generation rates and compositions reported in past literatures as reference. The HSW generation rate in this study was similar with those reported in Beijing (230 g/cap/day), Suzhou (280 g/cap/day), Can Tho (283 g/cap/day) and Hue (238 g/cap/day). Regarding the waste composition, kitchen waste accounted for major component of HSW, which is consistent with past studies in developing countries. However, the WGRs in Da Nang are much lower than those in developed countries like Hong Kong (2,250 g/cap/day) and Kyoto (1,098 g/cap/day). In addition, the paper is the major
23
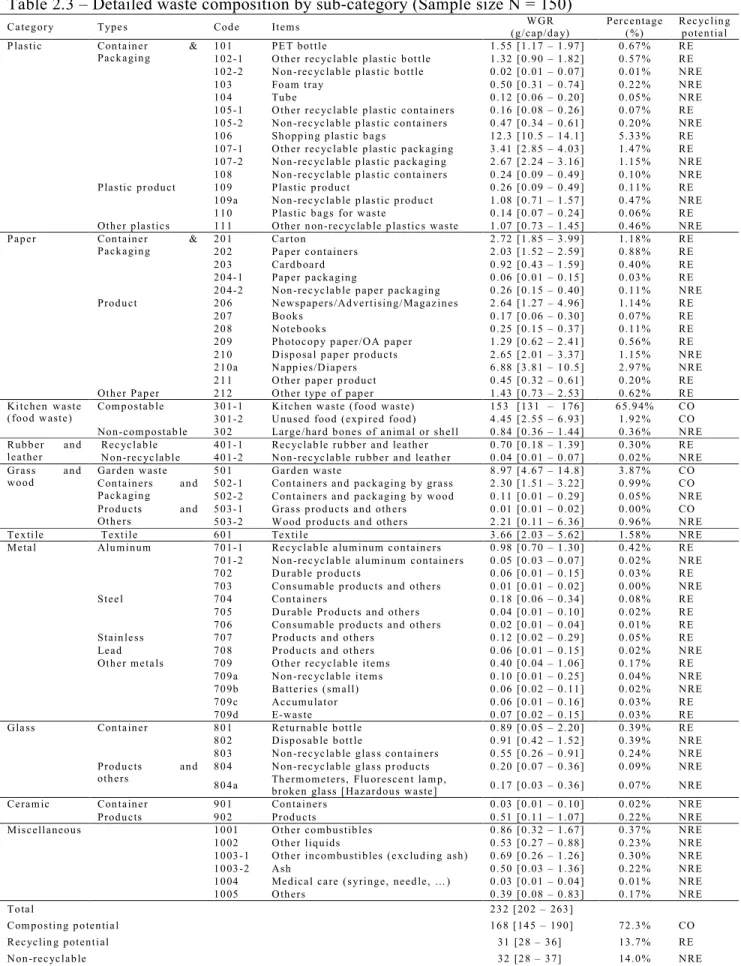
component in HSW in these major cities. It could be explained that developed countries would consume larger amount of paper products and packages. The WGRs, the proportion (%) and the recycling potential by 66 detailed categories are also illustrated in Table 2.3. Table 2.3 shows that compostable waste accounted for the main proportion of the total with 170.7 g/cap/day (approximate 67.9% of total), consisted of food waste, unused food, garden waste, container and packaging by grass, and grass product. Recyclable material also accounted for the high percentage (17.6%) of total HSW generation, which was larger than the amount of the remaining waste (14.5%).
Table 2.2 – HSW generations and compositions in different areas Cit y, Countr y
WGR (g/cap/ da y)
Composition (% wet weight basis)
Food Paper Plast ic Glass Meta l Textile Other
Hong Kong1 2, 250 38. 0 26.0 9. 0 3. 0 2. 0 3.0 9.0
K yot o, Japan2 1, 098 39. 8 32.2 9. 7 0. 9 2. 0 6.4 -
Beijing, Chi na3 230 69. 3 10.3 9. 8 0. 6 0. 8 1.3 2.7
Suz hou, Chi na4 280 65. 7 14.3 8. 9 - - - -
Moratuwa, Sri Lanka5 504 90. 0 5.0 3. 0 2. 0 1. 0 - -
Kathmandu, Nepal6 497 70. 1 7.5 12. 0 1. 3 0. 5 0.9 7.7
Can Tho, Vietna m7 283 84. 2 4.7 6. 4 1. 0 0. 8 0.3 2.6
Hue, Viet nam8 238 79. 5 4.7 7. 3 1. 0 0. 5 0.5 6.5
Da Na ng, Viet nam9 710 70. 3 5.0 14. 0 1. 0 0. 9 3.5 5.3
Da Na ng, Viet nam1 0 232 68. 2 8.6 10. 9 1. 2 0. 9 1.3 8.9
1 (Yau, 2010); 2(Ya ma da et al. , 2017); 3(Qu et al., 2009); 4(Gu e t al., 2017);
5(Bandara et al., 2007); 6(Dangi et al., 2011); 7(Thanh et al., 2010); 8(Trang, 2016);
9(Otoma et al., 2013); 1 0 This study
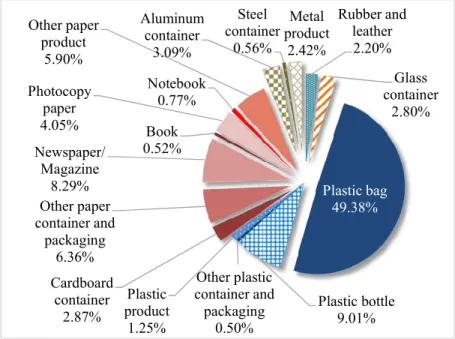
The detailed compositions of recyclable are presented in Figure 2.3.
Regarding plastic waste, shopping plastic was dominant with 12.33 g/cap/day (5.33%). Meanwhile, diapers were the major component in paper waste with 6.88 g/cap/day (1.15%). For kitchen waste, the WGR of unused food was 4.45 g/cap/day (1.92%). The author found that plastic material accounted for the greatest fraction of the total; plastic bag (49.38%), plastic bottle (9.01%), plastic product (1.25%), and other plastic container and packaging (0.5%). The second largest component was paper material, in which newspaper/ magazine accounted for the main part with 8.29% of the total, followed by other paper container and packaging with 6.36%, other paper product (5.9%), photocopy paper (4.05%), cardboard container (2.87%), notebook (0.77%), and book (0.52%). The metal material comprised the main part of aluminum container with 3.09% of the total, followed by metal product (2.42%), and steel container (0.56%). The remaining components were glass container and rubber & leather with 2.8% and 2.2% of the