O R I G I N A L A R T I C L E – T R A N S L A T I O N A L R E S E A R C H A N D B I O M A R K E R S
CD36 Expression Is Associated with Cancer Aggressiveness and Energy Source in Esophageal Squamous Cell Carcinoma
Tomonori Yoshida, MD1, Takehiko Yokobori, MD, PhD2,3, Hideyuki Saito, MD1, Kengo Kuriyama, MD1, Yuji Kumakura, MD, PhD1, Hiroaki Honjo, MD, PhD1, Keigo Hara, MD, PhD1, Makoto Sakai, MD, PhD1, Tatsuya Miyazaki, MD, PhD1, Hideru Obinata, PhD3,4, Bilguun Erkhem-Ochir, MD1, Navchaa Gombodorj, MD, PhD1, Makoto Sohda, MD, PhD1, Hiroshi Saeki, MD, PhD1, Hiroyuki Kuwano, MD, PhD1, and
Ken Shirabe, MD, PhD1
1Department of General Surgical Science, Graduate School of Medicine, Gunma University, Maebashi, Japan;
2Department of Innovative Cancer Immunotherapy, Gunma University, Maebashi, Japan;3Gunma University Initiative for Advanced Research (GIAR), Maebashi, Japan;4Graduate School of Medicine, Education and Research Support Center, Gunma University, Maebashi, Japan
ABSTRACT
Background. Esophageal squamous cell carcinoma (ESCC) is an important cause of cancer-related death worldwide. CD36, a long-chain fatty acid (FA) receptor, can initiate metastasis in human oral squamous cell carci- noma (SCC), and its expression is associated with poor prognosis in several cancers. The clinical significance of CD36 expression and its function in ESCC remain unknown.
Methods. We examined the clinical significance of CD36 expression in 160 ESCC samples using immunohisto- chemical staining. Functional analysis was performed to determine the association between CD36 and ESCC char- acteristics (proliferative ability, invasive ability, and energy source dependency).
Results. Thirty (18.8%) ESCC cases showed high CD36 expression, indicating a significant association with pro- gression. CD36 suppression inhibited proliferation and invasiveness in ESCC cells. ESCC cells with CD36 sup- pression used specific essential amino acids (EAAs) as
energy sources. Cell viability depended on FAs under CD36 expression. The viability of ESCC cells with CD36 suppression depended on EAAs but not FAs.
Conclusions. CD36 may be a good biomarker and thera- peutic target in ESCC. Our data provide new insights into the basic mechanism of CD36-dependent energy utilization for ESCC survival. CD36 might be a key regulator of the dependency of FAs as energy source in ESCC cells.
Esophageal squamous cell carcinoma (ESCC) is a highly aggressive cancer with early invasion and metasta- sis. Recent advances in diagnosis and treatment have led to improved survival; however, the prognosis of advanced ESCC with local invasion and metastasis remains poor and unsatisfactory.1,2If invasion and metastasis are controlled, the poor prognosis of ESCC may improve.
The membrane glycoprotein CD36 functions to uptake fatty acids (FAs) for energy production and contributes to the onset of metabolic disorders such as diabetes and obesity.3–6
CD36 initiates metastasis in human oral squamous cell carcinoma (SCC), and its expression is significantly asso- ciated with poor prognosis of lung SCC, bladder cancer, luminal A breast cancer, glioblastomas, and prostate can- cer.7–9 Moreover, CD36 expression is upregulated in peritoneal dissemination compared with that in primary ovarian cancers.10 Few studies have addressed whether Electronic supplementary material The online version of this
article (https://doi.org/10.1245/s10434-020-08711-3) contains supplementary material, which is available to authorized users.
ÓSociety of Surgical Oncology 2020 First Received: 2 September 2019
T. Yokobori, MD, PhD e-mail: [email protected]
https://doi.org/10.1245/s10434-020-08711-3
CD36 expression clinically correlates with invasion, metastasis, and prognosis in ESCC patients with aggressive phenotypes.
Compared with normal cells, cancer cells undergo altered metabolic activity to control energy supply for acquisition and maintenance of their malignant properties.
In addition to glucose, FAs and essential amino acids (EAAs) are important fuels for cancer cells.11–13 As an energy source, FAs facilitate cell growth and fulfill energy requirements of cancer cells.14,15 Adipocytes including FAs induce CD36 expression and promote tumor growth in several cancer cells.10,16,17 In particular, EAAs serve as materials for intermediate metabolites of the tricarboxylic (TCA) cycle.18Honjo et al. reported that high expression of amino acid transporters in ESCC is associated with cancer progression and poor prognosis.19The metabolic relation- ship among CD36, FAs, and EAAs remains largely unknown in ESCC cells.
Herein, we clarify the function and clinical significance of CD36 in ESCC. We evaluate the relationship between CD36 expression and various clinicopathological charac-
teristics in 160 ESCC samples using
immunohistochemistry. We also examine whether in vitro siRNA-mediated CD36 suppression influences cell viabil- ity and invasive ability of the human ESCC cell line TE15, which has a high CD36 expression level. Moreover, we conduct metabolome analysis and examine the influence of FAs and EAAs on cell viability to clarify the mechanism of CD36-dependent energy source utilization for ESCC survival.
PATIENTS AND METHODS Patients and Tissues
Surgical specimens were obtained from 160 ESCC patients (142 men and 18 women; age: 41–83 years, mean:
63.7 years) who had undergone potentially curative surgery at the Department of General Surgical Science, Gunma University between 2000 and 2010. This study conformed to the tenets of the Declaration of Helsinki and was approved by the Institutional Review Board for Clinical Research of the Gunma University Hospital (Maebashi, Japan; Approval No.: HS2019-005). Patient consent was obtained with the opt-out method.
Surgery was classified as curative surgery when there was no evidence of residual tumor and the resected margins were microscopically free of tumor (R0). The median follow-up period of survivors was 52 (1.4–150) months.
The pathological characteristics of the specimens were classified based on the 7th edition of the TNM classifica- tion of the International Union against Cancer. No patient
preoperatively received irradiation or chemotherapy, and none presented with hematogenous metastases at the time of surgery.
Immunohistochemistry
Four-micron sections were cut from paraffin blocks of ESCC samples, and each section was mounted on a silane- coated glass slide, deparaffinized, and soaked in 0.3%
H2O2/methanol for 30 min at room temperature to block endogenous peroxidases. Then, the sections were heated in boiled water using Immunosaver (Nishin EM, Tokyo, Japan) for 45 min at 98°C. Nonspecific binding sites were blocked by incubating the sections with Protein Block Serum-Free (DAKO, Santa Clara, CA) for 30 min. An anti- CD36-specific antibody (Cell Signaling Technology, Dan- vers, MA) was applied at a dilution of 1:200 for 24 h at 4
°C. The primary antibody was visualized using the Histo- fine Simple Stain MAX-PO (Multi) Kit (Nichirei, Tokyo, Japan) according to the instruction manual. The chromogen 3,30-diaminobenzidine tetrahydrochloride was used as a 0.02% solution containing 0.005% H2O2 in 50 mM ammonium acetate–citrate acid buffer. The sections were lightly counterstained with Mayer’s hematoxylin and mounted. Negative control specimens were incubated without primary antibody, and no detectable staining was evident.
Evaluation of Immunostaining
CD36 immunoreactivity was determined as follows:
low, no staining or membrane staining observed in\10%
tumor cells, and high, membrane staining observed in C 10% tumor cells. Each case was evaluated by two researchers. The ESCC patients were divided into two groups according to the CD36 immunoreactivity of the surgical specimens.
Cell Lines
Het1A, TE1, TE8, TE15, KYSE70, and KYSE140 cell lines were obtained from the American Type Culture Collection, RIKEN CELL BANK, and JCRB cell bank.
They were maintained in the Roswell Park Memorial Institute (RPMI1640) medium (Wako Pure Chemical Industries, Osaka, Japan) containing 10% fetal bovine serum (FBS) and antibiotics (100 U/mL penicillin and 100 lg/mL streptomycin), and they were cultured in a humid- ified 5% CO2incubator at 37°C.
RNA Isolation and Quantitative RT-PCR
Total RNA was extracted using a RNeasy mini kit (Qiagen, Venlo, the Netherlands). RNA was quantified using NanoDrop 1000 (Thermo Scientific, Wilmington, DE). Each cDNA was synthesized from 500 ng total RNA using the ReverTra Ace qPCR RT kit (TOYOBO, Osaka, Japan) according to the manufacturer’s protocol. CD36 mRNA was evaluated using real-time polymerase chain reaction (RT-PCR) with the StepOnePlus Real-Time PCR System (Applied Biosystems, Foster City, CA) with the KAPA SYBR Green PCR kit (Roche, Basel, Switzerland).
The primers used for quantitative RT-PCR (qRT-PCR)are listed in Supplementary Table S1. The amplification con- ditions were as follows: 40 cycles of denaturation for 3 s at 95°C and annealing and extension for 30 s at 60 °C. All samples were amplified using b-actin primers as an endogenous loading control. The relative expression of each gene was calculated using the comparative CT method.
Western Blotting
Proteins were extracted as previously described.20Total protein (20lg) was separated by electrophoresis on a 10%
polyacrylamide gel and transferred by electroblotting at 100 V for 90 min on a nitrocellulose membrane (Invitro- gen). Western blotting was performed to confirm the expression of CD36 and b-actin proteins using a rabbit monoclonal antibody against CD36 (Cell Signaling Tech- nology #14347) and mouse monoclonal antibody againstb- actin (1:3000 in vitro and in vivo; Cell Signaling Tech- nology #3700).b-actin expression was used as a loading control. Signals were detected with the ECL Western Blotting Detection System and Image Quant LAS 4000 (GE Healthcare Life Sciences Inc., Chicago, IL).
RNA Interference of CD36
CD36-specific siRNA1 (sense sequence: GGAAAGU- CACUGCGACAUG; and antisense sequence:
CAUGUCGCAGUGACUUUCC), CD36-specific siRNA2 (sense sequence: CAGAGUAAAUGUUGAGCAU; and antisense sequence: AUGCUCAACAUUUACUCUG), were purchased from Theoria Science (Tokyo, Japan). A negative control siRNA was purchased from GeneDesign Inc. (Osaka, Japan). TE15 cells were plated at a density of 19106cells/well in 100lL Opti-MEM I Reduced Serum Medium (Invitrogen). CD36-specific siRNAs 1 and 2 and the negative control siRNA were added to the cells at a concentration of 20 nM, and siRNA transfection was achieved using a CUY-21 EDIT II electroporator (BEX, Tokyo, Japan) as previously described.20 CD36
suppression was confirmed by qRT-PCR after 48 h incu- bation and by Western blotting after 72 h incubation.
CD36 Overexpression
To establish TE1 cells expressing CD36, the lentiviral vector used to overexpress EGFP, pLV[Exp]-EGFP:- T2A:Puro-CMV[hCD36, was constructed and packaged by VectorBuilder (Chicago, IL). The vector ID is LVS- VB190305-1249gvc, which can be used to retrieve detailed information about the vector on vectorbuilder.com.
Proliferation Assay
ESCC cells were plated at a density of approximately 5000 cells/well on 96-well plates with 100 lL medium.
The water-soluble tetrazolium-8 assay (Dojindo Laborato- ries, Tokyo, Japan) was used to quantify cell viability according to the manufacturer’s protocol. The absorbance values were read using a microtiter plate reader (Thermo Scientific).
Matrigel Invasion Assay
Invasion of TE15 cells was analyzed using Matrigel- coated invasion chambers (BD Biosciences, Japan). TE15 cells were seeded in 500 lL serum-free media in the Matrigel upper chamber 72 h after transfection withCD36 siRNA, and the lower chamber was filled with 750 lL RPMI 1640 medium supplemented with 10% FBS as a chemoattractant. After 24-h incubation, the chambers were removed, washed with phosphate-buffered saline, and cleaned with a cotton swab. Next, the cells were fixed in methanol and stained with Diff-Quik stain (Sysmex, Japan). The membranes were cut, and invaded cells were observed under bright-field microscopy.
Metabolome Analysis by Liquid Chromatography- Tandem Mass Spectrometry (LC-MS/MS)
ESCC cells obtained at 72 h after transfection with siRNA were treated with methanol for 30 min to extract metabolites. The extracts were purified using a CaptivaTM ND Lipid filter plate (Agilent, Santa Clara, CA) according to the manufacturer’s instructions, dried up using a vacuum evaporator, resuspended with distilled water, and used for the detection of metabolites by LC-MS/MS (LCMS-8050 triple quadrupole mass spectrometer system; Shimadzu, Kyoto, Japan). The relative levels of metabolites produced by the central metabolic pathways were determined using the Method Package for Primary Metabolites (Shimadzu)
with a Discovery HS F5-3 column (Sigma-Aldrich, St.
Louis, MO) according to the manufacturer’s instructions.
FA and EAA Treatment
In the serum-free experiment, ESCC cells were cultured in Dulbecco’s modified Eagle’s medium without amino acids (048-33575; Wako Pure Chemical Industries) con- taining 1% ITS-X solution (094-06761, Wako Pure Chemical Industries). We used palmitic acid (PA), a rep- resentative long-chain FA, as a substrate for CD36 to analyze FA-dependent cell proliferation. For the treatment of ESCC cells with PA, sodium palmitate (P9767; Sigma- Aldrich) was prepared as a 2.5 mM stock solution by dis- solving it in 75% ethanol under heating condition at 80°C until a clear solution was obtained. For FA supplementa- tion, PA was conjugated with FA-free BSA (015-23871;
Wako Pure Chemical Industries) and added to the media at a final concentration of 100lM. For EAAs supplementa- tion, an essential amino acid solution (132-15641; Wako Pure Chemical Industries) was added to the media diluted 50-fold. Proliferation assays were conducted after a 72-h treatment with PA or EAAs.
Statistical Analysis
Statistical significance was analyzed using Student’s t- test for continuous variables and chi-square test for
categorical variables. Survival curves were generated according to the Kaplan–Meier method. Differences between overall survival curves were examined using the log-rank test. Univariate and multivariate survival anal- yses were performed using Cox’s proportional hazards model. Analysis of variance and Dunnett’s test were performed to assess statistical significance in in vitro assays. P\0.05 was considered statistically significant.
All statistical analyses were performed using the JMP Pro 12.0 software (SAS Institute Inc., Cary, NC).
RESULTS
CD36 Expression in Clinical ESCC Tissues Samples
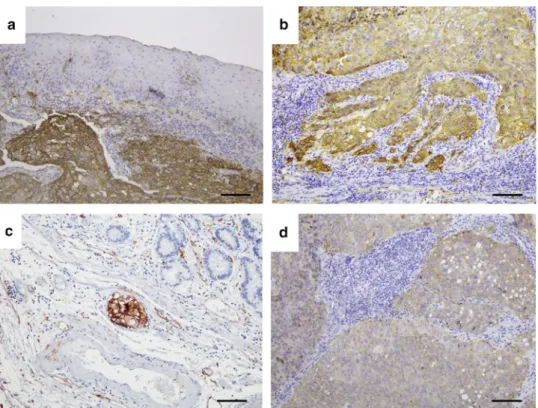
To investigate CD36 localization in ESCC tissues, we immunohistochemically analyzed 160 available clinical ESCC samples. CD36 expression was mainly localized to the cell membrane in ESCC cells, but no expression was detected in normal esophageal squamous cells (Fig.1a).
CD36 immunoexpression was stronger in the invasion front of primary ESCC cells than within the main tumor or surrounding normal tissues (Fig.1a, b). High CD36 expression was observed in cells invading the lymphatic vessels (Fig. 1c) and in metastatic lymph nodes (Fig.1d).
FIG. 1 Representative photomicrographs of tissue sections immunostained for CD36 expression:aHigh CD36 expression was observed in a representative ESCC section. No expression was detected in normal esophageal squamous epithelium (1009, scale bar: 100lm);bHigher CD36 expression in the invasion front than within the main tumor of an advanced ESCC section (1009, scale bar: 100lm);
cHigh CD36 expression in ESCC cells invading the lymphatic vessels (1009, scale bar: 100lm); anddHigh CD36 expression in metastatic lymph nodes (1009, scale bar: 100 lm)
Association of CD36 Expression
with Clinicopathological Characteristics of ESCC Patients
When classified according to the CD36 immunoreac- tivity score, 130 (81.3%) and 30 (18.7%) ESCC samples were defined to have low and high CD36 expressions, respectively. Information about CD36 expression in rela- tion to 10 clinicopathological characteristics of the patients is summarized in Table1. High CD36 expression
significantly associated with the progression of T factor (P= 0.0017), N factor (P= 0.018), lymphatic invasion (P= 0.0006), and venous invasion (P= 0.0043).
High CD36 Expression and Postoperative Survival of ESCC Patients
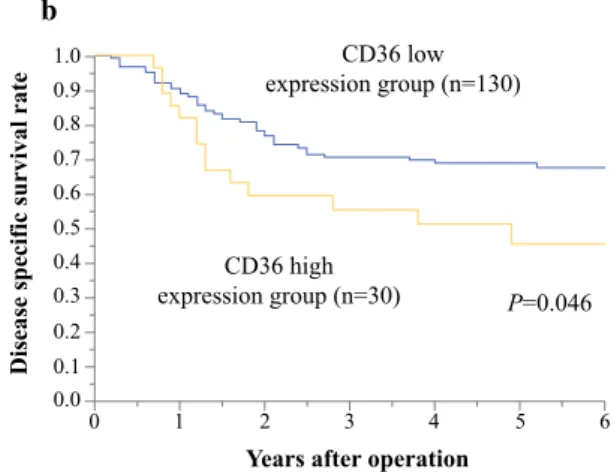
Disease-specific and recurrence-free survival rates were significantly lower in ESCC patients with high CD36 expression than in patients with low CD36 expression (P= 0.0023, 0.046, and 0.048, respectively; Fig. 2). Univariate analysis revealed high CD36 expression as a significant prognostic factor for poor survival (P = 0.035; Table2).
Multivariate analysis of the six factors that were significant on univariate analysis showed that high CD36 expression is not an independent risk factor for poor overall survival (Table2).
Functional Analysis of CD36 Expression in ESCC Cell Lines Using RNA Interference
We evaluated the baseline expression levels of CD36 in Het1A, TE1, TE8, TE15, KYSE70, and KYSE140 cells by Western blotting (Fig.3a). CD36 expression was detected only in TE15 cells; therefore, we used this cell line to analyze the CD36 suppression effects in vitro. Western blotting and qRT-PCR confirmed the reduction in CD36 and mRNA expression at posttransfection 72 and 48 h, respectively (Fig.3b). Cells transfected with CD36 siRNA showed significantly lower proliferative ability than control cells (P\0.05; Fig.3c). CD36 knockdown inhibited the invasive ability of TE15 cells (Fig.3d). The expression levels of carnitine palmitoyltransferase 1 (CPT1) and long- chain acyl-CoA dehydrogenase (LCAD), two key b-oxi- dation enzymes, decreased by CD36 suppression, whereas the expression level of acetyl-CoA carboxylase (ACC), the key enzyme of FA synthesis, increased (Fig.3e). Although the baseline expression levels of CPT1 and LCAD in TE1, TE8, and KYSE140 were lower than those in TE15, those of ACC were inconsistent (Supplementary Fig. S1). TE15 cells were incubated with 100lM PA without serum. Cell proliferation significantly decreased in the CD36 suppres- sion groups compared with that in the negative control after 72-h treatment with PA (Fig.3f). The CD36-overexpress- ing TE1 cell line was used to analyze the CD36 expression effects in vitro. Western blotting and qRT-PCR confirmed the overexpression of CD36 and mRNA expression at posttransfection (Fig. 3g). Cells transfected with CD36 vector showed significantly higher proliferative ability than control cells (P\0.05; Fig.3h).
TABLE 1 CD36 expression and clinicopathological factors of 160 ESCC patients
Factors CD36 expression Pvalue
Low (%) High (%) n= 130 (81) n= 30(19) Age (years) (mean±SD) 63±8.3 64±6.6 0.79 Sex
Male 115 (72) 27 (16) 0.8
Female 15 (9) 3 (2)
Tumor location
Upper 14 (9) 3 (2) 0.61
Middle 68 (42) 13 (8)
Lower 48 (30) 14 (9)
T factor
T1 64 (40) 4 (2) 0.0017
T2 11 (7) 6 (4)
T3 51 (32) 18 (11)
T4 4 (2) 2 (1)
N factor
Absent 55 (34) 6 (4) 0.018
Present 75 (47) 24 (15)
M factor
Absent 110 (69) 24 (15) 0.54
Present 20 (12) 6 (4)
Stage
I 42 (26) 3 (2) 0.068
II 25 (16) 7 (4)
III 43 (26) 14 (9)
IV 20 (12) 6 (4)
Lymphatic invasion
Absent 26 (16) 0 0.0006
Present 104 (65) 30 (19)
Venous invasion
Absent 38(24) 2 (1) 0.0043
Present 92(57) 28(17)
Recurrence
Absent 50(31) 15 (9) 0.24
Present 80 (50) 15 (9)
TABLE 2 Results of univariate and multivariate analyses of clinicopathological factors affecting overall survival rates following surgery
Characteristic Univariate analysis Multivariate analysis
RR 95% CI Pvalue RR 95% CI Pvalue
Age (years)
B65 versus[65 1.11 0.69–1.78 0.65
Sex
Female versus male 2.06 0.85–6.77 0.11 T factor
T1 versus T2–4 2.31 1.41–3.92 0.0007 1.46 0.83–2.66 0.18
N factor
Absent versus present 2.65 1.56–4.72 0.0002 1.54 0.81–3.13 0.19 M factor
Absent versus present 2.87 1.64–4.78 0.0004 2.03 1.13–3.52 0.018 Lymphatic invasion
Absent versus present 2.92 1.37–7.58 0.0037 0.82 0.25–2.82 0.75 Venous invasion
Absent versus present 3.42 1.73–7.75 0.0001 1.98 0.76–5.89 0.16 CD36 expression
Low versus high 1.83 1.04–3.07 0.035 1.41 0.79–2.42 0.22
RRrelative risk,CIconfidence interval 0.00
0.1 0.2 0.3 0.4 0.5 0.6 0.7 0.8 0.9 1.0
0.0 0.1 0.2 0.3 0.4 0.5 0.6 0.7 0.8 0.9 1.0
1 2 3 4 5 6
0.00 0.1 0.2 0.3 0.4 0.5 0.6 0.7 0.8 0.9 1.0
1 2 3 4 5 6
0 1 2 3 4 5 6
Years after operation Years after operation
Years after operation
Overall survival rateRecurrence free survival rate Disease specific survival rate
P=0.023 CD36 high
expression group (n=30) CD36 low expression group (n=130)
P=0.046 CD36 high
expression group (n=30) CD36 low expression group (n=130)
P=0.048 CD36 high
expression group (n=30) CD36 low expression group (n=130) a
c
b
FIG. 2 Relationships between CD36 expression in 160 ESCC samples and overall survival time: a Overall survival curves of ESCC patients according to CD36 expression (P= 0.023),bdisease-
specific survival rate of ESCC patients according to CD36 expression (P = 0.046), and crecurrence-free survival rate of ESCC patients according to CD36 expression (P= 0.048)
Role of CD36 Expression in Cancer Metabolism
To directly observe differences between global metabolite levels in TE15 cells with or without CD36 knockdown, we conducted a metabolome analysis (Fig.4a). Among the metabolites detected, the levels of intermediate metabolites of the TCA cycle were not sig- nificantly different in TE15 cells with or without CD36 knockdown. The levels of two EAAs (isoleucine and leu- cine) were significantly lower, and six EAAs (threonine, tryptophan, histidine, phenylalanine, tyrosine, and valine) tended to be lower in ESCC cells with CD36 knockdown than in the control cells. The relationship between EAAs and intermediate metabolites of the TCA cycle are high- lighted as dotted arrows in Fig.4a. The expression level of branched-chain aminotransferase (BCAT) and the rate- limiting enzyme of BCAA decomposition were signifi- cantly enhanced by CD36 suppression (Fig.4b).
Contribution of FAs and EAAs in ESCC Cell Proliferation with CD36 Suppression
The proliferative ability of ESCC cells with CD36 suppression was compared between PA and EAAs treat- ments. Cell viability was significantly higher under PA treatment than after EAAs treatment in the control cells (Fig.4c). However, cell viability significantly increased under EAAs treatment compared with under PA treatment in ESCC cells with CD36 suppression (Fig.4c). To confirm the significance of endogenous CD36, we eval- uated the relationship between cell viability and administration of PA or EAAs to ESCC cells. ESCC cell lines not expressing endogenous CD36 did not show increased cell viability with PA treatment, unlike with EAA treatment; TE15 with endogenous CD36 showed significantly increased cell viability with PA treatment than with EAA (Fig.4d).
Contribution of CD36 Overexpression in ESCC Cell Proliferation
The proliferative ability of TE1 cells with CD36 overexpression was compared among PA treatment, EAAs, and both PA and EAAs treatments. Cell viability was significantly higher under EAAs treatment than after PA in both the control cells and cells with CD36 over- expression (Fig.4e). Cell viability in the control cells was not significantly higher under both PA and EAAs than after EAAs alone. However, cell viability in the cells with CD36 overexpression was significantly higher under both PA and EAA treatments than after EAAs treatment alone (Fig.4e).
DISCUSSION
CD36 expression was not detected in normal esophageal squamous cells but in ESCC cells. CD36 suppression in the ESCC cells inhibited the proliferative and invasion abilities of ESCC cells. While FA-dependent viability was sup- pressed in ESCC cells with CD36 knockdown, the viability was recovered by EAAs treatment. Metabolome analysis suggests that the energy source for cell viability changed from FAs to EAAs in ESCC cells, with CD36 knockdown showing an alteration in metabolic enzymes for FAs and EAAs. To our knowledge, this is the first report describing a relationship between ESCC and CD36 in relation with cancer aggressiveness and energy source.
Metastasis is the main cause of death in most cancer patients. CD36 overexpression initiated lymph node and distant metastases in mouse models and human oral SCC samples, respectively.7 CD36 promoted cervical cancer cell growth and metastasis via the SRC/ERK pathway.21 Activation of the ERK pathway plays an important role in ESCC cell proliferation.22The invasion of ESCC cells was promoted via activation of the SRC/ERK pathway.23Here, we clarified that high levels of CD36 expression are sig- nificantly associated with ESCC progression, and the invasiveness of ESCC cells with CD36 suppression is inhibited. These findings also suggested CD36 functions as a metastatic initiator in ESCC via up-regulation of the SRC/ERK pathway. Estimation of CD36 expression in ESCC tissue sections may represent a promising biomarker of invasion and metastasis. Blockade of CD36 function may inhibit invasion and metastasis in ESCC.
CD36 expression correlates with a poor prognosis in many tumor types.7–9In this study, a significant correlation was observed between CD36 expression and poor survival in patients with ESCC; however, multivariate analysis revealed that CD36 expression was not an independent prognostic factor. It is assumed that the correlation between CD36 expression and tumor depth or lymph node and distant metastases, which are strong prognostic factors for ESCC, resulted in CD36 showing no independent prog- nostic significance in ESCC.
Reportedly, exogenous FAs enhance the proliferation rate of prostate cancer cells expressing CD36.9 In this study, the expression of rate-limiting enzymes of b-oxi- dation decreased by CD36 suppression in ESCC cells.
Moreover, ESCC cell proliferation was dependent on exogenous FA addition. Thus, cell survival and energy production of ESCC cells expressing CD36 seems to be regulated byb-oxidation of exogenous FAs.
Metabolic reprogramming is widely observed in various cancers, and FAs and EAAs are important fuels for cancer cells in addition to glucose.11–13 However, the correlation between CD36 and amino acid metabolism remains
Het1A TE1 TE8 TE15 KYSE70 KYSE140 CD36
beta-actin
CD36
beta-actin
TE15-control siRNA TE15-CD36 siRNA1
TE15-CD36 siRNA2
TE15-control siRNA TE15-CD36 siRNA1
TE15-CD36 siRNA2
TE15
TE1-mock TE1-CD36 overexpress CD36
beta-actin
* *
* *
* *
* *
* * * *
* *
* * *
*
0 0h 0.5
1 1.5 2 2.5 3 4 3.5
24h 48h 72h
NC siRNA1 siRNA2
NC Si1 Si2
NC Si1 Si2
0 0.2 0.4 0.6 0.8 1 1.2
CD36 mRNA relative expression
NC Si1 Si2
0 0.2 0.4 0.6 0.8 1 1.2 1.4
Relative expression
NC Si1 Si2
0 0.2 0.4 0.6 0.8 1 1.2 1.4
Relative expression
NC Si1 Si2
0 0.2 0.4 0.6 0.8 1 1.2 1.4
Relative expression
CPT1 LCAD ACC
0 50 100 150 200
Invasion cell number / fields
NC Si1 Si2 0
0.2 0.4 0.6 0.8 1.2
1
TE1-mock TE1-CD36 overexpress 0
1 2 104 1622
CD36 mRNA relative expression
Cell proliferation rate
0 0 1 2 3 4 5 6 7 8
24h 48h 72h
Cell proliferation rate
Ctrl CD36++
a
c
d
e
h g
f
b Cell proliferation rate
unclear. In this study, metabolome analysis revealed that the level of EAAs decreased and the metabolites of the TCA cycle did not significantly differ by CD36 knockdown in ESCC cells. The expression level of BCAT significantly enhanced by CD36 suppression. EAAs seemed to be con- sumed to replenish the intermediate metabolites of the TCA cycle in the absence of any FA supply via CD36.
Consistent with this hypothesis, we showed that CD36 suppression resulted in a decrease in cell proliferation that could be recovered by adding EAAs in the medium of ESCC cells but not by adding PA. ESCC cells without endogenous CD36 expression did not show PA-dependent proliferation but EAAs-dependent proliferation. Moreover, overexpression of CD36 allowed TE1 to utilize PA in addition to EAAs for more effective proliferation. These observations suggest that ESCC cells with endogenous CD36 use lipid metabolism via CD36 for cell survival and the energy source for ESCC viability is dependent on the FAs via CD36 existence. CD36 might be a key regulator of the dependency of FAs as energy source in ESCC cells.
ESCC patients often have difficulties with oral intake due to the obstruction caused by tumor growth at the time of diagnosis. Therefore, nutritional support is crucial to improve quality of life and tolerability of clinical interven- tions such as surgical treatment and chemotherapy.24 Nutritional formulations including FAs or EAAs are fre- quently used to improve the nutritional status of ESCC patients in clinical settings. We clarified that cell viability is enhanced by FA addition in ESCC cells expressing CD36 and by EAAs addition in ESCC cells not expressing CD36.
Thus, it can be suggested that ESCC patients expressing CD36 experience an unexpected progression of tumor by the administration of FA formulation, whereas those not expressing CD36 have unexpected progression by the administration of EAAs formulation. Pretreatment evalua- tion of CD36 expression would avoid inappropriate nutritional support, which could cause unexpected tumor progression depending on the CD36 status. It has been reported that blockade of CD36 by neutralizing antibodies or sulfo-N-succinimidyl oleate inhibited the metastatic process of oral SCC and hepatocellular carcinoma, respectively.7,25 Therefore, we hypothesize that targeting CD36 would be a specific therapy to control the progression of ESCC.
This study has several limitations, including its small sample size, retrospective nature, and ESCC patients enrolled being only resectable cases. Our data might not reflect all ESCC patients because advanced ESCCs with unresectable distant metastasis were excluded. Further prospective studies including larger cohorts and using pretreatment biopsy tissues should be conducted in the future.
In conclusion, CD36 was associated with cancer aggressiveness in ESCC, consistent with previous reports.
CD36 targeting may be an appropriate therapeutic strategy for aggressive ESCC using FAs for survival via CD36. Our metabolome analysis and in vitro experiments clarified that the energy source for cell viability was dependent on FAs in ESCC cells expressing CD36. These data provide new insights into the basic mechanism of CD36-dependent energy utilization for ESCC survival. Moreover, the pre- treatment evaluation of CD36 expression may help avoid inappropriate nutritional support, which could cause unexpected tumor progression depending on the CD36 status.
bFIG. 3 Functional analysis of CD36 in ESCC cell lines using RNA interference: a CD36 expression was not detected in Het1A, TE1, TE8, KYSE70, and KYSE140 cells by Western blotting. CD36 expression was detected only in TE15 cells.b-actin was used as the loading control; b CD36 suppression was confirmed by Western blotting and qRT-PCR after transfection with CD36 siRNAs (Si1 and Si2); c, d Proliferative and invasive ability of TE15 cells were suppressed in cells transfected with CD36 siRNAs (Si1 and Si2) compared with those transfected with control siRNA;eAlteration of FA metabolic enzymes in ESCC cells with CD36 suppression.
Although the expression levels of key enzymes for b-oxidation decreased, those of the key enzymes for FA synthesis enhanced by CD36 suppression. CPT1 carnitine palmitoyltransferase 1, LCAD long-chain acyl-CoA dehydrogenase,ACCacetyl-CoA carboxylase;
fProliferative abilities of TE15 cells under the serum-free condition with palmitic acid. Cell proliferation significantly decreased in CD36 suppression groups compared with that in the negative control after 72-h treatment with palmitic acid; g CD36 over expression was confirmed by Western blotting and qRT-PCR after transfection with CD36 vector transfection; h Proliferative abilities of TE1 cells increased in cells transfected with CD36 vector (CD36??) compared with those transfected with control vector (Ctrl). NC TE15 cells transfected with control siRNA, Si1 TE15 cells transfected with siRNA1,Si2 TE15 cell transfected with siRNA2,LCFAlong-chain fatty acid, *P\0.05
NC NC
Si1 0 Si1
0.2 0.4 0.6 0.8 1.2 1.4
1
Relative expression
BCAT
*
* * *
* *
*
* * * *
* *
0 0.2 0.4 0.6 0.8 1.2 1
0 0.2 0.4 0.6 0.8 1.2 1.4 1.6 1.8
1 2
0 0.2 0.4 0.6 0.8 1.2 1.4 1.6 1.8
1 2
0 0.2 0.4 0.6 0.8 1.2 1.4 1.6 1.8
1 2
0 0.2 0.4 0.6 0.8 1.2 1.4 1.6 1.8
1 2
NC Si1 Si2
Cell proliferation rate Cell proliferation rate Cell proliferation rate
Cell proliferation rate Cell proliferation rate
PA EAA
PA EAA PA+EAA
TE15
0 4 1 E S Y K 1
E T
5 1 E T 8
E T TE1
Ctrl PA EAA Ctrl PA EAA
Ctrl PA EAA Ctrl PA EAA
Mock CD36 overexpress
P = 0.18
0 1 0.5 2 1.5 3 2.5 4 3.5
Acetyl-CoA Oxaloacetate
Malate
Citrate
Fumarate
2-Ketoglutarate
Succinyl-CoA
Succinate Pyruvate
Threonine Tryptophan
Leucine
Histidine
Valine Isoleucine Phenylalanine
Tyrosine
12,000
8,000
4,000
0
200,000 150,000 100,000 50,000 0
1,200,000
800,000 400,000
0
8,000,000 6,000,000 4,000,000 2,000,000 0
2,000,000
1,000,000
0
8,000,000 6,000,000 4,000,000 2,000,000 0
12,000,000
8,000,000
4,000,000
0 6,000,000
4,000,000
2,000,000 0 30,000
20,000
10,000
0 10,000,000
8,000,000 6,000,000 4,000,000 2,000,000 0 8,000,000
6,000,000 4,000,000 2,000,000 0
30,000 25,000 20,000 15,000 10,000 5,000 0 400,000 300,000 200,000 100,000 0
400,000 300,000 200,000 100,000 0
a
c
e
d
b
Cell proliferation rate
ACKNOWLEDGEMENT We thank Ms. Yukie Saito, Ms. Harumi Kanai, Ms. Tomoko Yano, Ms. Yuka Matsui, Ms. Mizuho Murata, Ms. Sayaka Okada, and Ms. Kayoko Takahashi for their assistance.
DISCLOSURES All authors have no conflicts of interest.
FUNDING This study was supported by Grants-in-Aid for Scien- tific Research from the Japan Society for the Promotion of Science (Grant Nos. 17K19893, 18K07665, and 18H02877). The work was also supported in part by a Research Grant of the Princess Takamatsu Cancer Research Fund, Suzuken Memorial Foundation, and Pancreas Research Foundation of Japan.
REFERENCES
1. Kato H, Fukuchi M, Miyazaki T, Nakajima M, Tanaka N, Inose T, et al. Surgical treatment for esophageal cancer. Current issues.
Dig Surg. 2007;24:88–95
2. Ohashi S, Miyamoto S, Kikuchi O, Goto T, Amanuma Y, Muto M. Recent advances from basic and clinical studies of esophageal squamous cell carcinoma.Gastroenterology. 2015;149:1700–15 3. Silverstein RL, Febbraio M. CD36, a scavenger receptor involved
in immunity, metabolism, angiogenesis, and behavior.Sci Signal.
2009;2:re3
4. Samovski D, Sun J, Pietka T, Gross RW, Eckel RH, Su X, et al.
Regulation of AMPK activation by CD36 links fatty acid uptake to beta-oxidation.Diabetes. 2015;64:353-9
5. Koonen DP, Glatz JF, Bonen A, Luiken JJ. Long-chain fatty acid uptake and FAT/CD36 translocation in heart and skeletal muscle.
Biochim Biophys Acta. 2005;1736:163–80
6. Pepino MY, Kuda O, Samovski D, Abumrad NA. Structure- function of CD36 and importance of fatty acid signal transduction in fat metabolism.Annu Rev Nutr. 2014;34:281–303
7. Pascual G, Avgustinova A, Mejetta S, Martin M, Castellanos A, Attolini CS, et al. Targeting metastasis-initiating cells through the fatty acid receptor CD36.Nature. 2017;541:41–5
8. Hale JS, Otvos B, Sinyuk M, Alvarado AG, Hitomi M, Stoltz K, et al. Cancer stem cell-specific scavenger receptor CD36 drives glioblastoma progression.Stem Cells. 2014;32:1746–58 9. Watt MJ, Clark AK, Selth LA, Haynes VR, Lister N, Rebello R,
et al. Suppressing fatty acid uptake has therapeutic effects in preclinical models of prostate cancer.Sci Transl Med. 2019;11 10. Ladanyi A, Mukherjee A, Kenny HA, Johnson A, Mitra AK,
Sundaresan S, et al. Adipocyte-induced CD36 expression drives ovarian cancer progression and metastasis. Oncogene.
2018;37:2285–301
11. Hanahan D, Weinberg RA. Hallmarks of cancer: the next gen- eration.Cell. 2011;144:646–74
12. Pavlova NN, Thompson CB. The emerging hallmarks of cancer metabolism.Cell Metab. 2016;23:27–47
13. DeBerardinis RJ, Chandel NS. Fundamentals of cancer metabo- lism.Sci Adv. 2016;2:e1600200
14. Currie E, Schulze A, Zechner R, Walther TC, Farese RV, Jr.
Cellular fatty acid metabolism and cancer. Cell Metab.
2013;18:153–61
15. Li Z, Kang Y. Lipid metabolism fuels cancer’s spread. Cell Metab. 2017;25:228–30
16. Nieman KM, Kenny HA, Penicka CV, Ladanyi A, Buell-Gutbrod R, Zillhardt MR, et al. Adipocytes promote ovarian cancer metastasis and provide energy for rapid tumor growth.Nat Med.
2011;17:1498–503
17. Nakayama A, Aoki S, Uchihashi K, Nishijima-Matsunobu A, Yamamoto M, Kakihara N, et al. Interaction between esophageal squamous cell carcinoma and adipose tissue in vitro. Am J Pathol. 2016;186:1180–94
18. Owen OE, Kalhan SC, Hanson RW. The key role of anaplerosis and cataplerosis for citric acid cycle function. J Biol Chem.
2002;277:30409–12
19. Honjo H, Kaira K, Miyazaki T, Yokobori T, Kanai Y, Nagamori S, et al. Clinicopathological significance of LAT1 and ASCT2 in patients with surgically resected esophageal squamous cell car- cinoma.J Surg Oncol. 2016;113:381–9
20. Suzuki M, Yokobori T, Gombodorj N, Yashiro M, Turtoi A, Handa T, et al. High stromal transforming growth factor beta- induced expression is a novel marker of progression and poor prognosis in gastric cancer.J Surg Oncol. 2018;118:966–74 21. Yang P, Su C, Luo X, Zeng H, Zhao L, Wei L, et al. Dietary oleic
acid-induced CD36 promotes cervical cancer cell growth and metastasis via up-regulation Src/ERK pathway. Cancer Lett.
2018;438:76–85
22. Zheng ST, Huo Q, Tuerxun A, Ma WJ, Lv GD, Huang CG, et al. The expression and activation of ERK/MAPK pathway in human eso- phageal cancer cell line EC9706.Mol Biol Rep. 2011;38:865–72 23. Jiang Y, Zhang J, Zhao J, Li Z, Chen H, Qiao Y, et al. TOPK
promotes metastasis of esophageal squamous cell carcinoma by activating the Src/GSK3beta/STAT3 signaling pathway via gamma-catenin.BMC Cancer. 2019;19:1264
24. Birnstein E, Schattner M. Nutritional support in esophagogastric cancers.Surg Oncol Clin N Am. 2017;26:325–33
25. Nath A, Li I, Roberts LR, Chan C. Elevated free fatty acid uptake via CD36 promotes epithelial-mesenchymal transition in hepa- tocellular carcinoma.Sci Rep. 2015;5:14752
Publisher’s Note Springer Nature remains neutral with regard to jurisdictional claims in published maps and institutional affiliations.
bFIG. 4 Role of CD36 in cancer metabolism:aLevels of the standard metabolites (intensity: arbitrary unit) of TE15 cells with or without CD36 knockdown. Although the levels of intermediate metabolites of the TCA cycle in ESCC cells with CD36 suppression were not significantly different, the levels of two essential amino acids were significantly low (P\0.05, red figures) and those of six essential amino acids tended to be low (P\0.1, green figures) compared with those in control cells;bThe expression levels of a key enzyme for degrading BCAA, branched-chain aminotransferase (BCAT), were enhanced in ESCC cells with CD36 suppression;cComparison of the proliferative abilities of TE15 cells with or without CD36 knockdown under serum-free condition supplemented with palmitic acid or essential amino acids. Cell viability of the control TE15 cells was significantly greater under palmitic acid treatment than under essential amino acid treatment after 72-h incubation. On the other hand, cell viability in CD36 knockdown TE15 cells increased significantly with essential amino acid treatment compared with that with palmitic acid treatment;dPalmitic acid could not influence the cell viability of ESCC cells without endogenous CD36 suppression.
On the other hand, essential amino acids could increase cell viability in these cells. Palmitic acid significantly influenced the cell viability of TE15 compared with essential amino acids;ePalmitic acid alone could not influence the cell viability of TE1 with CD36 overexpression. On the other hand, palmitic acid significantly influenced the cell viability of CD36 overexpression TE1 cells in the presence of EEAs. NC TE15 cells transfected with control siRNA, Si1 TE15 cells transfected with siRNA1, Si2 TE15 cell transfected with siRNA2, Ctrl without palmitic acid or essential amino acid treatment, PA palmitic acid treatment, EAA essential amino acid treatment, *P\0.05