タイトル
Generation of fractal speckles in image plane
and their application to the measurement of
displacement
著者
Miyasaka, Eita; Uozum, Jun
引用
工学研究 : 北海学園大学大学院工学研究科紀要(12):
13-23
application to the measurement of displacement
Eita Miyasaka and Jun Uozumi
Abstract
Speckle patterns having fractal properties were generated experimentally in an image plane of a rough surface. Experimental generation of such speckles in the Fraunhofer diffraction region of a rough surface has been reported to be realized by illuminating the rough surface with a speckle pattern having an average intensity distribution obeying a power-law. The present optical system is a modified version of this configuration and consists of a double diffraction system with a spatial frequency filter having the intensity transmittance distribution that obeys a power law. Obtained speckle patterns were similar to those observed in the Fraunhofer diffraction region. The fractality manifested itself in the clustered appearance of speckle intensity with various sizes,and was confirmed by power-law behavior of the intensity autocorrelation functions of the patterns. On the basis of this long lasting correlation property, a method for measuring object motion over a long distance was proposed and its effectiveness was demonstrated experimentally.
1. Introduction
It is known that, when a speckle pattern is produced in the Fraunhofer diffraction region of a diffuser such as a rough surface of an object, and as far as the field can be described by zero-mean circular Gaussian statistics, the intensity correlation function of the speckle pattern is determined by the Fourier transform of the intensity distribution illuminating the diffuser,and does not depend on the statistics of microstructure of the diffuser. This fact implies that,by changing the intensity distribu-tion of the illuminadistribu-tion,forms of intensity correladistribu-tion funcdistribu-tions can be designed as desired. Employ-ing this property, an interestEmploy-ing kind of speckles to be referred to as fractal speckles was described theoretically by Uno et al. and experimentally by Uozumi et al. Recently,properties of the fractal speckle were discussed in more detail and it was shown to have complex structures called multi-fractal. In the following,the fundamental generation and properties of fractal speckle are explained.
One of the most prominent features of scattering from random mass fractals is that the intensity of forward small-angle scattering (Fraunhofer diffraction) of a fractal object shows a power-law dependence ξ , where ξ and D are the scattering vector and the fractal dimension of the object, respectively. When such a scattered field illuminates an ordinary diffuser,the diffracted pattern has the clustered appearance with no definite sizes of speckles. The intensity correlation function of the pattern is then obeys a power law. This behavior is to be compared with a typical property of mass fractal structures, i.e. spatial correlation C r of a fractal distribution of a density is given by
C r ∝r , (1)
Research Institute for Electronic Science,Hokkaido University(Present:Hitachi,Ltd.,Information & Telecommunica-tion Systems Company)
where D indicates the Euclidean dimension of the space involving the structure. For this reason,such a speckle pattern is regarded to have fractality and can be called fractal speckles. It is noted that, regardless of this unusual correlation property,the first-order statistics of the intensity is described by Gaussian statistics as in the case of ordinary speckle patterns generated by illuminating the diffuser by, for example, a plane wave with a circular or Gaussian intensity profile.
The purpose of the present paper is to generate such fractal speckles in an image plane of a rough surface experimentally, and to apply them to a speckle-based measurement of object motion. The speckles in the image plane are more suitable for this kind of measurements than those in the free propagation geometry since, when the object translates, the image-plane speckles also translate parallel to the object motion while boiling motion occurs in the free propagation geometry. Further-more, by virtue of fractality, which implies the presence of a broad linear region in the intensity correlation function in a logarithmic plot,a long distance measurement would be expected as compared with the case of ordinary speckles.
In Section 2,we first mention briefly properties of the field diffracted by a diffuser to give the basis of subsequent development,and then discussion follows as to properties of the field in the image plane of the diffuser,including its intensity autocorrelation function,and the maximum and,minimum sizes of speckles. In Section 3, a method for producing spatial frequency filters is introduced, and then properties of experimentally generated speckles are discussed. Finally in Section 4, a method for measuring object motion is proposed on the basis of the fractal speckles in the imaging geometry,and the results of the measurement using fractal speckles are shown.
2. Theoretical background
Although our aim is to generate fractal speckles in the image plane of an object, let us consider first the field scattered from the cascade of a fractal object-rough surface configuration. The field scattered or diffracted by a fractal is called diffractal. If the fractal is a random mass fractal and if the interacting wave is a coherent optical wave,then the resulting diffractal becomes a speckle field with average intensity distribution in the form of the power function
I >∝ξ , (2)
as mentioned in the introduction. In any practical situation,however,the singularity of this function at the origin never appears,but saturation to a certain finite value is observed. Such a behavior can be took into consideration by rewriting eq. (2)as
I >= I 0 >(1+αξ) , (3)
whereα=kR/z,in which k=2π/λis the wavenumber and λ,z and R stand for the wavelength of light, the distance of the observation plane from the object,and the maximum scale of the object,respective-ly. Next consider an optical system shown in Fig.1. When,in general,a rough surface placed in the plane P is illuminated by a speckle field produced by the object placed in the plane P , a complex amplitude distribution A in an observation plane P located in the Fraunhofer diffraction region of the diffuser is given in terms of the complex amplitude a of the illuminating speckle, random amplitude transmittance t of the diffuser and a pupil function P limiting the illuminated area of the rough surface, and is expressed by
A = e
iλz a t P exp −i
2π
This is what is called doubly scattered speckle or speckled speckle. When the illuminating speckle field is produced by the scattering from the mass fractal object as described above,a is interpreted as the speckle complex amplitude with a unit average intensity while I >/ I 0 >given by eq.(3)is considered to play a role of the intensity transmittance of the pupil function P . In such a case,with the Gaussian assumption of the field A ,the influence of the granularity of the diffuser(the term t ) vanishes eventually, and consequently the normalized correlation function C r of the speckle inten-sity in the observation plane P is finally given by
C r = I I + >− I > I + >
I > I + > ∝ r/α , (5)
for 1<D <2 and r/α≪1. Thus,the correlation function behaves as a power function,and due to the correspondence of eq.(5)to eq.(1),the speckle pattern generated from such configuration can be said to have fractality.
Next,we consider modifying the optical geometry shown in Fig.1. That is,the fractal scattering object in P is replaced by the diffuser having a rough surface placed in P ,while a spatial frequency filter is placed in P instead of the diffuser. The filter is designed to have intensity transmittance which is proportional to the average intensity distribution given by eq. (3). With this configuration, eq. (4)still holds for the observed field A by identifying the functions a and P in eq.(4)with the speckle field in P produced by the diffuser and amplitude transmittance of the spatial frequency filter, respectively. It is noted here that, the term D is not the fractal dimension of the object but a negative exponent of intensity transmittance of the filter. The factor t is to be set to unity in this configuration. In addition, because of the absence of a fractal object, the factor α is not its size but depends on the radius of the saturated central peak of the filter,which,however,can be associated with the maximum size of a virtual fractal object as will be clear in Section 3.1. As a consequence, the normalized intensity correlation function in the observation plane which is now the image plane of the object (diffuser)is given by exactly the same function as eq.(5). Hence,it is concluded that the speckle pattern in the image plane has fractality for the same reason as in the previous case. A difference will appear in a dynamic property of speckles when the object is in motion. That is, the speckle pattern in the image plane translates parallel to the lateral motion of the object,while a purely boiling motion appears in the previous configuration. As we mention in Section 4,this dynamic property enables us to restore the object motion by means of the transition of the pattern.
Meanwhile,the spatial frequency filter described above can also be regarded as a superposition of a set of concentric circular apertures with different diameters d and the same intensity(or amplitude) transmittance. From this point of view,it can be said that the maximum and minimum speckle sizes in the fractal speckles are derived from the minimum size d and maximum size d of those
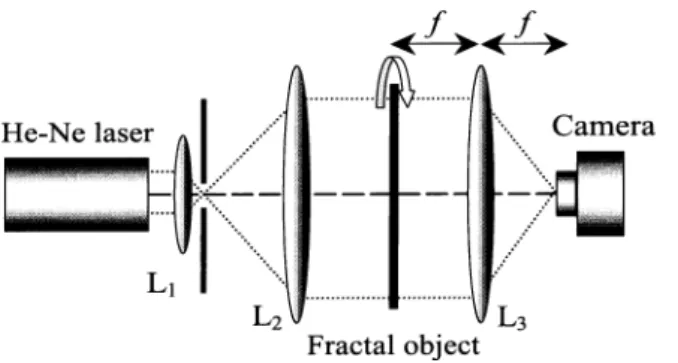
Figure 1 Optical system for producing speckled speckles with fractal property.
apertures, respectively, and hence the range of the speckle size δis given by λf
d δ
λf
d , (6)
where f denotes the focal length of the lens put behind the filter to perform Fourier transform. It is noted that the intensity correlation function could be described by a superposition of the set of correlation functions of different speckle patterns,each produced by the aperture with the correspond-ing diameter. Hence,eq.(6)can be regarded as the region of r in which the power function of eq.(5) holds.
3. Generating fractal speckles in an image plane
3.1 Spatial frequency filter
As a first step of the experiment, it is necessary to produce appropriate spatial filters with power-law transmittance. Among several possible approaches such as a spatial light modulator (SLM) employing a LCD and a laser-printer output of an image file of the filter on a computer, we adopted a photographic recording for this end. The reason for this is that the photographic film exhibited the highest contrast of intensity transmittance of all the approaches the authors examined. A high contrast is an important property in suppressing undesired background light transmitted by the filter. If a LCD-based SLM can achieve sufficiently high contrast, it would be preferred for its high addressability and controllability of the exponent of the power function.
With reference to Fig.2,a Gaussian beam emerging from a He-Ne laser was suitably expanded and collimated by lenses L and L ,and brought to illuminate a fractal object. The objects were provided by employing two-dimensional band-limited Weierstrass functions, as shown in Fig. 3. To make them suitable for the experiment,those functions were printed out from a computer and subsequently photographed on films to be served for objects. The field scattered by the object was Fourier transformed by lens L to produce a speckle pattern,to which a photographic film placed on the back focal plane of L was exposed. To smooth out undesired speckles,a circular average of the intensity was recorded by rotating the object during the exposure time. Since the recorded and developed film was negative, its reversed image with the corresponding positive transmittance was recovered by photographing the negative on another film with higher contrast, and thus the desired object was obtained as shown in Fig. 4.
Figure 2 Experimental set-up for producing spatial frequency filters.
Figure 3 Random fractal object drawn by using two-dimensional band-limited Weier strass function.
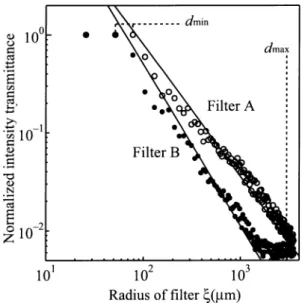
-The intensity transmittances of the filters are plotted logarithmically in Fig. 5. Disregarding the saturated central peaks,those transmittances fit approximately to power functions with exponents D = 1.4 and 1.7, and these filters are denoted by A and B, respectively, from now on.
Although it is not very difficult to control the fractal dimension of the fractal object,and,hence, to control the exponent of power function of the scattered light,there are some difficulties in realizing accurate transmittance on the filter. Major difficulties are due to the non-linearity caused by the photographic gamma and the saturation effect in the relation of photographic density to exposure. This saturation effect gives rise to an area with nearly constant saturated transmittance in the filter. It is noted that the diameter of such a saturated area gives d defined in eq. (6). Furthermore, the contrast of the photographic film is still not enough to suppress the undesired background transmittan-ce of the produtransmittan-ced filter.
3.2 Experiment
The configuration for generating fractal speckles in the image plane is shown in Fig.6. The beam emerging from an Ar-ion laser (λ=514.5 nm) was collimated in the same manner as the previous subsection,and was brought to illuminate a ground glass plate placed at the front focal plane P of lens L (focal length f=10 cm). The speckle pattern formed by the scattering from the plate was incident on the spatial frequency filter,placed at the back focal plane P of L . Here,we used the filters with the exponents of D =1.4 (filter A)and 1.7 (filter B),which are,to be more precise,the exponent given in eq.(3). In addition,a circular aperture of a diameter d=6 mm was placed just behind the filter to reject the field transmitted through the portion of the filter where the transmittance has reached the background level that is the lowest achievable value with the employed film. It is noted that this diameter d gives d that appears in eq. (6). Then, the field transmitted through the aperture was again Fourier transformed by lens L (focal length f=30 cm)and thus a doubly Fourier transformed speckle pattern was generated at the back focal plane P of lens L , which is the image plane of the object located in P . The pattern was recorded by a CCD camera and stored in a computer through a frame memory as discrete data with 256 levels. In addition,as it can be seen,the pattern was three times magnified by the double-diffraction imaging system, so that the smallest speckle grains can be
Figure 5 Intensity transmittance of the filters A and B.
Figure 4 Spatial frequency filter with power-law transmittance.
resolved by the pixel size of the CCD.
4. Results and discussion
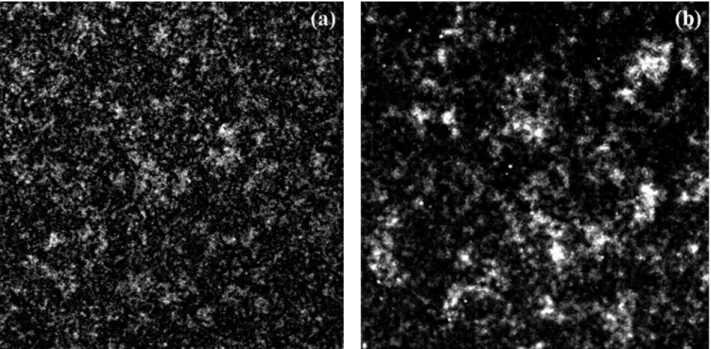
Figures 7(a)and (b)show the speckle patterns detected by the CCD camera using the filters A and B, respectively. For comparison, an ordinary speckle pattern was also recorded by removing the power-law filter with only the circular aperture of d=6 mm left in P , and is shown in Fig. 8. As compared with Fig.8,the appearances of the patterns in Fig.7 are quite different in the sense that there are various sizes of speckles and they form a clustering feature of intensity. These appearances remind us of a certain kind of clouds in the sky,which are familiar structures of fractals in nature,and this fact strongly implies the existence of fractality in these patterns.
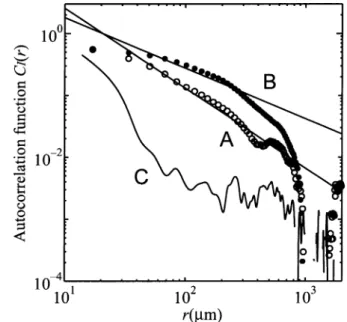
Now we turn to the quantitative estimation of the fractalities in the patterns. To this end, we calculated autocorrelation functions of speckle intensities. From each pattern of Figs. 7 and 8, two-dimensional correlation function C was first calculated and was then reduced to a one-dimensional function C r by taking an angular average. The results are shown in Fig. 9.
In Fig.9,the symbols A and B correspond to the speckles due to filters A and B,respectively,while the symbol C is for the ordinary speckle shown in Fig. 8. As it can be seen from Fig. 9, there are
Figure 7 Speckle patterns generated by spatial frequency filters of D=(a) 1.4 (filter A) and (b) 1.7 (filter B). Figure 6 Experiment set-up for generating fractal speckles in the image plane.
approximately linear dependence in the log-log plot from r 30 μm to at least r 500 μm for both A and B. On the other hand, there is no appreciable linear dependence in C, for which the correlation function has a main lobe and some side lobes and seems to be expressed by a Besinc function. Thus, the characteristics of the curves A and B are evident.
The finite extent of the linear regions in the correlation functions can be easily found to be the consequence of two cutoffs of speckle sizes given by eq.(6). Since the diameter d of the saturated area in the central peaks of the filters is difficult to control in the present method,the outer cutoffs in the correlation functions are different from each other. On the other hand, the lower cutoffs in the linear region are nearly the same for A and B, and is approximately r=30 μm, as a result of the circular aperture put behind the filter.
In the regions of the linear dependence,the curves A and B fit approximately to the solid lines in Fig.9 with slopes −1.2 and −0.6,respectively. These slopes verify the theoretical prediction of eq.(5), since,from these slopes,the exponent in eq.(5)recovers D =1.4 and 1.7 for A and B,respectively. By applying the definition of fractals given by eq. (1) to the autocorrelation properties of the intensity distributions, these patterns can be concluded to be fractals. By denoting the fractal dimension of these speckle patterns by D , it follows from eq. (1) with D =2 that D =0.8 and 1.4 for A and B, respectively.
There are some fluctuations around the straight line even in the region of the linear dependence. A reason for these fluctuations can be the perturbation and non-linearity of the filter caused during the photographic developing process. Another and more serious reason is the influence of the background transmittance of the filter. Since this background transmittance is not negligible,the use of circular aperture to reject it gives rise to an appreciable and abrupt falloff of the transmittance at the edge of the aperture. This means that the component of a diameter d has a rather large contribution to the speckle size distribution and yields an appreciable amount of the smallest speckle grains as is visible in Fig. 7. Hence, the correlation of the smallest speckles is emphasized and gives rise to the fluctua-tions in the entire correlation property.
Figure 8 Speckle pattern generated by placing only a circular aperture instead of the filters.
Figure 9 Angular-averaged intensity correlation functions of speckles in Figs. 7 and 8.
5. Measurement of object motion using fractal speckles
5.1 Experiment
As an application of the fractal speckles generated in the previous section, we propose a method for measuring object motion using such speckles. First, we describe the method briefly.
In the beginning,a speckle pattern in the image plane of the object without any motion is recorded by a photographic film or CCD as a reference speckle pattern. This pattern is placed back,by means of the film after development or by a SLM such as a LCD displaying the CCD-recorded image,at the exact position where it was recorded. In this configuration,the speckle pattern produced by the object illuminates the reference pattern,and the intensity distribution just after the transmission through the reference pattern is proportional to the product of two speckle patterns. Hence the total or integrated intensity of this distribution corresponds to the correlation between two patterns. Since a lateral displacement of the object results in the corresponding displacement of its speckle pattern in the image plane,the detection of the integrated intensity between the illuminating speckle with displacement r in the object coordinate and the reference speckle amounts to taking the autocorrelation function C r in the equality in eq.(5)apart from the background term subtracted in eq.(5). It is noted here that, since the object was three times magnified by the lenses, we have r=3r . Thus, by operating in the linear varying region of the autocorrelation function derived in advance,the displacement of the object can be detected from the variation of the optical correlation. This method was first introduced by Weigelt . Since the autocorrelation function of fractal speckles has a broad extent of the linear region in a logarithmic plot,considerable expansion of the measurement range is expected as compared with ordinary speckles.
In the present experiment,we adopted an LCD to display the reference speckle,so that troublesome operations accompanying with the use of a photographic film, such as exact placement of the film at its original location and its repeated replacement in every experiment,are avoided. An advantage of using fractal speckles is that, the correlation peak is so narrow and sharp that the center of the correlation function can be located with a high precision in practice. In the speckle correlation method,in general,a long measurement range is realized by refreshing the reference speckle when the correlation drops to a certain value. In the use of this refreshment,the LCD is also more appropriate for redrawing new reference patterns sequentially. It is another advantage of employing fractal speckles that the refreshment rate can be decreased, since the range of the measurement for each reference pattern is made longer than ordinary speckles.
The experimental set-up is shown in Fig. 10. The process of generating speckles is the same as the one in the previous section, except for the object (diffuser)being placed on the translatable stage driven by a motor in the plane P . The reference speckle pattern was detected in the plane P by the CCD,stored in a computer through a frame memory,and displayed on the LCD panel in the plane P . In addition, the speckle pattern in P is imaged in P by a lens L with the magnification adjusted to 9.1 to make the imaged pattern coincide with the scale of the reference pattern displayed on the LCD. The transmitted intensity emerging from the LCD was collected by lens L ,and the intensity distribu-tion in the observadistribu-tion plane P was detected by another CCD camera.
During the object being displaced with a constant velocity of 30 μm per second, the intensity distributions were recorded at the rate of 6 frames per second, each with 4096 levels of intensities. Then all the intensity data across each frame were summed up and the resulting total intensity was normalized in the same manner as eq. (5). Consequently, the cross correlations for every 5 μm displacement were calculated.
5.2 Results and discussion
The values of the correlations are plotted logarithmically as a function of the displacement of the object in Fig.11. A and B again denote the results for filters A and B,respectively,and the theoreti-cally expected power functions, which are to fit the linear regions of the calculated autocorrelation functions, are also plotted with lines. Note that, in this case,the abscissa shows the displacement in the object plane, and hence corresponds to one-third of the translation in the image plane. By comparing correlation values in Fig.11 with the linear region in logarithmic plot of the corresponding autocorrelation function in Fig.10 or with its fitting line,the amount of the object motion is estimated. The deviation of the correlation from the fitting power function was calculated by taking the ratio of these values for each displacement r and is shown in Fig. 12. Thus, the ratio approaching unity indicates high accuracy in the measurement.
As it can be seen from Fig.12,the correlation ratio has a nearly constant region approximately for r<100 μm for A and is extended further for B. Since the detectable range with ordinary speckles is about 10 μm in the case of the same configuration except for replacing the filter by a circular aperture with d=6 mm, a considerable expansion of the measurement range was achieved by virtue of fractality.
Figure 11 Normalized correlation between the ref erence and the illuminating speckles detected experimentally.
- Figure 12 Ratio of measured correlation to the power function fitted to the autocorrela tion function for each filter.
-Figure 10 Experiment set-up for the measurement of object motion.
高
さ
そ
ろ
え
て
ま
す
★
★
図
の
When Fig.11 is compared with Fig.9,it is found that,the linear regions in the former are narrower than those in the latter. This result implies that there is a certain limitation in the present configura-tion on the measurable range expected from Fig.9. When the normalized correlaconfigura-tion in Fig.11 drops to around 10 , the undesirable background intensity transmittance of the LCD panel becomes more appreciable,since it is not attenuated essentially no matter how the object is displaced. Since the slope for A is steeper, its normalized correlation drops much earlier than B. As a consequence,detectable range of filter A is much more restricted than that of B. On the other hand,a higher value of D (such as filter B) is accompanied with some other problems. As the slope of the power function becomes gentler, the correlation decreases more slowly, which implies a lower sensitivity of the measurement. In addition,as D gets higher,the transition in the transmittance of the filter from the power-law region to the central flat area becomes clear, and as a result, speckles of the corresponding size are more emphasized in comparison to the speckles of smaller sizes. In such a case, the total intensity of the speckle pattern in the detecting area becomes more fluctuated because the number of large speckle grains is small on average and is not sufficient to effect a stable statistical average. Consequently,the correlation including such unstable speckle component causes inaccuracy in the measurement. Note that, in this case, these large-scale speckles are dominant not only because of the small size of the central peak of the filter but also because such small-size aperture components yield relatively longer contribution to the speckle function than larger-scale aperture components through the steep variation of the intensity transmittance of the filter. To overcome this instability,it is necessary to broaden the detecting area in P so that sufficient statistical average of the speckles is taken. It is hence concluded that there is a tradeoff between the measurement range and the accuracy,and that a proper exponent D should be chosen depending on the type of the object motion and the purpose of the measurement. For example,for an object moving fast,value D close to 2 is thought to be more effective,and for one moving more slowly in a restricted area, a small value of D would be more appropriate for the measurement. In that respect, the exponent of the filter is desired to be controlled more easily.
Considerable advantages were achieved by the introduction of fractality in the speckle pattern. To improve the accuracy and the measurement range, however, a more sophisticated SLM having sufficient contrast and resolution is required, so that the undesired background transmittance is reduced more drastically and that the total intensity of the speckles is averaged more effectively.
6. Conclusion
A method for generating fractal speckles in the image plane of an object was shown, and was verified experimentally using the spatial frequency filter with power-law intensity transmittance. In addition,an application of the fractal speckles to the measurement of object motion is proposed. By detecting the correlation between the reference speckle and the speckle translating due to the lateral motion of the object,and by referring to the linear region in the logarithmic plot of the autocorrelation function of the pattern computed in advance, the motion of the object can be recovered.
Despite the absence of any fractal object in the configuration, the intensity correlation functions of the speckle patterns take the form of power function with long lasting tails, and hence, proved to have fractality. As the fractal dimensions of the speckle patterns, values of D =0.8 and 1.4 were obtained for the filters with exponents D =1.4 and 1.7, respectively.
Similar to the fractal speckles created by the diffraction geometry, these patterns have also the characteristic features,namely the lack of definite speckle size and the presence of clustering appear-ances as its consequence. In the present case,the resultant fractality is due to the power-law distribu-tion of the filters,and the maximum and minimum sizes of speckles are caused by the lower and higher
function enables us to measure the motion from short to long range with a single configuration. Although,in the present experiment,the measurable range was restricted by the undesired background transmission of the LCD as well as of the spatial filter, a ten times wider measurement range was achieved as compared to the case of traditional speckles. In addition, in the case that much longer motion is to be measured,the refreshing rate of the reference pattern can be much lower for the fractal speckles than for the traditional speckles.
There exist, however, some fluctuations around the linear dependence in the correlation function of the fractal speckles. It is considered to be caused by background transmittance of the spatial frequency filter and the non-linearity occurring in the developing process. To overcome these undesir-ed factors, a SLM having a higher performance with higher contrast and linearity is strongly longundesir-ed for. On the other hand,the fact that the linear region of the autocorrelation function depends on the extent of the filter implies the possibility to expand its linear region to the smaller and larger distances with the use of better filter, and it also results in the expansion of the detectable region in the measurement. The controllability of the exponent of the filter is also a desired property for the purpose of better measurement. It enables to adjust the value of the exponent depending on the priority between detecting range and accuracy. Also in these respects,more sophisticated filter,which can be operated by a computer for instance, is desired.
The present study was partially presented in conferences and published in their proceedings.
Rererences
1) J.W.Goodman:in Laser Speckle and Related Phenomena, 2nd edition,J.C.Dainty(Ed.),(Springer,Berlin,1984)p.9. 2) K.Uno,J.Uozumi,and T.Asakura:Correlation properties of speckles produced by diffractal-illuminated diffusers,
Opt. Commun., 124, 1, 2, pp. 16-22, 1996.
3) J. Uozumi, M. Ibrahim, and T. Asakura:Fractal speckles, Opt. Commun., 156, 4-6, pp. 350-358, 1998.
4) H. Funamizu and J. Uozumi: Multifractal analysis of speckle intensities produced by power-law illumination of diffusers, J. Modern Opt., 54, 10-12, pp. 1511-1528, 2007.
5) J. Feder:Fractals (Plenum, New York, 1988).
6) H. Takayasu:Fractals in Physical Science (Manchester University Press, Manchester, 1990). 7) M. V. Berry:Diffractals, J. Phys. A: Math. Gen., 12, 6, pp. 781-797, 1978.
8) M. E. Fisher and R. J. Burford:Theory of critical-point scattering and correlations.I.The Ising model,Phys. Rev., 156, pp. 583-622, 1967.
9) D.L.Jaggard and X.Sun:Scattering from fractally corrugated surfaces,J. Opt. Soc. Am. A,7,6,pp.1131-1139,1990. 10) G. P. Weigelt: Real time measurement of the motion of a rough object by correlation of speckle patterns, Opt.
Commun., 19, 2, pp. 223-228, 1976.
11) J.Uozumi,K.Tsujino,E.Miyasaka and M.Ibrahim:Fractal speckles in diffraction regions and image plane,Proc. SPIE, 3749, pp. 322-323, 1999.
12) J. Uozumi:Light scattering from fractal random media, Proc. SPIE, 4242, pp. 13-24, 2001.
13) J.Uozumi:Fractality of the optical fields scattered by power-law-illuminated diffusers,Proc. SPIE,4607,pp.257-267, 2002.