ID:
JJF00309
Title:
The influence of oversea investors on Japanese socially conscious
funds
Author:
Naoya Takezawa
Pages:
47-65
Is Part Of:
Japan Journal of Finance
Vol. 36 / No. 1.2
Dec. 2016
Publisher
Japan Finance Association
■大会特集論文
The Influence of Oversea Investors on Japanese Socially
Conscious Funds
*Naoya TAKEZAWA
(NANZAN University) Abstract
The purpose of this paper is to indirectly investigate the risk attributes of Socially Conscious
Funds that result from oversea investors in the Japanese market during the early 2000’s. The
risk attributes are proxied with benchmarks such as the domestic market index and an overseas apparel & luxury goods index. The apparel & luxury goods index is chosen as the benchmark for speculative overseas investors because luxury consumption is known to have a correlation with the investment activity of wealthy individuals with a high fraction of equity wealth. Such overseas investors tend to possess a relatively low level of risk aversion, and this paper identifies the impact of such speculative overseas investors (as approximated by the apparel & luxury goods index) in comparison to Socially Conscious Funds investors (who are argued to pursue long term goals with a buy-and-hold strategies). A rolling regression analysis also reveals the influence of speculative investors on various industries. A clear breakpoint is found around the financial crisis of 2008, but the change in the influence of Apparel & Luxury goods index differs between the industrial sectors.
Keyword: Socially Conscious Funds; Luxury Consumption; Fund Style Analysis, Japan, Risk
* The author appreciates Professor Takehara, Ibbotson Associates Japan,Inc. and the Waseda Finance Research Center for providing access to the Morningstar Database. The author would like to thank Professor Bremer, Professor Nagata (discussant) and the participants of the 2016 Japanese Finanacial Association annual meeting, and the anonymous referees for their comments which has significantly improved the manuscript from its initial draft. However, the author is responsible for all remaining errors. The research has been partially supported by the JSPS KAKENHI Grants-in-Aid for Scientific Research (C) 26380410. The author acknowledges financial support from the Health Labour Sciences Research Grant
(Research on Policy Planning and Evaluation). The author has no relevant or material financial interest that relates to the research described in this paper.
1 Introduction
This paper examines the risk return characteristics of the Japanese equity market by observing socially conscious fund (SC fund) returns and U.S. market returns. The influence of overseas investors increased rapidly during the early 2000 s, but suddenly decreased after the financial crisis that started in 2008. The speculative investments of such overseas investors are motivated by short term gains, as opposed to the aim of many SC funds that invest in firms that fulfill their socially responsibility to the firms various stakeholders and seek sustainable long term gains. The analysis of the two types of investors becomes important in assessing the long term financial risk. If the two types of investors truly do behave in these ways, it is natural to conjecture that the returns generated by these investors can be decomposed into two distinct factors. Even though I only consider two factors that may not span the entire market, it is still important to identify factors that may represent speculative and sustainable investment behaviors. The restrictions imposed on socially conscious investment forces fund managers to allocate funds in a smaller universe of assets, which may consequentially yield a portfolio that is less efficient in comparison to portfolios comprised of a broader class of assets. If the goal of a socially conscious investment policy is not to achieve the most efficient portfolio, what are SC funds pursuing? Such an investment policy may be justified if the returns earned from SC funds are generated by sustainable firm activities that are not affected by speculative investments chasing short term gains. This reasoning is in line with the finding of Cox et al. (2004), who claims that social performance accrues in the long run.
Bauer et al. (2005) show that socially conscious funds do not out/underperform conventional mutual funds and El Ghoul et al. (2011) show that the cost of capital for firms with higher CSR scores is lower. At a glance, it appears as if there is no difference (nor advantage) of investing in either conventional or socially conscious mutual funds in the risk/return framework. This paper shows that SC funds may not be superior, nor efficient in their financial performance, but still have a role (at least in the Japanese equity market) in the sense that they reveal a priced factor that is unaffected by speculative overseas investment. This conjecture is verified by decomposing the stochastic factors of SC funds and the speculative investments of overseas investors (as approximated by the U.S. market s luxury sector).
Shirasu (2011) has shown that SRI (Socially Responsible Investment) funds performed better than conventional mutual funds, which tended to be better performing large firms. It is tempting to claim that the firms selected by SC funds tend to be more conservative, i.e. possess a higher risk aversion against speculative investments in the standard risk/return framework. This seems to indicate that SC funds are simply focusing on low beta firms as opposed to socially conscious firms. This issue is answered in subsequent analysis of the inter-temporal change in the relation between the Japanese market, SC funds and the U.S. apparel & luxury goods index via a style analysis as proposed by Sharpe (1992).
good subsector index (as a proxy for luxury consumption returns) in comparison to the overall market index return. Because this apparel & luxury goods index is a SP500 subsector index, the price appreciations/depreciations are very likely to be associated with the equity ownership of the Japanese equity market due to the high correlation between the U.S. and Japanese equity market.
The ownership proportion by overseas investors (U.S. investors are the most dominant) has Figure 1 Oversea Investment Flow to the Tokyo Stock Exchange
18,000,000,000 16,000,000,000 14,000,000,000 12,000,000,000 10,000,000,000 8,000,000,000 6,000,000,000 4,000,000,000 2,000,000,000 0 Value 2005 /01/ 01 2005 /07/ 01 2006 /01/ 01 2006 /07/ 01 2007 /01/ 01 2007 /07/ 01 2008 /01/ 01 2008 /07/ 01 2009 /01/ 01 2009 /07/ 01 2010 /01/ 01 2010 /07/ 01 North America Europe Asia
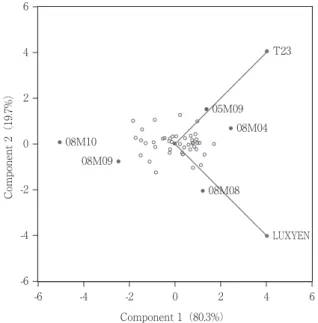
Figure 2 OrthonormalLoadings biplots apparel & luxury goods index (LUXURY),
SC funds(F2_RET, F4_RET, F5_RET, F6_RET, F9_RET, F12_RET, F14_RET)is on the left. The biplot of the apparel & luxury goods index(LUXURY), the TOPIX index(T23)and its 33 sectors(T1 to T22 and T24 toT34)is on the right
12 8 4 0 -4 -8 -12 -12 -8 -4 Component 1(83.4%) Component 2(8.7%) 0 4 8 12 20 15 10 5 0 -5 -10 -15 -20 -20 -10 Component 1(60.8%) Component 2(6.5%) 0 10 12
increased significantly during the early 2000 s followed by a rapid drop in the summer of 2008 (i.e. the financial crisis) as observed in Figure 1. If overseas speculative investment is well approximated by the apparel & luxury goods index, then principal component analysis (Figure 2, left) supports the conjecture that SC fund managers are successful in mimicking the market component that is not linked to luxury consumption. Under this assumption, the SC funds appear to successfully filter out the impact of short term speculative investments funded by excess wealth generated by equity market shocks. One point that should be noted is that this overseas speculative investment component that is filtered out by SC fund managers is correlated to the overall equity market (as captured by the TOPIX representing 33 sectors) as depicted in Figure 2 (right). Figure 3 is the orthonormal biplot of the apparel & luxury goods index and the TOPIX composite index (T23). Similar to the case of the SC funds, the two factors are nearly orthogonal to each other. However, the two factors are both correlated with the first component, and have offsetting impacts on the second component. Because most of the SC funds are passive funds that are benchmarked to the TOPIX, it is not surprising that the orthogonal property remains in the analysis of Figure 2. The difference lies in the fact that the SC funds are successful in reducing their correlation with the apparel & luxury goods index effect. Because it is hard to believe that SC fund managers are trading against the apparel & luxury goods index, it is more likely that they are trading away the volatility imposed by speculative overseas investment activity. The biplot of the TOPIX index (labeled T23) and its 33 sectors (labeled T1 to T22 and T24 to T34) differ to the SC fund factor biplot in Figure 2 (left and right respectively). Table 2 Panel C tells us that most of the TOPIX sectors are all positively correlated to the apparel & luxury goods index in the first principal component, but differ in the second principal component. The electric power & gas sector (T7) and Air Transport (T1) are only marginally correlated to the apparel & luxury goods index, which imply that such sectors may be the sectors favored by the SC funds.
Thus, it can be concluded that regardless of the performance and/or the risk-return characteristics of the SC funds, these funds play a role in the Japanese market by providing a benchmark of returns that are unaffected by speculative short term investors.
1.1 Literature
Insurance effect of SC funds
Godfrey et al. (2005) find that Corporate Social Responsibility (CSR) provides an insurance-like property to stock market value at the firm specific level against negative events (idiosyncratic shocks that are not at the industry or economy wide level). Similarly, Peloza (2006) argues that CSR can potentially serve as insurance for corporate financial performance (CFP) by mitigating the effects from negative events that could harm the CFP of firms. This situation is likely to be observed as a win-win situation such as when CFP and CSR are complimentary (rather than conflicting ) and simultaneously when the time horizon of managers are short-term (rather than long-term ). This suggests that SC funds are more resilient to adverse movements in the financial market. If
investing in SC funds signals financial gains (i.e. provide a win-win relationship between CFP and CSR) that are immune to adverse movements due to financial turmoil, firms that are selected by SC fund managers are expected to reduce the possibility that CSR activities will be in conflict with CFP. With CSR insurance on hand, investors will be more likely to keep their money in the SC funds especially in the case of financial turmoil. But, this is only if the SC fund managers are really successful in screening/selecting firms whose activities are sustainable. Under this hypothesis, investors with long term goals will attempt to allocate their investment in SC funds to achieve sustainable financial gains instead of liquidating their investment to receive immediate gains. This type of investor utility cannot be generated by short term equity gains because the excess gain from short-term investments is difficult to maintain in volatile equity markets, and is thus often liquidated quickly to capture immediate gains.
If the investor s wealth is generated by short term income gains, it is very tempting for such an investor to liquidate her position immediately. Even if there is no consumption opportunity to capture with the wealth shock, the investor cannot achieve a higher utility level by investing in SC funds in comparison to the liquidation of wealth shock investment. Thus, such investors will seek higher gains that match the utility gains achieved by the immediate consumption of excess wealth.
The two types of investors mentioned above, possess distinct characteristics in the sense that the former investor will concentrate her assets in positions that provide long term sustainable gains, while the latter will pursue risky opportunities that promise high marginal gains that supersede the marginal gains obtained from immediately liquidating her investments. The two types of investors are complementary in their observed roles in financial markets. The first type of investor will be more passive in her investment strategy, thus holding a portfolio with a lower risk return profile, and maintaining a buy and hold strategy due to the sustainability of the assets on hand. The second type of investor will seek immediate financial gains and quickly withdraw her assets from any opportunity that seems to generate losses (and even gains that are inferior to the utility obtained from the immediate consumption of wealth). In a simplified world, this type of investor will either consume luxury goods to obtain high marginal utility or invest in risky financial assets that promise high gains in the short term that exceed the marginal utility gained by consuming luxury goods. The two types of investment behavior will be examined later by approximating their wealth with SC funds and apparel & luxury goods index returns.
Corporate Behavior and the Financial Performance of the SC funds
Although there are various motivations for corporations to be socially responsible, this paper focuses on the influence of corporate performance based on the evaluation received from SC fund managers and speculative overseas investors. It is important to note that the aim is not to directly associate the socially conscious behavior of corporations to their financial performance, but rather shed light on the selection criterion of social conscious funds that screen the socially conscious behavior of firms that they consider for investment. The specific question of interest is whether SC funds are successful in screening out firms that are likely to be targets of speculative overseas
investors. Because SC fund performance is highly correlated with the market, principal component analysis is an effective tool to analyze these fund s characteristics. So, this task is achieved by explicitly decomposing the movements of SC fund returns and speculative investment return proxies to identify the stochastic components which are common among the SC funds but different from speculative investment risk factors.
Margarita (2004) investigates financial performance at the individual firm level. This is difficult to investigate because individual stock returns are comprised of various firm specific factors that cause statistical problems in identifying the direct impact of being socially responsible. Some evidence of overseas investors is found at the firm level. Suto and Takehara (2012) show that foreign ownership structure is positively associated with socially responsible performance, when running a two stage least square regression with an originally constructed index after controlling for corporate characteristics. Papers such as Benson and Humphrey (2008) and two papers by Renneboog, Horst and Zhan (2008a and 2008b) focus on the performance of socially responsible investment funds. They partially circumvent the firm specific effects problem and a similar approach is used in this paper as well.
This paper takes the approach of extracting the impact of CSR activities by focusing on the SC fund level (that are aggregate benchmarks of individual firm level activity); this allows the decomposition of the stochastic factors generated by SC funds and speculative overseas investors (that are assumed to consume luxury goods). These two factors may not span the risk of the entire market, but observing the relative influence of the two factors provides insights on how SC funds are managed and what type of investors are attracted to such funds. Moreover, this analysis reveals one potential role for SC funds in the financial market, i.e. providing a benchmark for sustainable long term investment. Because the sample period contains the financial crisis of September 20081,
the analysis leads us to the conclusion that SC fund managers are successful in filtering out investments that are short-term and speculative (as is approximated by individuals who consume/ invest in the apparel & luxury items section of the market).
The Luxury Consumption Hypothesis and The Equity premium
The luxury consumption hypothesis indicates that there is a positive relation between luxury consumption of excess wealth generated by equity market shocks. Ait-Sahali, Yogo, and Parker (2004) construct a model that provides reasonable estimates of risk aversion under the hypothesis that the equity premium is dominated by investors who possess low levels of risk aversion. Such investors tend to consume their excess wealth with luxury goods that provide marginal utilities at a very high level. One example was given in Hiraki, Ito, Speith, Takezawa (2009) where fine art was considered as to be a luxury good. This paper is in line with the previous argument in the sense
1 Schnietz and Epstein(2005)investigate the value of corporate social responsibility during a financial crisis.
that wealthy individuals (who simultaneously consume luxury goods) are the dominant investors in the stock market, but differ in the sense that the dominant investors are further decomposed into two types when investing in the overseas market. The first type of investor is assumed to invest/ divest in overseas markets when the investor s home country equity market receives positive/ negative equity shocks. This investor is wealthy and is known to allocate a higher fraction of wealth to the equity market, which generates wealth shocks in conjunction with the equity market fluctuations. The quick cash generated by equity market shocks is quickly consumed because of the high marginal utility appreciated by this type of investor. Consequently, this type of investor will aggressively pursue returns. (Because the wealth generated by these equity holders is conspicuous, I assume that this type of investor will only invest overseas when the investor receives positive income shocks generated in her home country market.) The second type of investor is a long term investor that maintains a buy and hold strategy.
1.2 Model
The proposed model considers two types of investors that partially represent the overall equity market. The first would be approximated by the returns of SC funds, and the second is approximated by the apparel & luxury goods index (a sub-index of the SP500 composite), where the later type of investor is more susceptible to wealth shocks generated by equity market fluctuations due to their higher exposure.
Figure 3 Orhtonormal Loading Biplots for apparel & luxury goods index and the TOPIX composite index(T23)
-6 6 4 2 0 -2 -4 -6 -4 -2 0 2 4 6 LUXYEN T23 05M09 08M04 08M08 08M09 08M10 Component 2(19.7%) Component 1(80.3%)
Type 1 (Representative Investor of the overall market)
This investor will consist of Banks, Pension funds and/or corporations that follow a passive strategy and are reluctant to change (although they may increase) their equity position. This type of investor is more interested in long term sustainable gains rather than chasing short term gains. Such investment criteria are often observed in SC funds.
Type 2 (Representative Investor who possess high equity ownership that stimulates luxury consumption)
This investor represents wealthy individuals that possess high fractions of equity in their individual portfolio, which in turn makes their exposure to equity price fluctuations higher. In addition, such individuals gain high marginal utility when consuming luxury goods (i.e. they have low risk aversion levels). This characteristic of these investors leads to an investment strategy that seeks high marginal utility in the stock market (higher than the marginal utility gain through individual consumption) and thus means that they keep a large part of their wealth in the equity market. The high risk tolerance in their investment strategy allows for speculative overseas investments to be conducted in the short term. As a consequence, it is assumed that the speculative investment behavior of such investors is highly correlated with the consumption of luxury goods, and aggressive investments that pursue short term returns, which are quickly reinvested and/or consumed.
Figure 4 Orhtonormal Loading Biplots for apparel & luxury goods index and the TOPIX composite index(T23)
10.0 7.5 5.0 2.5 0.0 -2.5 -5.0 -7.5 -10 -10 -5 0 5 10 SP109YEN F2_RET F4_RET F5_RET F6_RET F12_RET F14_RET 08M01 08M10 09M04 Component 2(25.8%) Component 1(49.9%) SP15YEN SP77YEN SP107YEN SP105YEN SP108YEN
The influence of the two types of investors is measured against the Japanese stock market that is represented by the TOPIX and its 33 industry sector classification indices. This analysis not only provides indirect evidence regarding the flow of overseas speculative investment, but also clarifies the sectors which have attracted investors with long term sustainable goals versus short term speculative goals. Because the sample period of interest covers the financial crisis of 2008, an inter-temporal analysis (using rolling style regressions) allows identification of the dynamic behavior of these investors. More specifically, the apparel & luxury goods index style may sustain, deteriorate or strengthen its influence on the market index of interest during the crisis. This phenomenon will be looked at carefully in the subsequent sections.
The Sharpe style weights2 were obtained with following model.
⑴ where ε is the residual of the regression, Y is the SC fund index returns, X1 is the returns of the
apparel & luxury goods index, X2 is the returns of the overall Japanese equity market approximated
by the TOPIX index, and α1, α2 are the weights associated with each of the independent variables.
The coefficients are restricted to be between 0 and 1, and estimated by minimizing the sum squared of errors. This regression is run with a rolling 24 month window for the period starting from 2005 Jan. to 2010 Dec. These results are reported in Figure 5. The two stylized investors are assumed to represent the behavior of overseas investors and investors seeking long term sustainable growth.
2 Empirical Evidence and Results
2.1 Data Description
All of the fund returns were obtained from the Morningstar Direct database at a monthly frequency for the period between January 2005 and December 2010. There were 15 SC funds available at the end of the period in the Tokyo Stock Exchange. The complete list of fund names and management companies is shown in Table 1. Among the 15 SC funds, only 7 funds had historical data that could be tracked back to January 2005; they were used in the principal component analysis (A list of the funds used in the principal component analysis are indicated with included in the first column of Table 1). The luxury consumption of overseas investors was approximated
2 Refer to Sharpe (1992) for a detailed discussion on the Sharpe style weights. Y=α1 X1+α2 X2+ε
1=α1+α2 α1, α2≥ 0
Figure 5 Panel A Rolling Style Analysis: Japanese SC funds(Fund 2, 4, 5, 6 12, 14) as the dependent variable, the apparel & luxury goods index(vertical axis in percentage)and TOPIX sectors(Financing 8, Real Estate 26 and Securities 29)as independent variables.
1.0 0.8 0.6 0.4 0.2 0.0 Ⅰ Ⅱ 2005Ⅲ Ⅳ Ⅰ Ⅱ Ⅲ Ⅳ Ⅰ Ⅱ Ⅲ Ⅳ Ⅰ Ⅱ Ⅲ Ⅳ Ⅰ2006 2007 2008 2009 F2_8 F6_8 F14_8 F4_8 F9_8 F5_8F12_8 1.0 0.8 0.6 0.4 0.2 0.0 Ⅰ Ⅱ 2005Ⅲ Ⅳ Ⅰ Ⅱ Ⅲ Ⅳ Ⅰ Ⅱ Ⅲ Ⅳ Ⅰ Ⅱ Ⅲ Ⅳ Ⅰ2006 2007 2008 2009 F2_29 F6_29 F14_29 F4_29 F9_29 F5_29F12_29 1.0 0.8 0.6 0.4 0.2 0.0 Ⅰ Ⅱ 2005Ⅲ Ⅳ Ⅰ Ⅱ Ⅲ Ⅳ Ⅰ Ⅱ Ⅲ Ⅳ Ⅰ Ⅱ Ⅲ Ⅳ Ⅰ2006 2007 2008 2009 F2_26 F6_26 F14_29 F4_26 F9_26 F5_26F12_26
by the apparel & luxury goods index that was later converted into Japanese yen returns.3 For a
detailed explanation of the apparel & luxury goods index, refer to Appendix A. In addition to the SC fund data, I have also used the 33 industrial subsectors of the TOPIX market index and 108 SP500 subsector indices for comparative purposes.
Basic Statistics and Motivation of Analysis
The SP500 apparel & luxury goods index return (LUXYEN) is moderately correlated with the SC fund (Japan All Equity) returns, but the SC funds are mutually correlated at a rather high level. This is verified by the correlation analysis in Panel A Table 2 (ordinary correlations). It should be noted that the TOPIX index is marginally correlated with both the SC fund indices and the apparel 3 The U.S. dollar / Japanese yen foreign exchange rate was obtained from the Bank of Japan website.
Figure 5 Panel B Rolling Style Analysis for TOPIX sectors Fishery Agriculture & Forest 9, Mining 18. 1.0 0.8 0.6 0.4 0.2 0.0 Ⅰ Ⅱ 2005Ⅲ Ⅳ Ⅰ Ⅱ Ⅲ Ⅳ Ⅰ Ⅱ Ⅲ Ⅳ Ⅰ Ⅱ Ⅲ Ⅳ Ⅰ2006 2007 2008 2009 F2_9 F6_9 F14_9 F4_9 F9_9 F5_9F12_9 1.0 0.8 0.6 0.4 0.2 0.0 Ⅰ Ⅱ 2005Ⅲ Ⅳ Ⅰ Ⅱ Ⅲ Ⅳ Ⅰ Ⅱ Ⅲ Ⅳ Ⅰ Ⅱ Ⅲ Ⅳ Ⅰ2006 2007 2008 2009 F2_18 F6_18 F14_18 F4_18 F9_18 F5_18F12_18
Figure 5 Panel C Rolling Style Analysis for TOPIX sectors Communications 4, Electric Power & Gas 7 and Other Products 21.
1.0 0.8 0.6 0.4 0.2 0.0 Ⅰ Ⅱ 2005Ⅲ Ⅳ Ⅰ Ⅱ Ⅲ Ⅳ Ⅰ Ⅱ Ⅲ Ⅳ Ⅰ Ⅱ Ⅲ Ⅳ Ⅰ2006 2007 2008 2009 F2_4 F6_4 F14_4 F4_4 F9_4 F5_4F12_4 1.0 0.8 0.6 0.4 0.2 0.0 Ⅰ Ⅱ 2005Ⅲ Ⅳ Ⅰ Ⅱ Ⅲ Ⅳ Ⅰ Ⅱ Ⅲ Ⅳ Ⅰ Ⅱ Ⅲ Ⅳ Ⅰ2006 2007 2008 2009 F2_21 F6_21 F14_21 F4_21 F9_21 F5_21F12_21 1.0 0.8 0.6 0.4 0.2 0.0 Ⅰ Ⅱ 2005Ⅲ Ⅳ Ⅰ Ⅱ Ⅲ Ⅳ Ⅰ Ⅱ Ⅲ Ⅳ Ⅰ Ⅱ Ⅲ Ⅳ Ⅰ2006 2007 2008 2009 F2_7 F6_7 F14_7 F4_7 F9_7 F5_7F12_7
Table 1 SC Fund Data PCA Included Included Included Included Included Included Included Fund Number F1 F2 F3 F4 F5 F6 F7 F8 F9 F10 F11 F12 F13 F14 F15 Fund Name
Daiwa ShigaBank SRI 3 Asset AsahiLife SRI
Chuomitsui SRI Daiwa DC SRI Daiwa SRI MitsubishiUFJ SRI Nippon SRI Open
PineBridge Japan Equity SRI DC Shinkin Fukoku SRI
Shinkin SRI Japan Equity SompoJapan SRI Open STAM DC Good Company SRI STAM SRI Japan Equity STAM SRI Japan Open STAM SRI Japan Open SMA
Management Company Daiwa Asset Management Co.,
Ltd.Asahi Life Asset Management Co., Ltd. Chuo Mitsui Asset Management Co., Ltd. Daiwa Asset Management Co., Ltd. Daiwa Asset Management Co., Ltd. Mitsubishi UFJ Asset Management Co.,Ltd. Okasan Asset Management Co., Ltd. PineBridge Investments Japan Co., Ltd. Shinkin Asset Management Co., Ltd. Shinkin Asset Management Co., Ltd.
SOMPO JAPAN NIPPONKOA ASSET MGMT CO.,LTD STB Asset Management Co., Ltd.
STB Asset Management Co., Ltd. STB Asset Management Co., Ltd. STB Asset Management Co., Ltd.
Table 2 Panel A Principal Component Analysis of SC funds and the apparel & luxury goods index(JPY). Data Period from January 2005 to December 2010.
1 2 3 6.76 0.61 0.35 6.16 0.26 0.22 0.85 0.08 0.04 6.76 7.37 7.72 0.85 0.92 0.96 Number Value Difference Proportion CumulativeValue CumulativeProportion Eigenvalues: 1.00 0.55 0.59 0.55 0.59 0.62 0.60 0.55 1.00 0.92 0.88 0.89 0.93 0.92 0.75 1.00 0.96 0.95 0.99 0.99 0.76 1.00 0.91 0.95 0.94 0.73 1.00 0.95 0.94 0.76 1.00 0.99 0.76 1.00 0.80 1.00 LUXYEN F2_RET F4_RET F5_RET F6_RET F9_RET F12_RET F14_RET Ordinary correlations: LUXYEN F2_RET F4_RET F5_RET F6_RET F9_RET F12_RET F14_RET 0.26 0.36 0.38 0.37 0.37 0.38 0.38 0.32 0.95 -0.14 -0.13 -0.17 -0.10 -0.09 -0.11 0.08 -0.17 -0.05 -0.16 -0.18 -0.09 -0.15 -0.04 0.93 Variable PC 1 PC 2 PC 3 Eigenvectors (loadings): LUXYEN F2_RET F4_RET F5_RET F6_RET F9_RET F12_RET F14_RET
Table 2 Panel B First 11 eigenvalues, explained proportion of variance of the principal component analysis on the Apparel & Luxury goods index(yen base)and the 33 sectors of TOPIX
1 2 3 4 5 6 7 8 9 10 11 21.32 2.28 1.59 1.29 1.17 0.83 0.78 0.70 0.62 0.49 0.43 19.03 0.69 0.30 0.12 0.33 0.06 0.08 0.08 0.12 0.06 0.02 0.61 0.07 0.05 0.04 0.03 0.02 0.02 0.02 0.02 0.01 0.01 Number Value Difference Proportion
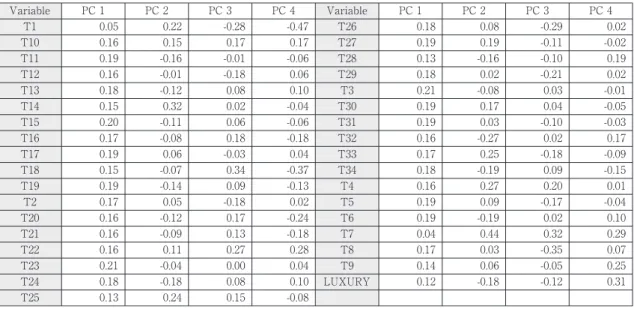
Table 2 Panel C First three principal components for returns on the apparel & luxury goods index(yen base) and the 33 sectors of TOPIX
T1 T10 T11 T12 T13 T14 T15 T16 T17 T18 T19 T2 T20 T21 T22 T23 T24 T25 0.05 0.16 0.19 0.16 0.18 0.15 0.20 0.17 0.19 0.15 0.19 0.17 0.16 0.16 0.16 0.21 0.18 0.13 0.22 0.15 -0.16 -0.01 -0.12 0.32 -0.11 -0.08 0.06 -0.07 -0.14 0.05 -0.12 -0.09 0.11 -0.04 -0.18 0.24 -0.28 0.17 -0.01 -0.18 0.08 0.02 0.06 0.18 -0.03 0.34 0.09 -0.18 0.17 0.13 0.27 0.00 0.08 0.15 Variable PC 1 PC 2 PC 3 PC 4 -0.47 0.17 -0.06 0.06 0.10 -0.04 -0.06 -0.18 0.04 -0.37 -0.13 0.02 -0.24 -0.18 0.28 0.04 0.10 -0.08 T26 T27 T28 T29 T3 T30 T31 T32 T33 T34 T4 T5 T6 T7 T8 T9 LUXURY 0.18 0.19 0.13 0.18 0.21 0.19 0.19 0.16 0.17 0.18 0.16 0.19 0.19 0.04 0.17 0.14 0.12 0.08 0.19 -0.16 0.02 -0.08 0.17 0.03 -0.27 0.25 -0.19 0.27 0.09 -0.19 0.44 0.03 0.06 -0.18 -0.29 -0.11 -0.10 -0.21 0.03 0.04 -0.10 0.02 -0.18 0.09 0.20 -0.17 0.02 0.32 -0.35 -0.05 -0.12 Variable PC 1 PC 2 PC 3 PC 4 0.02 -0.02 0.19 0.02 -0.01 -0.05 -0.03 0.17 -0.09 -0.15 0.01 -0.04 0.10 0.29 0.07 0.25 0.31
& luxury goods index. This observation motivates the principal component analysis of the SC funds and the apparel & luxury goods index, in order to decompose the overall market index (TOPIX) into two distinct stochastic factors that represent the two types of investors under consideration.
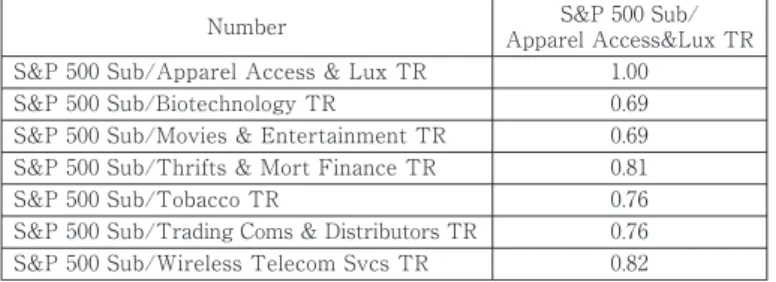
The choice of the apparel & luxury goods index to be used as a proxy for the oversea speculative investors may appear to be rather arbitrary. Thus, although the results are not reported in detail, I have conducted a robustness check on other SP500 sub-indices that possessed a high correlation with the apparel & luxury goods index. The correlations among all of the SP 500 subsectors (108 in total) were calculated, and only those indices with a correlation higher than 0.69 are shown in Table 3. A principal component analysis was run against a subset of these indices (those with a correlation higher than 0.69) with the SC fund returns. This is presented in Figure 4. The analysis
yields a result that is comparable to the apparel & luxury goods factor. The high correlation with Tobacco, Movies is reasonable and Entertainment may be considered similar to sectors where excess wealth is consumed. However, the interpretation of the other sectors was not clear. Thus, I have decided to focus the analysis on only the apparel & luxury goods sub-index in the following sections.
2.2 Empirical Evidence and Results Principal Component Analysis
Principal component analysis is conducted for all of the SC funds that existed over the sample period starting from January 2005 and ending in December 2010 (This period includes the financial crisis of September 2008). Although there exists15 SC funds, only 7 were used in the analysis due to data availability. These SC funds represent the investors that choose long term sustainability over high risk/return profile portfolios. In addition to the SC funds, the returns (in Japanese yen terms)4 of the apparel & luxury index are added to the principal component analysis
to represent the speculative investment behavior generated by investors who seek short term gains. After decomposing the stochastic components of the SC funds and apparel & luxury goods index as described in Table 2, there are at least two distinctive components whose eigenvalues, proportion of variability, and cumulative proportion of variability appear to be interesting. From Table 2 Panel A, it can be seen that the first component has an eigenvalue of 6.76, which explains 85% of the variance. This stochastic factor is highly correlated with the SC fund returns and marginally correlated with the apparel & luxury goods index returns. The second component has a rather small eigenvalue of 0.61; it explains 8% of the variance. The second factor is not a dominant factor, but is highly correlated with the apparel & luxury goods index and is almost orthogonal to the SC fund returns as can be observed in the orthonormal biplot depicted in Figure 2 (left). A complete list of eigenvalues is reported in Table 2 Panel B, and a complete list of the corresponding eigenvectors is reported in Table 2 Panel C.
4 The results are relatively robust against the change of currency.
Table 3 Correlation Analysis of S&P500 sub-indices and the apparel & luxury goods index
S&P 500 Sub/Apparel Access & Lux TR S&P 500 Sub/Biotechnology TR
S&P 500 Sub/Movies & Entertainment TR S&P 500 Sub/Thrifts & Mort Finance TR S&P 500 Sub/Tobacco TR
S&P 500 Sub/Trading Coms & Distributors TR S&P 500 Sub/Wireless Telecom Svcs TR
1.00 0.69 0.69 0.81 0.76 0.76 0.82
The first component (PC1) is the most dominant factor; it explains nearly 85% of the variability; the second factor (PC2) explains about 8% of the total variability. The interesting part of the analysis lies in the fact that the apparel & luxury goods index returns are more or less orthogonal to the SC fund returns when spanned by the first two stochastic components. This evidence supports the conjecture that SC funds are successful in filtering out the speculative investment behavior of overseas investors (when approximated by the apparel & luxury goods index). If the fund returns are decomposed into two factors, one would be related to the SC fund and the other would be related to the apparel & luxury goods index. This static analysis suggests that there are potentially two factors that influence the overall equity market. The following section investigates the inter-temporal change of these two factors by using a Sharpe style regression with a 24 month rolling window.
Sharpe Style Analysis with a Rolling window
A rolling style regression was run with a moving window of 24 months for the period starting in 2005 Jan. and ending in 2009 Jan. This includes observations within the range of 2005 Jan. to 2010 Dec. The dependent variable of the style regression is the TOPIX market index and its 33 sectors as classified by the Tokyo Stock Exchange. The full list of market indices used is provided in Table 4. The style factors are the SC funds listed on the Japanese market whose complete list is provided in Table 1 (i.e. Fund 2, 4, 5, 6, 9, 12 and 14) and the apparel & luxury goods index returns converted into Japanese yen. The results are presented in Figure 5 Panel A through Panel C where the vertical axis represents the coefficient for the apparel & luxury index. This means that the vertical axis can be interpreted as the influence of overseas speculative investors. Although the behavior of the SC funds differ moderately, the overall trend of all of the funds are more or less the same.
Several interesting observations can be made from Figure 5. The most prominent point is that Table 4 TOPIX index(no. 23 )and its 33 Sectors
1 2 3 4 5 6 7 8 9 10 11 12 13 14 15 16 17
Topix Air Transport PR JPY Topix Banks PR JPY Topix Chemicals PR JPY Topix Communication PR JPY Topix Construction PR JPY Topix Electronic Appliances PR JPY Topix Electronic Power & Gas PR JPY Topix Financing Business PR JPY Topix Fishery Agricul&Forest PR JPY Topix Foods PR JPY
Topix Glass & Ceramics PR JPY Topix Insurance PR JPY Topix Iron & Steel PR JPY Topix Land Transport PR JPY Topix Machinery PR JPY Topix Marine Transport PR JPY Topix Metal Products PR JPY
18 19 20 21 22 23 24 25 26 27 28 29 30 31 32 33 34
Topix Mining PR JPY
Topix NonFerrous Metals PR JPY Topix Oil & Coal Products PR JPY Topix Other Products PR JPY Topix Pharmaceutical PR JPY Topix PR JPY
Topix Precision Instruments PR JPY Topix Pulp & Paper PR JPY Topix Real Estate PR JPY Topix Retail Trade PR JPY Topix Rubber Products PR JPY Topix Securities PR JPY Topix Services PR JPY
Topix Textiles & Apparels PR JPY Topix Transport Equipment PR JPY Topix Warehousing PR JPY Topix Wholesale Trade PR JPY
many sectors dramatically reduce their exposure to the apparel & luxury goods index after the financial crisis of September 2008. The declining trend is observed as early as the summer of 2006 because the regression estimation is run on a 24 month (forward looking) window. Some of the sectors that reduced their exposure to overseas speculative investors, recovered their exposure eventually, but even if these sectors are included, 25 out of the 33 sectors fall in this category. Three sectors depicted in Figure 5 Panel A (such as Financing, Real Estate, and Securities) maintained a relatively high exposure with a significant decrease in exposure to the speculative benchmark after the 2008 financial crisis with no sign of recovery. The sectors were probably hit hard during the financial crisis. And the two sectors depicted in Figure 5 Panel B maintained almost no change in their exposure to speculative overseas investors (these sectors include Fishery Agriculture & Forest, and Mining), indicating a stable interest from oversea investors. The most interesting observation is that the three sectors depicted in Figure 5 Panel C increased their exposure during the sample period. The three sectors were Communications, Electric Power & Gas and Other Products.
Figure 6 shows the fraction of breakpoints identified by the Quandt-Andrews break point test with a 30% cutoff level. The breakpoints were calculated based on the weight for the apparel & luxury goods index for the rolling style regression run on the 33 TOPIX sectors (and TOPIX) against the 7 SC funds. A clear trend can be observed that a majority of the break points are concentrated at the 2008 August financial crisis. There are a number of breakpoints after the financial crisis as well. These points are either indicating the recovery of the style weight given to the apparel & luxury goods index or an increase of index s influence after the financial crisis.
Figure 6 Break Point of Style Based on Wald F-statistic
20.0% 18.0% 16.0% 14.0% 12.0% 10.0% 8.0% 6.0% 4.0% 2.0% 0.0% 2005M12 2006M03 2006M06 2006M09 2006M12 2007M03 2007M06 2007M09 2007M12 2008M03 2008M06 2008M09 2008M12 2009M03 2009M06 2009M09 2009M12 2010M03 2010M06 2010M09 2010M12
Similarly, there is a substantial number of breakpoints around 2006 June and 2007 October which are likely capturing the increase in oversea investment. The Quandt-Andrews test is a Chow-test run for various windows over the sample period. The Wald Chow-test statistic is used to Chow-test the assumption that the residual variance is identical before and after the break point.
Table 5 shows the average standard deviation of the fund of flows for all equity Japanese mutual funds for the period from 2009 Sept. to 2012 May The standard deviation of SRI fund of flows (in yen value) is much smaller than the small cap, large cap and middle cap mutual funds.
Figure 7 depicts the average R-square of the OLS regressions for the 33 sectors of TOPIX. The steady increase in the R-square values reinforces the argument that the two types of hypothetical investors have become the dominating investors in the Japanese equity market in the sample period.
Table 5 Standard Deviation of Fund Flow(2009 Sept. ‒ 2012 May)
SRI small cap large cap middle cap 0.51 1.62 2.22 1.02 standard deviation
Figure 7 Average of R-square of coefficient estimates for the 33 sectors
0.60 0.50 0.40 0.30 0.20 0.10 0.00 2005M02 2005M04 2005M06 2005M08 2005M10 2005M12 2006M02 2006M04 2006M06 2006M08 2006M10 2006M12 2007M02 2007M04 2007M06 2007M08 2007M10 2007M12 2008M02 2008M04 2008M06 2008M08 2008M10 2008M12
3 Conclusion and Implications
This paper has documented socially conscious fund (SC Fund) behavior and its potential role to reveal sustainable growth in Japanese financial markets. The level of each firm s social responsibility is measured in terms of the market assessment which is approximated by the SC fund managers stock selection policy. The portfolio approach (i.e. using the SC fund data instead of individual stock data) enabled the extraction of a stochastic component that appears to be orthogonal to the apparel & luxury goods index, it can be used to measure the overseas speculative investment influence on the various Japanese market index returns. A general trend can be observed that most of the market subsectors reduced their exposure significantly after the financial crisis, but a handful of sectors were insulated from this investment behavior. The influence of speculative overseas investors was small on the Communications and Electric Power & Gas, and Other Products sector. Such industries were not only attractive enough to be considered as a long term investment for SC funds, but also provided sufficient short term capital gains to overseas investors.
【References】
[1] Ait-Sahalia Y., Parker J. A., Yogo Motohiro (2004), Luxury Goods and the Equity Premium Journal
of Finance, Vol. LIX, pp. 2959-3004
[2] Bauer Rob, Kees Koedijk, Roger Otten (2005), International Evidence on ethical mutual fund
performance and investment style , Journal of Banking and Finance, Vol. 29, pp. 1751-1767
[3] Benson K.L and Humphrey J.E. (2008), Socially Responsible Investment Funds: Investor Reaction to
Current and Past Returns , Journal of Banking & Finance, Vol. 32, Issue 9 pp.1850-1859
[4] Cox Paul, Brammer Stephan, Millington Andrew,(2004) An Empirical Examination of Institutional
Investor Preferences for Corporate Social Performance , Journal of Business Ethics, Vol. 52, No. 1, pp. 27-43
[5] El Ghoul Sadok, Omrane Guedhami, Chuck C.Y. Kwok, Dev R. Mishra (2011), Does corporate social
responsibility affect the cost of capital? , Journal of Banking and Finance, Vol. 35, pp. 2388-2406
[6] Godfrey C. Paul, (2005), The relationship between corporate philanthropy and shareholder wealth: a
risk management perspective , Academy of Management Review, Vol. 30, No. 4, pp. 777-798
[7] Hiraki Takato, Akitoshi Ito, Darius A. Spieth and Naoya Takezawa (2009), How did Japanese
Influence International Art Prices , Journal of Financial and Quantitative Analysis, Vol. 44 pp. 1489-1514
[8] Oikkonomou, Ioannis, Chris Brooks, Stephen Pavelin (2012), The Impact of Corporate Social
Performance on Financial Risk and Utility: A longitudinal Anlaysis , Financial Management, Summer, pp. 483-515
[9] Peloza John (2006), Using Corporate Social Responsibility as Insurance for Financial Performance ,
[10] Peng George Z. and Paul W. Beamish (2008), The Effect of National Corporate Responsibility Environment on Japanese Foreign Direct Investment , Journal of Business Ethics, Vol. 80, pp. 677-695
[11] Perrini Francesco (2006), The Practitioner s Perspective on Non-Financial Reporting , California
Management Review, Vol. 48, No. 2, Winter, pp. 73-103
[12] Renneboog L., J.T. Horst and C Zhang (2008), Socially Responsible Investments: Institutional
Aspects, Performance, and Investor Behavior , Journal of Banking & Finance, Vol. 32, Issue 9, pp. 1723-1742
[13] Renneboog L., J.T. Horst and C Zhang (2008), The Price of Ethics and Stakeholders Governance:
The Performance of Socially Responsible Mutual Funds , Journal of Corporate Finance, Vol. 14, Issue 3, pp. 302-322
[14] Tsoutsoura Margarita (2004), Corporate Social Responsibility and Financial Performance , Working
Paper Series, Center for Responsible Business, UC Berkeley
[15] Schnietz Karen E., Marc J. Epstein (2005), Exploring the Financial Value of a Reputation for
Corporate Social Responsibility During a Crisis , Corporate Reputation Review, pp. 327-345
[16] Shape William(1992), Asset Allocation : Management Style and Performance Measurement,
Journal of Portfolio Management, Vol.18 No.2. pp.7∼ 19
[17] Sirasu Yoko (2011), SRI kanrenkabu no chuchouki pafomansu no tokuchou ni tuite (Japanese),
Security Analyst Journal, Vol. 49 No.5 pp. 19-28
[18] Suto Megumi, Takehara Hitoshi (2012), Stock Ownership Structure and Corporate Social
Performance: Evidence from Japan , Waseda Finance Research Center Working paper Appendix A
Description of Apparel & luxury goods Index
The index is a sub-index of the SP500 index with an industry code 252030 under the name Textiles, Apparel & Luxury Goods . This index is comprised of the following 3 sub-industries.
The Industry group is 2520 Consumer Durables & Apparel, and industry sector is 25 Consumer Discretionary.
Table 6
Apparel, Accessories & Luxury Goods
Manufacturers of apparel, accessories & luxury goods. Includes companies primarily producing designer handbags, wallets, luggage, jewelry and watches. Excludes shoes classified in the Footwear Sub-Industry.
Footwear
Manufacturers of footwear. Includes sport and leather shoes. 25203010
25203020 25203030 Textiles
Manufacturers of textile and related products not classified in the Apparel, Accessories & Luxury Goods, Footwear or Home Furnishings Sub-Industries.