Panel Data Research Center at Keio University
DISCUSSION PAPER SERIES
DP2014-009
March, 2015
Impacts of an Increased Legal Overtime Rate on Overtime Work Hours and
Provision/Acquisition of Paid Leave
—Analysis on Effects of Partial Revision of Labour Standards Act in 2008—
Ryotaro Fukahori
*Risa Hagiwara
**【Abstract】
To reduce long working hours, the revised Labour Standards Act of 2008 was executed
on December 12, 2008, and went into effect on April 1, 2010. In this revision, the
following amendments were implemented: (1) the legal overtime rate to be paid for 60 or
more hours of overtime per month was increased from 25% to 50%; (2) once a
labor-management agreement was executed, it was possible to provide paid leave for
those employees who worked overtime more than 60 hours per month, in place of the
standard 25% increase for overtime; and (3) instead of paid leave that was an
alternative to the overtime rate referenced in Section (2), after the revision of the law,
when a business executed a labor-management agreement, an employee could use any
existing paid leave by the hour up to five days per year.
In this study, to re-verify the effects of the revision, utilizing the existence of
employees who are not covered by the revision, we perform Difference-in-Differences
(DID) analysis by using the Keio Household Panel Survey. We estimate that a total of 55
working hours per week corresponds to 60 hours of overtime work per month, and then
we perform the analysis. As a result, we confirm that the revision of the law reduced the
overtime working hours of the employees who worked more than 55 hours per week on
average before the revision (2004 to 2009). However, we confirm that there is no
statistically significant impact on the provision and acquisition of annual paid leave of
employees who worked more than 55 hours per week each period.
*
Ph.D student of the Faculty of Business and Commerce, Keio University, Research
Fellow of the Japan Society for the Promotion of Science
Impacts of an Increased Legal Overtime Rate on Overtime Work
Hours and Provision/Acquisition of Paid Leave
—Analysis on Effects of Partial Revision of Labour Standards Act in
2008
1—
Ryotaro Fukahori
*1Risa Hagiwara
*2Abstract
To reduce long working hours, the revised Labour Standards Act of 2008 was executed on December 12, 2008, and went into effect on April 1, 2010. In this revision, the following amendments were implemented: (1) t he legal overtime rate to be paid for 60 or more hours of overtime per month was increased from 25% to 50%; (2) once a labor -management agreement was executed, it was possible to provide paid leave for those employees who worked overtime more than 60 hours per month, in place of the standard 25% increase for overtime; and (3) instead of paid leave that was an alternative to the overtime rate referenced in Section (2), after the revision of the law, when a business executed a labor -management agreement, an employee could use any existing paid leave by the hour up to five days per year.
In this study, to re -verify the effects of the revision, utilizing the existence of employees who are not covered by the revision, we perform Difference -in-Differences (DID) an alysis by using the Keio Household Panel Survey. We estimate that a total of 55 working hours per week corresponds to 60 hours of overtime work per month, and then we perform the analysis. As a result, we confirm that the revision of the law reduced the ov ertime working hours of the employees who worked more than 55 hours per week on average before the revision (2004 to 2009). However, we confirm that there is no statistically significant impact on the provision and acquisition of annual paid leave of emplo yees who worked more than 55 hours per week each period.
Keywords
overtime work hours, annual paid leave, Labour Standards Act of 2008
We were coached by Professor Yoshio Higuchi of the Faculty of Business and Commerce , Keio University, in the first stage of this research when necessary, and received valuable comments from Professors Takanobu Nakajima, Mitsuhiro Fukao, and Isamu Yamamoto of the Faculty of Business and Commerce, Associate Professor Michio Naoi of the Faculty of Economics, and from an anonymous referee of this document. We also received the individual data of the “ Keio Household Panel Su rvey” from the Panel Data Research Center at Keio Universit y. We sincerely appreciate their support. Note that any errors in this document are attributable to the authors.
* 1
Ph.D student of the Faculty of Business and Commerce , Keio University, Research Fellow of J apan Society for the Promotion of Science .
* 2
Ph.D student of the Faculty of Business and Commerce , Keio University, Assistant Professor of Fa culty of Business and Commerce , Keio University.
1. Introduction
In Japan, routinely working long hours is a serious problem. It has been pointed out that
working long hours not only interferes with the work -life balance,1 ) but also affects
employees’ physical and mental health, and in the worst case, can cause death from
overwork.2 )
One of measures that may make working long hours reasonable is an increase in the overtime rate, as defined in the Labour Standards Act of 2008. Conventionally, the overtime rate in Japan was a standard 25% for hours worked over the legal limit. Compared to the rate
in Europe and the United States, which was 50%,3 ) the rate in Japan was half, and many
argued that it was too low. However, on December 12, 2008, the Law for Partial Amendment to the Labour Standards Act of 2008 (Law No. 89, 2008) was executed, and became effective on April 1, 2010.
In that law, the following amendments were implem ented: (1) the legal overtime rate4 ) to
be paid for 60 or more hours of overtime per month was increased from 25% to 50%
(however, medium and small companies did not have to comply right away5 ) 6 )); (2) once a
1 )
In order to support diverse work habits, the W ork-li fe Balance Charter refers to working long hours and the utilization of annual paid holidays as follows: “In order to secure the health of workers and provide a working environment where they can work safely, it is important to promote the utilization of annual paid holidays to prevent working long hours and to make efforts to prevent mental health problems.”
2 )
Iwasaki (2008), Ma (2009), Yamaoka (2012), and Yamamot o & Kuroda (2014) pointed out that working long hours might increase the risk of cerebropathy and heart disease , and also might affect sleep, fatig ue, and physical and mental disorders . Related to this, the Ministry of Health, Labour, and Welfare released the number of determined cases of compensation, and each number of determined cases of compensation by overtime work hour (monthly average) concern ing cerebropathy, heart disease , and mental disorders in a report entitled “Compensation for Worker’s C erebropathy, Heart Disease, and Mental Diseases in 2013.” The number of determined cases of compensation means the number of cases where the ministry determined job-related or not in the relevant year, and the number of cases of allowance determination means the number of job -related cases among them. The approval rate is a percentage of the number of cases of compensation from the total number of cases. We consider compensation determination for cerebropathy, heart disease , and mental diseases where the ministry finds a relationship between long workd ays and these diseases. The number of determined cases regarding cerebropathy and heart diseases was 683 (he number of cases involving death among them: 290 ), and among them, the number of cases of 60 or more working hours was 285 (the number cased involvi ng death among them: 123 ). The approval rate was 45% (The rate of death cases: 46%). Concerning mental diseases, the number of determined cases was 1193 (cases involving suicide and suicide attempt s among them: 157 ), the number of cases of 60 or more worki ng hours was 171 (cases involving suicide and suicide attempt s among them: 37), and the approval rate was 23% (Suicide cases including suicide attempts: 29%). The approval rate indicates an upward trend. For more details, refer to “Compensation for Worker’s Cerebropathy, Heart Disease, and Mental Diseases.” However, the number of cases in this report show only the number of applications, and it is estimated that there are more potential cases.
3 ) For more details on each company, refer to t he Japan Institut e for Labour Policy and Training (2014)
and the Japan External Trade Organization (2013 ).
4 ) Ordinance for Enforcement of the Labour Standards Act ( Health and Welfare Ministry Ordinance No. 23,
1947) “Article 21: According to the definition in Clause 5, Article 37, in addition to family allowance and commuting allowance , the wages mentioned below shall not be calculated as the wage that is the base of the extra wages defined in Clause 1 and Clause 4 of Article 37: 1) f amily separation allowance ; 2) child education allowance ; 3) h ouse allowance ; 4) s pecial wages ; and 5) wages paid at regular intervals over a period exceeding one month .”
5 )
This is applied to companies of which amount of ca pital or total amount of investment is 50,000,000 yen or less in the case of a retail business , 50,000,000 yen or less in the case of a service business , 100,000,000 yen or less in the case of a wholesale trade, and 3 00,000,000 yen or less in the other cas es, or the number of
labor-management agreement was executed, it was possible to provide paid leave for those employees who worked overtime more than 60 hours per month, in place of the standard 25% increase for overtime; and (3) instead of the paid leave that was an alternative to the overtime rate referenced in Section (2), after the revision of the law, when a business executed a labor-management agreement, an employee could use any existing paid leave by
the hour up to five days per year (this applied to every company regardless of size7 )).
Employees could freely select whether they would take paid leave by the day or by the hour.8 )
According to the amendments referenced above, in case of overtime of more than 60 hours per month, employees have the following three new options: (1) take the additional overtime rate in the form of a monetary bonus; (2) alternate part of the overtime rate with one -day leave or a half-day leave and take any remaining time with the overtime rate in the form of a monetary bonus; (3) alternate the total additional overtime for one -day leave or a half-day leave. Here, the unit for alternate leave is one -day or a half-day leave. This is because Item 2, Clause 1, Article 19 -2 of the Law for Partial Amendment to the Labour Standards Act
defines that a period of rest for employees shall be provided in a comprehensive time scale.9 )
Was the increase in the overtime rate and the alternatives for paid leave as defined in the 2008 revised law really effective for reducing long workdays? As will be explained in
Chapter 3, if the Labour Demand Model1 0 ) (Hamermesh, 1993) is applicable, the increase in
the overtime rate is considered to be effective for reducing long working hours. On the other
hand, as estimated in the Employment Contract Model1 1 ) (Trejo, 1991), in cases where the
total amount of wages and labo r hours are part of a package contract, even if the overtime rate is increased, when an adjustment is performed due to a package contract by a reduction in the scheduled wages (possibly for an annual bonus or other allowances), the labor hours
(and corresponding paid leave as a result of the law revision) may not change.1 2 ) To analyze
workers regularly employed is 50 or less in the case of a retail business, 100 or less in the case of a service business, 100 or less in a wholesale trade, and 300 or less in the other cases. Applicability is determined individually for companies ( corporation or sole proprietor ).
6 )
The overtime rate for work on a scheduled day-off (35%) and late-night labor (25%) do not change. The overtime rate of medium and small companies will be discussed after three years of implementation.
7 )
Even part -time workers with short, fixed working days can take paid leave after they conclude a labor-management agreement with employers. Employers decide how many hours equals one -day of annual paid leave based on the scheduled working hours of workers.
8 ) For example, when workers want to take paid leave by the day, employers cannot change it to the paid
leave by the hour.
9 ) When a labor-management agreement approves that workers can bring fractional hours together with
paid leave such as existing holidays and annual paid leave, it is permitted to alternate leave together with the existing paid leave and provide one -day or half-da y leave. Please see the following URL for more details: http://www.mhlw.go.jp/topics/2008/12/dl/tp1216 -1l.pdf (accessed August 1, 2014 ).
1 0 )
It is also called the Fixed -Wage Model as used by Trejo (1991 ).
1 1 )
It is also called the C ompensati on Hypothesis or Fixed -Job Model, of which the latter name was used by Trejo (1991).
1 2 )
Effectiveness of the overtime rate increase varies according to whether hours as defin ed in a package contract mean the total number of actual working hours or the hours including rest periods and paid leave.
the effectiveness of the revisions from the point of views of both models, it is desirable to control even observable properties and unobservable fixed effects (such as person al
preference and company characteristics1 3 )), and also to focus precisely on any changes in
wages. For that purpose, it was necessary to use data that allowed us to understand the working hours, wages, and other personal characteristics of a person who wo rked for the same company before and after the revision.
In this study, we verify how the revised Labour Standards Act of 2008 affected overtime
work hours and the provision and acquisition of allowances for annual paid leave.1 4 ) We used
data from the Keio Household Panel Survey (KHPS), which contains follow -up surveys. The KHPS provides data for not only working hours and wages, but also the provision and acquisition of paid leave, concentration on work, and working styles such as discretionary work, de facto work, and flextime working without a set schedule. Therefore, we can analyze the impact on paid leave and the ability to concentrate on the job. Moreover, we can analyze impacts due to the overtime rate increase on each category such as working hours, wages, paid leave, and the ability to concentrate on the job, excluding categories where employees work under a system that includes discretionary work, de facto work, and flextime working without a set schedule, which may not allow overtime pay.
Our results show that the incidence of more than 60 hours overtime work per month in employees was decreased after the revision , and accordingly, the wages for those employees decreased. But overall this impact was small because more than 60 hours overtime work was rare. We cannot determine if the provision and acquisition of paid leave were affected. Please note that this result contains s ome limitations.
This paper will proceed as follows. In the next chapter, we confirm whether the revision of the law was effective for matters concerning the number of working hours and annual paid leave using government statistics. In Chapter 3, we introd uce research that verifies the effects of labor hour laws on matters regarding the number of working hours and annual paid leave, a theoretical model indicating the effects of the revisions of the Labour Standards Act of 2008 in Chapter 4, and the data and analysis method used for this research in Chapter 5. We interpret the estimated results in Chapter 6, explain additional limitations in Chapter 7, and then we present the conclusions of this research in the final chapter.
For this study, we assume the total number of actual working hours.
1 3 ) The DID analysis used in this study cannot control differences in individual characteristics generated
as a result of the revisions to the law. The analysis of this research is based on the assumption that the effects of the revision were fixed changes. For more details on the restrictions of the DID analysis, refer to Bertrand and Mullaitahan (2004) and Imbens and Wooldridge (2009).
1 4 )
We focus on the heterogeneity of individuals for analysis. Thus, because the KHPS does not allow identification of companies, it is difficult to consider a mutually dependent relationship on labor demand actions such as the hiring of repla cements. There is currently no ideal data, so we must address this theme at some point in the future.
2. Confirmation of the effects of the revisions to the Labour Standards Act of 2008, according to government statistics
Before performing DID analysis with the information from the KHPS, we confirmed whether the revision of the law was effective for reducing the number of working hours an d the acquisition and provision of annual paid leave using government statistics.
First, we confirmed the working hours. Table 1 shows the transition of the index of the total average actual working hours per month of a full -time worker who belongs to a company with five or more employees in the total industrial group, the index of scheduled working hours, and the index of non -scheduled working hours, according to Ministry of Health, Labor, and Welfare’s Monthly Labour Survey. In the table, the index of the total actual working hours, the index of scheduled working hours, and the index of non -scheduled working hours dropped in 2009 (most notably was that the index of non -scheduled working hours dropped significantly). We consider the main cause of this to be the impact of the bankruptcy of Lehman Brothers in 2008. In 2010, the index of total actual working hours, the index of scheduled working hours, and the index of non -scheduled working hours all increased. After 2010, although the index of scheduled workin g hours increased and decreased frequently, the index of non -scheduled working hours was on the rise. However, the possibility cannot be denied that working hours could have increased more, if it were not
for revisions to the Labour Standards Act.1 5 )
1 5 ) According to Ministry of Hea lth, Labour , and Welfare’s General Survey on Working Conditions, in
2013 , the percentage of companies that applied a 50% or higher overtime rate for workers who worked more than 60 hours per month of overtime was 52.8%. Also, the report shows that individual percenta ges of the companies that applied a 50% or higher overtime rate by company size were as follows: 30 to 99 employees – 35.7%; 100 to 299 employees – 58.6%; 300 to 999 employees – 78.0%; 1,000 or more employees – 91.8%. Thus, there was a significant differen ce in the overtime rates according to company size. From the existing statistics, it is difficult to confirm the actual conditions where employees worked overtime for free , disregarding the rule. However, from what we gathered, unpaid overtime work does ex ist.
Table 1: Transition of the index of the total average actual working hours per month of a full-time worker who belongs to a company with 5 or more employees in the total industrial group, the index of scheduled working hours, and the index of non-scheduled working hours
Table 2 shows the transition of the ratio of non -agricultural employees’ total working hours of the last week of a month by the number of employees (by company size), as reported in the Labour Force Survey from the Stat istics Bureau of the Ministry of Internal Affairs and Communications. On the assumption that the number of scheduled working hours is 8 hours per day and the number of working days per week is five, the working hours totaled 40 hours per week. The non-scheduled working hours to which the increased overtime rate applied according to the revised law was over 60 hours per month, and when converted to weekly hours, the total was over 15 hours per week (4 weeks in one month). As a result, employees who worked more than 55 hours per week qualify for the increased overtime rate. However, the released document did not separate the data for those who worked more than 55 hours per week or those who worked less than 55 hours per week. Therefore, we focused on the chang e in the ratio of people who were required to work more than 60 hours per week. Further, the Labour Force Survey shows working hours including hours for side businesses, work done from home, and temporary work, and does not always show whether the hours we re worked in the same place. Since the data show the work hours of the last week of a month, there is a concern that in cases of companies where their busy season is concentrated at the end of the month, the data reported may be extremely different from th e typical working hours. However, the Labour Force Survey organizes the statistics by company size precisely, and we also used the Labour Force Survey in this study to confirm changes in the ratio of people who worked for more than 60 hours per week. By lo oking at the information in Table 2, we can confirm that the data shows a downward trend. Concerning 2010, when the revised Labour Standards Act of 2008 was implemented, the application range focused on companies with 100 or more employees, thus we cannot confirm that the ratio of people who worked for more than 60 hours per week decreased significantly after 2010. To see the number employees who worked for more than 60 hours per week in each category, please refer to the
Company size
Research items Index of total actual working hours Index of scheduled working hours Index of non-scheduled working hours 2004 101.6 101.6 100.6 2005 101.0 101.0 101.2 2006 101.6 101.4 104.3 2007 101.7 101.2 106.6 2008 100.8 100.4 105.2 2009 98.2 98.9 89.9 2010 100.0 100.0 100.0 2011 100.0 99.9 101.2 2012 100.8 100.7 103.2 2013 100.2 99.8 106.1
Five or more employees Source: Monthly Labour
Survey, Ministry of Health, Labour, and Welfare.
Note 1: The research target is “full-time employees.” The scale is based on the number of employees per business.
Note 2: The basis of the indexes is from the 2010 data, defined as 100.
ratio of people who worked less tha n 35 hours per week as shown in Table 2. This data shows an increase.
Table 2: Transition of the ratio of non -agricultural employees’ total working hours in the last week of a month by company size in the total industrial group
Source: Statistics Bureau, Ministry of Internal Affairs and Communications “Labour Force Survey” (data from 2011 does not contain information for Iwat e, Miyagi, or Fukushima).
Note: Research target is limited to “non -agricultural employees.” The scale is based on the number of employees per company.
To determine whether the revised law affected the acquisition and provision of annual paid leave, we indicated a transition of the number of provided and acquired days of annual paid leave according to the size of the company in tota l industrial group as reported in the Ministry of Health, Labour, and Welfare’s General Survey on Working Conditions as shown in Figure 1. Because the data concerning annual paid leave in the General Survey on Working Conditions shows the average number of days per worker, a comparison of the time-series is difficult. Therefore, we compared the trends of the companies with 1000 or more employees, which are considered to be the most significantly affected companies, and companies with 30 to 99 employees, whi ch are considered to be the least affected. Although in Figure 1, the number of provided days and the number of acquired days increased in cases of companies with more than 1000 employees in 2009, both numbers transitioned similarly from 2004 to 2008. From 2010, the number from companies with more than 1000 employees
was slightly increased, but there was no significant shift.1 6
1 6 )
The number of days for paid leave shows the average number of days per worker. Because it is difficult to estimate how the statistics were interpreted, it is necessary to note this as a limitation of the study .
Total working hours of the last week of a month Company size 1 to 29 employees 30 to 99 employees 100 to 499 employees 500 to 999 employees 1000 or more employees 1 to 29 employees 30 to 99 employees 100 to 499 employees 500 to 999 employees 1000 or more employees 2004 12.5% 12.6% 13.0% 13.3% 12.8% 27.4% 22.9% 21.2% 20.8% 22.0% 2005 11.9% 11.9% 12.0% 12.8% 12.2% 28.1% 23.3% 21.8% 21.5% 22.1% 2006 11.0% 11.1% 11.2% 11.6% 11.2% 27.3% 22.2% 19.7% 19.3% 20.6% 2007 10.5% 10.6% 10.5% 10.2% 10.4% 29.4% 24.2% 22.2% 21.7% 23.2% 2008 10.6% 10.3% 9.9% 10.5% 9.5% 30.2% 25.1% 23.4% 23.9% 25.0% 2009 10.0% 9.5% 9.1% 9.2% 8.5% 31.1% 26.7% 24.6% 24.6% 25.7% 2010 10.2% 9.8% 9.4% 9.4% 8.5% 31.6% 26.3% 23.4% 23.8% 25.1% 2011 10.0% 9.7% 9.0% 9.8% 8.4% 31.9% 26.7% 24.3% 23.7% 25.7% 2012 9.6% 9.4% 8.8% 9.9% 8.6% 31.9% 26.6% 23.6% 23.7% 25.2% 2013 9.3% 9.3% 8.7% 8.9% 8.0% 33.6% 28.0% 25.8% 25.9% 28.1%
Figure 1: Transition of the number of days of provided and acquired annual paid leave by company size in total industrial group
Source: “General Survey on Working Conditions,” Ministry of Health, Labor, and Welfare. Note 1: The research target is “full-time workers.” The company size is based on the number of employees per business.
Note 2: “The number of provided days” does not include the number of days that were carried -over. “The number of acquired days” is the number of days actually acquired for paid leave in one year.
Note 3: The research target prior to and including 2007 was “private companies with more than 30 regu lar employees at HQ,” but from 2008, it was expanded to include “private companies with more than 30 regular employees.”
As previously mentioned, when comparing the working hours and annual paid leave with the government statistics, we could not confirm that th e working hours and the number of acquired and provided days for annual paid leave changed drastically from 2010. However, the working hours and the progression of the acquisition and provision of annual paid leave that we have reviewed thus far did not al low us to identify the effects of the revisions to the law, but it did include other effects. Therefore, in this study, to control these “other effects” and then to verify the effects of the revision of the law, we used the KHPS and verified the information using DID analysis.
3. Research precedents on the effects of working -hour laws
Effects of the revised Labour Standards Act of 2008 vary according to what mechanism is working in the background. In this section, we introduce the Labour Demand Model (Hamermesh, 1993) and the Employment Contract Model (Trejo, 1991), to consider what
Number of acquired days (1,000 or more employees)
19.2 19.1 19.1 18.8 18.8 19.8 19.0 18.9 19.3 19.5 16.6 16.8 16.8 16.5 16.4 16.3 16.9 16.8 17.1 16.9 10.4 9.9 10.2 9.7 10.0 10.6 10.2 10.5 10.9 10.6 7.2 7.2 7.2 7.1 7.0 6.5 6.9 7.0 7.2 6.8 0.0 5.0 10.0 15.0 20.0 25.0 2004 2005 2006 2007 2008 2009 2010 2011 2012 2013 Number of days
Number of provided days (1,000 or more employees) Number of provided days (30 to 99 employees) Number of acquired days (1,000 or more employees) Number of acquired days (30 to 99 employees)
Number of provided days
Number of acquired days
mechanism works in each case where the revision of the law proves to be either effective or ineffective. Then, we confirm the verified research results on the effects of the workin g-hour laws.
First, if the Labour Demand Model is at play, companies supposedly reduce the working hours to respond to the increase of expenses when the overtime rate is increased. In other words, in the Labour Demand Model, the scheduled wages are constan t, and only when there
are costs for the adjustment1 7 ) of the number of employees, do the companies respond to the
increased overtime rate by changing the working hours. This explanation is primarily derived from the reports of Trejo (1991). For more detai ls, refer to the research of Trejo (2003) and Bell and Hart (2003).
Hamermesh and Trejo (2000) analyzed the effects of an increase in the overtime rate in California, USA, with the Current Population Survey from 1973, 1985, and 1991. In California, people could ask for payment of overtime when they worked more than 40 hours per week, as defined by the Fair Labor Standards Act. After the revision, they could also ask for payment of overtime when they worked for more than 8 hours per day. This provision applied to women only at first, and beginning in 1980, it also applied to men. In the study, they compared the working hours of male employees and female employees in California and employees in other states to see if the working hours of male employees decreas ed. As a result of the analysis, they confirmed that the number of male employees who worked more than 8 hours in a day was lower in California than in other states, and accordingly considered that the Labour Demand Model was applied.
On the other hand, if the Employment Contract Model is established in Japan, even when the overtime rate is increased, other employment costs are reduced and working hours do not change, and accordingly, the effects of the revised Labour Standards Act of 2008 disappear. In the Employment Contract Model, employment contracts include both wages and working hours in a package contract. Under the hypotheses, even if the overtime rate is increased, that amount is set off by a reduction in fixed wages (or in bonuses or other allowanc es), and the wage is adjusted in the package contract. Therefore, working hours and the acquisition and provision of annual paid leave supposedly do not change. Trejo (1991) analyzed the effects of the overtime rate with the results of the Current Populati on Survey from May 1974, 1976, and 1978, in order to verify the Employment Contract Model. The results demonstrated that scheduled wages were reduced to set off the increased overtime rate, but the effects were not significant enough to completely set off the increase. However, there are some issues with this analysis, as there was no differentiation in the application of the overtime
1 7 )
Trejo (2003) explained the costs for the adjustment of quasi -la bor fixed costs as required for human resources and training, fringe benefit s, insurance premiums , and so on.
rate, and the industries and job types were largely different, so it was not clear whether the effects were brought on by th e increase in the overtime rate or were due to the different industries and job types. With that, Trejo (2003) used the panel data of 11 industries from 1970 to 1989, and again verified the effects of the increase in the overtime rate derived from the revised Fair Labor Standards Act and a Supreme Court ruling. As a result, it was confirmed that overtime hours did not change in response to the increase in the overtime rate during the sampling period.
The other research precedent on the Employment Contract M odel and the Labour Demand Model had different conclusions about which model was consistent. Bhattacharya, DeLeire, and MaCurdy (2000) verified the effects of restoring provisions of the above -referenced law from allowing employees who worked for more than 8 hours per day to ask for payment of overtime to the former working -hour restriction where employees could ask for payment of overtime for working more than 40 hours per week. Mitchell (2005) verified the effects of the white-collar exemption conducted i n 1999 in California. Results from both studies were consistent with the conclusions of the Labour Demand Model. On the other hand, Bell and Hart (2003), and Kalwij and Gregory (2005) who used data from England, concluded that the Employment Contract Model was more consistent.
Although there were other verifications of the impacts of reduced legal hours, these verifications of clearly the same results were not generally accepted. Friesen (2002) confirmed that the impact on working hours was limited and also that wages for legal hours increased. Skuterud (2007) verified the effects of the policy in the province of Quebec in Canada to reduce weekly working hours from 44 hours to 40 hours and demonstrated that the number of full-time employees who worked more t han 40 hours per week decreased by 20%. It was further confirmed that the decrease in the number of working hours did not lead to more job opportunities. Kawaguchi, Naito, and Yokoyama (2008) analyzed the effects of reduced legal hours from 48 hours to 40 hours in Japan from 1987 to 1997, from the perspectives of the number of working hours, wage rate, and employment opportunities. As a result of the analysis using the Basic Survey on Wage Structure, they demonstrated that even when legal hours were reduced by almost one hour, reduction in the actual time worked was just 0.14 hour. On the other hand, it was confirmed that the monthly earnings increased, even though the working hours were slightly reduced.
Research on the overtime rate in Japan has demonstrat ed that the increase in the overtime rate generally contributed to the reduction of working hours. Hayami (1995) used the KEO Model II developed by the Keio Economic Observatory at Keio University for simulation of the impacts of the increase in the overtime rate, and reported the results. According to the report, when the overtime rate was increased from 25% to 35%, the total actual working
hours decreased by 2 to 2.3%, and the number of employees went up by 1.2 to 1.3%. Moreover, Kuroda and Yamamoto (2012) studied the impacts of the system that provided no overtime, such as the system for white -collar exemptions and nominal managers (to which no working-hour restriction was applied). According to their analysis, compared to the employees who were covered by working -hour restrictions, the employees who were not covered by such restrictions tended to work longer especially in difficult economic times, and they stated that the Labour Demand Model was more consistent.
Was the revision of the overtime rate in 2008 really effective for reducing long workdays? In order to confirm whether it changed as indicated by the Labour Demand Model, or whether it did not change the working hours and paid leave as indicated by the Employment Contract Model, we must use the data that provides for a distinction of the effects derived from the increase in the overtime rate and the effects of demand derived from the different industries and job types, similar to the research that Trejo (2003) performed. W e should also control the properties of individual preferences and types of companies. For that purpose, analysis with the panel data is necessary. Before our research, Asai (2014) utilized the panel data from the Japanese Life Course Panel Survey (JLPS), from the Institute of Social Science at the University of Tokyo and performed a DID analysis concerning the effects of the revised Labour Standards Act of 2008. In that analysis, she compared the data from January 2010, immediately before the revision, and the data from every January after the revision. She also analyzed requests of employees regarding whether they wanted to increase or decrease their working hours, considering their preferences. As a result, she clarified that the increase in the overtime rate had no impact on working hours and overtime of more than 60 hours per month, which was valuable information. However, we should discuss an additional issue regarding her research. To be more precise, the research did not clarify the effects of alternating overtime premiums with paid leave, brought by the revisions in 2008, as well as the shift from the normal business hours system to the discretionary working hours system, de facto work, or flextime working without a set schedule. In addition, the oldest employee in the JLPS respondents at this time was in his/her mid -40s at most, and if older employees are included in the analysis, the results may be different from the results of
Asai’s research (2014).1 8 ) In this study, we consider these iss ues and re-verify how the
companies responded to the effects of the revised Labour Standards Act of 2008.
1 8 ) Based on the data of the number of workers (n on-agricultural industries ) in the Labour Force Survey b y
the Statistics Bureau of the Ministry of Internal Affairs and Communications , we calculated the ratios of workers who worked for more than 60 hours per week out of all workers in 2009 and 2012 (the data of 2011 did not include continuous data due to the Great East Japan Earthquake) and compared them. Employees aged 45 to 49, aged 50 to 54 , and aged 55 to 5 9 changed by -0.49 to -0.15%, and employees aged 20 to 24, aged 25 to 29, aged 30 to 34 , aged 35 to 39, and aged 40 to 44 changed by -0.18 to 0.04%. Therefore, there is a possibility that the working hours of employees that are older than mid -40s are reduced. To confirm what factor may be affected most by the revision, we should increase variation in ages and job tenure years
4. Theoretical model
In this study, we verify the effects of the revised Labour Standards Act of 2008 using
examples from the theoretical model introduc ed by Trejo (2003).1 9 ) First, a profit is
indicated as 𝛱. Turnover and expenses that make up the profit are indicated as follows:
turnover 𝑓(𝑁, 𝐻) is indicated as a production function consisting of the number of
employees (𝑁) and working hours per person (𝐻), for simplification. Expenses include one
factor 𝑣𝑁 that is required for the employment adjustment and another part that varies
according to number of hours worked. The latter part is divided further into three parts, including one part where the overtime rate is 0% and the working hours are within the legal
hours (this is represented by 𝐻 ≤ 𝐻̅𝑝25, requiring the expense ratio 𝑤𝑁𝐻 where 𝑤 is the
rate of scheduled wages), a part of where the overtime rate is 25% and the working hours are
over the legal hours (this is represented by 𝐻̅𝑝25< 𝐻 ≤ 𝐻̅𝑝50, that requires (1 + 𝜃𝑝25)𝑤𝑁(𝐻 −
𝐻̅𝑝25) 1 + 𝜃𝑝25= 1.25 times the overtime rate. Note 𝜃𝑝25= 0.25.), and a part where the
overtime rate is 50% and the working hours are over the legal hours (this is repr esented by
H̅p50< 𝐻, indicating where overtime hours are more than 60 hours per month. The expense
is (1 + 𝜃𝑝25+ 𝜃𝑝50)𝑤𝑁(𝐻 − 𝐻̅𝑝50), in other words, the expense of 1 + 𝜃𝑝25+ 𝜃𝑝50= 1.5 times
overtime rate. Note 𝜃𝑝50= 0.25.). Therefore, the profit is indicated as follows according to
the pattern of working hours:
In case of 𝐻 ≤ 𝐻̅𝑝25: 𝛱1(𝑤, 𝑣) = 𝑚𝑎𝑥 𝑓(𝑁, 𝐻) − (𝑤𝑁𝐻 + 𝑣𝑁) In case of 𝐻̅𝑝25< 𝐻 ≤ 𝐻̅𝑝50: 𝛱2(𝑤, 𝑣, 𝜃𝑝25, 𝐻̅𝑝25) = 𝑚𝑎𝑥 𝑓(𝑁, 𝐻) − [𝑤𝑁𝐻̅𝑝25+ (1 + 𝜃𝑝25)𝑤𝑁(𝐻 − 𝐻̅𝑝25) + 𝑣𝑁] In case of 𝐻̅𝑝50< 𝐻: 𝛱3(𝑤, 𝑣, 𝜃𝑝25, 𝜃𝑝50, 𝐻̅𝑝25, 𝐻̅𝑝50) = 𝑚𝑎𝑥 𝑓(𝑁, 𝐻) − [𝑤𝑁𝐻̅𝑝25+ (1 + 𝜃𝑝25)𝑤𝑁(𝐻̅𝑝50− 𝐻̅𝑝25) + (1 + 𝜃𝑝25+ 𝜃𝑝50)𝑤𝑁(𝐻 − 𝐻̅𝑝50) + 𝑣𝑁]
The Labour Standards Act that was revised in 2008 defined a new pattern of working
hours, of which the overtime rate was 50% (as represented by 𝐻̅𝑝50< 𝐻). As a result,
1 9 )
Asai (2014 ) also presented a theoretical model that was similar to this study concerning the impact on working hours.
companies that permitted their employees to work overtime of more than 60 hours per month
were under the obligation to pay additional expenses calculated by (1 + 𝜃𝑝25+ 𝜃𝑝50)𝑤𝑁(𝐻 −
𝐻̅𝑝50). The part of the equation represented by 𝜃𝑝50, 𝜃𝑝50depends on the scheduled wage rate
(𝑤), the number of employees (𝑁), and the number of working hours per person (𝐻). We
assume that companies change 𝐻 when 𝑤 and 𝑁 are fixed (the Labour Demand Model), or
change 𝑤 when 𝑁 and 𝐻 are fixed (the Employment Contract Model), in order to pursue
profit.2 0 )
The revised Labour Standards Act of 2008 allowed compan ies to provide paid leave to their employees who worked overtime of more than 60 hours per month if they executed a labor-management agreement. The part of the equation that can be alternated with paid leave
is expressed as 𝜃𝑝50𝑤𝑁(𝐻 − 𝐻̅𝑝50), and the profit function is indicated as follows:
In case of 𝐻̅𝑝50< 𝐻, alternated with paid leave:
𝛱4(𝑤, 𝑣, 𝜃𝑝25, 𝜃𝑝50, 𝐻̅𝑝25, 𝐻̅𝑝50)
= 𝑚𝑎𝑥 𝑓(𝑁, 𝐻) − [𝑤𝑁𝐻̅𝑝25+ (1 + 𝜃𝑝25)𝑤𝑁(𝐻̅𝑝50− 𝐻̅𝑝25) + (1 + 𝜃𝑝25)𝑤𝑁(𝐻 − 𝐻̅𝑝50)
+ 𝜃𝑝50𝑤𝑁(𝐻 − 𝐻̅𝑝50) + 𝑣𝑁]
When the profit function is as shown above, the sum totals of the profit function and
expenses in the case of 𝐻̅𝑝50< 𝐻 are the same. Therefore, the total expense the company
bears does not change if the paid leave is acquired by the day or by the hour or if overtime premiums are paid. In any case, when employees work overtime more than 60 hours per month, companies shall bear additional expenses.
In this section, we consider a case where a cost represented by ∅(∅ ≥ 1) is required for
alternating overtime payments with paid leave. When a worker takes paid leave, it is necessary to assign a person to take the place of that worker in some cases. We assume the cost for this exchange. The symbols below indicate the case wher e one of the variables that
can be alternated with paid leave is changed to ∅𝜃𝑝50𝑤𝑁(𝐻 − 𝐻̅𝑝50):
𝛱4(𝑤, 𝑣, 𝜃𝑝25, 𝜃𝑝50, 𝐻̅𝑝25, 𝐻̅𝑝50)
= 𝑚𝑎𝑥 𝑓(𝑁, 𝐻) − [𝑤𝑁𝐻̅𝑝25+ (1 + 𝜃𝑝25)𝑤𝑁(𝐻̅𝑝50− 𝐻̅𝑝25) + (1 + 𝜃𝑝25)𝑤𝑁(𝐻 − 𝐻̅𝑝50)
+ ∅𝜃𝑝50𝑤𝑁(𝐻 − 𝐻̅𝑝50) + 𝑣𝑁]
In the case where ∅ = 1, the impact on the profit of a company does not change even when
overtime premiums are paid or alternated with paid leave. However, in the case where ∅ > 1,
2 0 )
In this study, it is difficult to strictly identify both hypotheses with specific parameters. The precedent research tends to have this pr oblem. Also, the Labour Demand Model ignores actions of the labor suppler. This point should be considered in future research .
since the cost is necessary when the overtime premiums are alternated with paid leaves, there
is no incentive for the company. We consider that ∅ varies according to whether employees
acquire their paid leave by the day or by the hour. We assume that the first case incurs a
higher cost because a substitute employee is necessary. Although ∅ cannot be observed
directly in this study, we perform positive analysis on how the provision and acquisition of paid leave changes due to the increase in the overtime rate to confirm the impacts of the increase of the overtime rate on the provision and acquisition of paid leave. Due to special circumstances in Japan, people actually hesitate to take paid leave even though the system of paid leave is available. If paid leave is not fully utilized, the provisions for paid leave may be even more cost effective that the p ayment of overtime. This is also why we analyze the two aspects of paid leave—provision and acquisition.
5. Data and analysis methods
The individual data used in this research was derived from the KHPS of the Panel Data Research Center at Keio University. Th e KHPS is given every year to respondents to follow-up on the initial survey and has been conducted every January since 2004, and includes several questions concerning occupation, earnings, and family structure. The research target includes 4000 respondent s from 20 years old to 69 years old at the time of the initial survey (the end of January) including men and women (the number of respondents in the data provided to us was 4005 including extra respondents). In addition, the center similarly sampled and ad ded 1400 respondents in 2007 (1419 including the extra respondents), and 1000 responders in 2012 (1012 including the extra respondents). We were able to utilize data collected for 10 years from 2004 to 2013. This data allowed us to understand the variation in working hours of individuals of the overall working generations around 2010, when the revised Labour Standards Act of 2008 went into effect. In this study, we analyzed initial respondents and additional respondents in 2007.
Our research target was regular employees under 60 years of age. We only analyzed employees who worked for the same companies before and after the implementation of the revised law (Survey in 2010 and Survey in 2 011). With these KHPS respondents, we made histograms showing distributions of working hours before and after the revision as shown in Figure 2. They showed not only distributions before and after the revision, but also whether or not each employee’s working hours were averaging over 55 hours per week before the
revision.2 1 ) The reason why we focused on 55 hours per week, is that the overtime rate went up to 50% when overtime hours were more than 60 hours per month, and cases where employees worked 55 hours per week corresponded to cases of overtime of 60 hours per month, on the assumption that the scheduled working hours were eight hours per day and the number of workdays per week was five. We continuously focused on the number 55 hours per week in the later estimates. However, the KHPS Survey in January 2010 was conducted immediately before the revision, and it was difficult to determine whether the revised law affected the working hours system to be discussed later in this study, except for overtime and paid leave systems. Therefore, we excluded the data from this period.
In the overall respondents, the data is concentrated near 40 hours per week prior to the revision, and most subparts (81.55%) are found within the area of 55 hours per week o r less. Therefore, it can be stated that a limited number of employees were affected by the revised law. The overall figure after the revision also showed no significant change. Therefore, we selected a respondent of employees whose average working h ours were over 55 hours per week before the revision (2004 to 2009) and compared their data both before and after the revision. Although there were concentrations around 60 hours per week before the revision, it was mitigated after the revision, and workin g hours tended to be reduced. On the other hand, when the average before the revision was less than 55 hours, no significant change appeared, similar to the overall data. In the following sections, we make estimations regarding additional factors and analyze the impact on working hours, wages, and the provision and acquisition of paid leave.
2 1 )
Also in the following sections, we focus on whether the average working hours before the revision were 55 hours or more. This is an average value, calculated by dividing the total observed working hours of each period before the revision by the number of times of observations. In our calculations, we only used the period in which the workers belonged to the same companies both before and after the revision.
Figure 2: Distributions of working hours before and after the revision of the law (concentrating on employees who worked less than 55 hours per week and who worked over 55 hours per week, before and after the revision)
Source: Created by the authors based on data from the KHPS.
Note: We used the data of employees younger than 60 years of age who worked for the same companies before and after the revisions. We excluded employees under the irregular working hours systems, discretionary or de facto work, flextime working without a set schedul e, and employees and owners from companies with 4 or less employees.
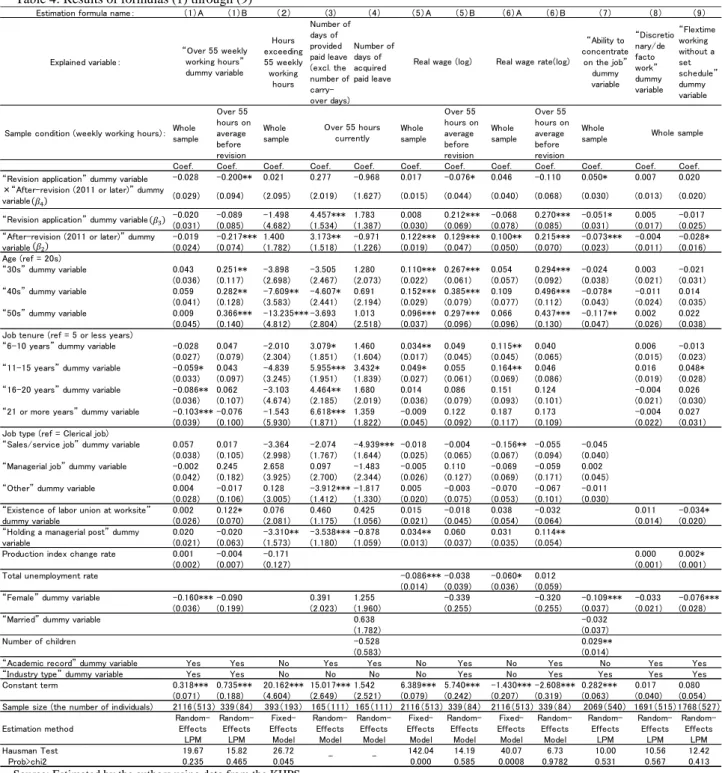
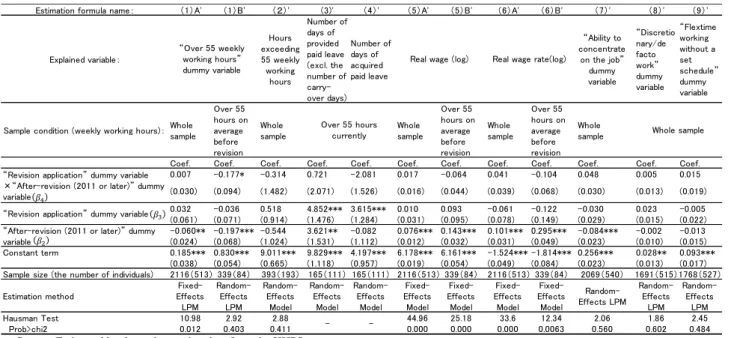
In this study, we perform Difference in Difference (DID) analysis, by comparison between a treatment group of employees whose legal overtime rate was increased, and a control group of employees whose rate was not increased. In particular, concerning working hours, real wage rates, the number of days of provided and acquired annual paid leave, and working hours systems, we prepared the following nine formulas:
𝐻1𝑖𝑡= 𝛽1𝐻1+ 𝛽2𝐻1𝑌𝑖𝑡𝐻1+ 𝛽3𝐻1𝐴𝑖𝑡𝐻1+ 𝛽4𝐻1(𝑌𝑖𝑡𝐻1× 𝐴𝑖𝑡𝐻1) + 𝑋𝑖𝑡 𝐻1′ 𝛽5𝐻1+ 𝛼𝑖𝐻1+ 𝜀𝑖𝑡𝐻1 (1) 0 10 20 30 0 10 20 30 0 10 20 30 0 50 100 0 50 100 Total (2004 to 2009) 55 or less hours (2004 to 2009) Over 55 hours (2004 to 2009) Total (2011 to 2013) 55 or less hours (2011 to 2013) Over 55 hours (2011 to 2013) Percent kdensity Percent
𝐻2𝑖𝑡= 𝛽1𝐻2+ 𝛽2𝐻2𝑌𝑖𝑡H2+ 𝛽3𝐻2𝐴𝑖𝑡H2+𝛽4𝐻2(𝑌𝑖𝑡H2× 𝐴𝑖𝑡𝐻2) + 𝑋𝑖𝑡𝐻2′𝛽5𝐻2+ 𝛼𝑖𝐻2+ 𝜀𝑖𝑡𝐻2 (2) 𝑉1𝑖𝑡= 𝛽1𝑉1+ 𝛽2𝑉1𝑌𝑖𝑡𝑉1+ 𝛽3𝑉1A𝑉1𝑖𝑡+𝛽4𝑉1(𝑌𝑖𝑡𝑉1× 𝐴𝑖𝑡𝑉1) + 𝑋𝑖𝑡𝑉1′𝛽5𝑉1+ 𝛼𝑖𝑉1+ 𝜀𝑖𝑡𝑉1 (3) 𝑉2𝑖𝑡= 𝛽1𝑉2+ 𝛽2𝑉2𝑌𝑖𝑡𝑉2+ 𝛽3𝑉2A𝑉2𝑖𝑡+𝛽4𝑉2(𝑌𝑖𝑡𝑉2× 𝐴𝑖𝑡𝑉2) + 𝑋𝑖𝑡𝑉2′𝛽5𝑉2+ 𝛼𝑖𝑉2+ 𝜀𝑖𝑡𝑉2 (4) 𝑊1𝑖𝑡= 𝛽1𝑊1+ 𝛽2𝑊1𝑌𝑖𝑡W1+ 𝛽3𝑊1𝐴𝑖𝑡𝑊1+𝛽4𝑊1(𝑌𝑖𝑡W1× 𝐴𝑖𝑡𝑊1) + 𝑋𝑖𝑡𝑊1′𝛽5𝑊1+ 𝛼𝑖𝑊1+ 𝜀𝑖𝑡𝑊1 (5) 𝑊2𝑖𝑡= 𝛽1𝑊2+ 𝛽2𝑊2𝑌𝑖𝑡W2+ 𝛽3𝑊2𝐴𝑖𝑡𝑊2+𝛽4𝑊2(𝑌𝑖𝑡W2× 𝐴𝑖𝑡𝑊2) + 𝑋𝑖𝑡𝑊2′𝛽5𝑊2+ 𝛼𝑖𝑊2+ 𝜀𝑖𝑡𝑊2 (6) 𝐶𝑖𝑡= 𝛽1𝐶+ 𝛽2𝐶𝑌𝑖𝑡𝐶+ 𝛽3𝐶𝐴𝑖𝑡𝐶+𝛽4𝐶(𝑌𝑖𝑡𝐶× 𝐴𝐶𝑖𝑡) + 𝑋𝑖𝑡𝐶 ′𝛽5𝐶+ 𝛼𝑖𝐶+ 𝜀𝑖𝑡𝐶 (7) 𝑁1𝑖𝑡= 𝛽1𝑁1+ 𝛽2𝑁1𝑌𝑖𝑡𝑁1+ 𝛽3𝑁1𝐴𝑖𝑡𝑁1+𝛽4𝑁1(𝑌𝑖𝑡𝑁1× 𝐴𝑖𝑡𝑁1) + 𝑋𝑖𝑡𝑁1′𝛽5𝑁1+ 𝛼𝑖𝑁1+ 𝜀𝑖𝑡𝑁1 (8) 𝑁2𝑖𝑡= 𝛽1𝑁2+ 𝛽2𝑁2𝑌𝑖𝑡𝑁2+ 𝛽3𝑁2A𝑖𝑡𝑁2+𝛽4𝑁2(𝑌𝑖𝑡𝑁2× 𝐴𝑖𝑡𝑁2) + 𝑋𝑖𝑡𝑁2′𝛽5𝑁2+ 𝛼𝑖𝑁2+ 𝜀𝑖𝑡𝑁2 (9)
Here, the subscript 𝑖 indicates a person, and 𝑡 indicates a year. 𝐻1𝑖𝑡 is a dummy
variable indicating whether or not weekly working hours go over 55 hours. 𝐻2𝑖𝑡 is a
continuous variable regarding the surplus of hours over 55 in a week. This variable is 1 when the weekly working hours are 56 hours, and cases where the weekly working hours are less
than 56 are not included in the variable. 𝑉1𝑖𝑡 indicates the number of days of provided
annual paid leave, and 𝑉2𝑖𝑡 indicates the number of days of acquired annual paid leave. 𝑊1𝑖𝑡
indicates annual earnings from primary work (log in real term), and 𝑊2𝑖𝑡 indicates the wage
rate per hour (log in real term).2 2 ) 𝐶𝑖𝑡 is a dummy variable for the ability to concentrate on
the job.2 3 ) 𝑁1𝑖𝑡 is a dummy variable, which indicates 1 when the working hour system
includes discretionary or de facto work, and indicates 0 when the working hour system is a
general or flexible schedule system. 𝑁2𝑖𝑡 too is a dummy variable, which indicates 1 when
the working hour system includes flextime working without a set schedule (managers and others who do not receive overtime premiums), and indicates 0 when the working hour
system is a general or flexible schedule system. 𝑌𝑖𝑡 is a dummy variable, which indicates 1
when the period is 2011 to 2014, and indicates 0 when the period is 2005 to 2009. However,
2 2 )
It was adjusted using the “C onsumer Price Index ” (sum total excluding imputed rents of owned houses ) by the Statistics Bureau, Ministry of Internal Affairs and Communications.
2 3 )
Dummy variable for the ability to concentrate on the job : Qu estion “Have you ever lost your concentration on the job?” Answer: “Frequently/Sometimes/Almost never/Never.” The variable is 1 when a responder selects “Never.”
concerning formulas (3), (4), (8), and (9), we only analyze data after 2008. Thi s is because the surveys contain no questions regarding the number of days of provided and acquired annual paid leave and the working hours systems, which are explained variables, until 2007.
Therefore, in these cases, 𝑌𝑖𝑡 indicates 0 only for the year 2008 and the year 2009. The
reason why the year 2004 is excluded is that the control variables were not available, as will be discussed later. The reason why the year 2010 is excluded, is that the year 2010 was immediately before the implementation of the revised law, and it was difficult to estimate
the clear impact on the working hours system in this year. 𝐴𝑖𝑡 is a dummy variable for the
revision that was applied. In this study, we divided the treatment group and the control group by type of industry and number of employees and prepared a variable that used 1 for the treatment group for which the revision was considered to be applied. To be more specific,
the employees of wholesale trades, retail businesses, and service businesses2 4 ) with 100 or
more employees, the employees of other types of industries with 500 or more employees,2 5 )
and people involved in public affairs2 6 ) are represented by a 1, and the employees of
wholesale trades and retail businesses with 5 to 29 employees, the employees of ser vice
businesses and other types of industries with 5 to 99 employees are represented by a 0.2 7 ) In
this study, we confirm whether or not the coefficient 𝛽4 of the cross-term was significant
after the implementation of the revised law, and verify whether o r not the revision had an
impact. The coefficient 𝛽4 is defined as a difference between the treatment group and the
control group before and after the revision, as shown below:
𝛽4𝑍= (𝑍𝑡𝑟𝑒𝑎𝑡𝑚𝑒𝑛𝑡 𝑔𝑟𝑜𝑢𝑝𝑎𝑓𝑡𝑒𝑟 − 𝑍𝑡𝑟𝑒𝑎𝑡𝑚𝑒𝑛𝑡 𝑔𝑟𝑜𝑢𝑝𝑏𝑒𝑓𝑜𝑟𝑒 ) − (𝑍𝑐𝑜𝑛𝑡𝑟𝑜𝑙 𝑔𝑟𝑜𝑢𝑝 𝑎𝑓𝑡𝑒𝑟
− 𝑍𝑐𝑜𝑛𝑡𝑟𝑜𝑙 𝑔𝑟𝑜𝑢𝑝𝑏𝑒𝑓𝑜𝑟𝑒 ) (10) 𝑍 ∈ (𝐻1, 𝐻2, 𝑉1, 𝑉2, 𝑊1, 𝑊2, 𝐶, 𝑁1, 𝑁2)
We introduce a rate of change of the production index2 8 ) of the relevant industry for the
2 4 )
Definition of service businesses according to the KHPS: “infor mation services and research services,” “telecommunication services excluding information services,” “medical and welfare services,” “education and learning support services,” and “other services.”
2 5 )
Concerning the number of employees, the KHPS asks a question regarding the number of employe es in the overall company for which a respondent works on a routine basis . In the KHPS survey, the definition of “overall company” depends on the respondent. Therefore, there is a possibility that unsuitabl e respondents are included.
2 6 ) As a result of the r ecommendation by the National Personnel Authority in August 2009 , an increase in
the overtime rate and settlement of alternative systems for paid leave were introduced along with the revision. The refore, we included civil services in the treatment group. However, there is a possibility that some local authorities receive slightly different treatment from the recommended content.
2 7 )
Because the KHPS gives options such as “ wholesale trade or retail business,” we cannot determine which one a respondent belongs to.
2 8 )
We use the Indices of Mining and Industrial Output for the mining and manufacturing industry, the values of the relevant industry of the Indices of Tertiary Industry Activity for the tertiary industry, and the Indices of Government Services , etc. in the Indices of All Industry Activity for the civil services. However, for “education and learning support services” of the KHPS, we use the values of “learning support” from the Indices of Tertiary Industry Activity .
control variable 𝑋𝑖𝑡 in order to control variation in the demand of products. In addition, we
use dummy variables regarding age, job tenure, job type, existence of a labor union at the
worksite,2 9 ) job title status, gender, partner status, academic record, and type of industry.
Note that 𝛽 in each formula including 𝛽4 is a parameter, 𝛼𝑖 is an individual effect, and 𝜀𝑖𝑡
is an error term. We excluded the rate of change of the production index i n 2004, as we could not calculate a value used for analysis in 2004 due changes in the industrial classifications. We confirmed the impact on working hours with formulas (1) and (2), the impact on provision and acquisition of annual paid leave with formula s (3) and (4), the impact on the total amount of wages with formula (5) and the wage rate with formula (6) at the same time, and the ability to concentrate on the job with formula (7). Companies may increase the number of employees who work under the worki ng hours systems allowing no overtime premium to reduce the labor costs derived from the increase in the overtime rate. Therefore, we confirmed whether or not the application of the working hours system changed after the revision with formulas (8) and (9). Note that formulas (1), (7), (8), and (9) are estimated with a linear probability model (LPM). Concerning which model is theoretically valid, the simplest assumption is that when formulas (1), (2), (5), and (6) show significantly negative DID estimation values, the Labour Demand Model is relevant. On the other hand, when formulas (1) and (2) are not significant, in some cases, not only the Employment Contract Model, but also the Labour Demand Model are relevant. Those cases, for example, are where the sample size was too small to be significant, alternating with paid leave or when change in the working hours system was performed and the optimal working hours before the revision were less than 55 hours and did not become negative values. Therefore, we prepar e sub-samples and analyze the paid leave and the working hours systems for more precise analysis.
Concerning formulas (1) through (7), we used the data of respondents working under the typical working hours systems or flexible working hours systems and focused on employees
who received overtime premiums.3 0 )
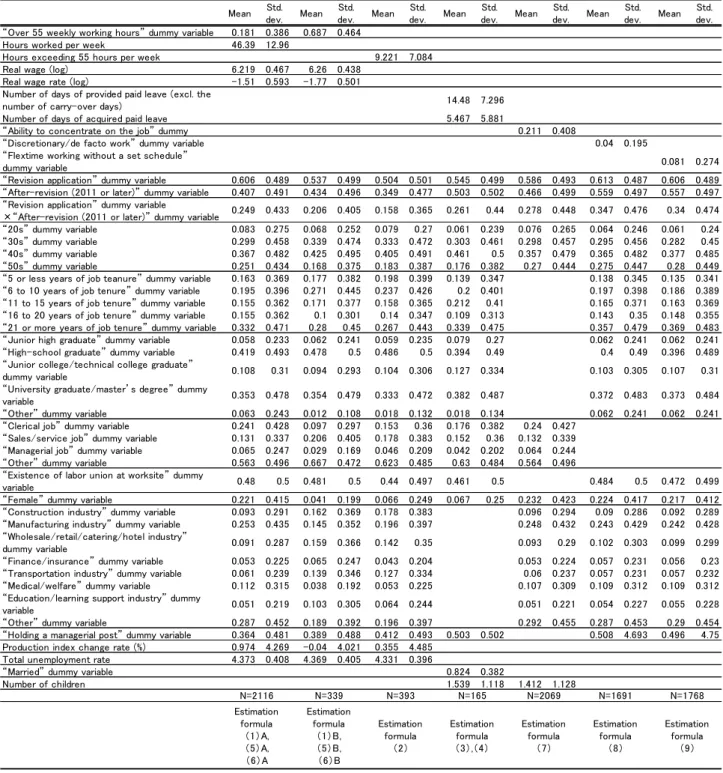
Table 3 shows descriptive statistics of the variables introduced above. The mean value of
2 9 )
Concerning labor union , the KHPS gives options as follows and allows a respondent to select one : “1. Our worksite has no labor union ; 2. Our worksite has a labor union, but I am not a member; 3. I am a member of the labor union of our worksite; 4. I am a member of the labor union that is not an union of our worksite; and 5. I am inapplicable ( self-em ployed worker , freelance professional ).” In this study, when the respondent selected answer 2 or 3, we set the labor union dummy variable as 1, and when the respondent selected another answer, we set the dummy variable as 0. In Japan, more than half of the labor unions have union -shop contracts (the Ministry of Health, Labor, and Welfare’s General Survey on Labour Relations in 2011 (Survey on Collective Agreements ) indicated that 64.3% of the companies had union -shop contracts and provisions of some kind), and generally, almost all regular employees of companies that have labor unions, except managers, are members of unions. Therefore, instead asking whether or not a respondent is a member, the question to ask is whether or not a respondent’s worksite has a labor union for a more suitable analysis of Japanese workers. Ohtake (2001 ) and Ogura (2003 ) also pointed this out.
3 0 )
Research on the working hours systems began in 2008. For values prior to 2008 , we used the results of 2008 for a follow -up study.
the revision application dummy variable was 0.504 to 0.6 13, and the ratio of the treatment group to the control group was small; the percentage of employees whose overtime working hours were over 55 hours was 18.1%.
Table 3: Descriptive statistics
Source: Calculations made by the authors using data from the KHPS.
Note: We excluded the respondents that gave no reply or selected “Inapplicable.” We also excluded the values outside of the range between the mean +/- standard deviation ×3 as outliers.
Mean Std. dev. Mean Std. dev. Mean Std. dev. Mean Std. dev. Mean Std. dev. Mean Std. dev. Mean Std. dev.
“Over 55 weekly working hours” dummy variable 0.181 0.386 0.687 0.464
Hours worked per week 46.39 12.96
Hours exceeding 55 hours per week 9.221 7.084
Real wage (log) 6.219 0.467 6.26 0.438
Real wage rate (log) -1.51 0.593 -1.77 0.501
Number of days of provided paid leave (excl. the
number of carry-over days) 14.48 7.296
Number of days of acquired paid leave 5.467 5.881
“Ability to concentrate on the job” dummy 0.211 0.408
“Discretionary/de facto work” dummy variable 0.04 0.195
“Flextime working without a set schedule”
dummy variable 0.081 0.274
“Revision application” dummy variable 0.606 0.489 0.537 0.499 0.504 0.501 0.545 0.499 0.586 0.493 0.613 0.487 0.606 0.489
“After-revision (2011 or later)” dummy variable 0.407 0.491 0.434 0.496 0.349 0.477 0.503 0.502 0.466 0.499 0.559 0.497 0.557 0.497
“Revision application” dummy variable
דAfter-revision (2011 or later)” dummy variable
“20s” dummy variable 0.083 0.275 0.068 0.252 0.079 0.27 0.061 0.239 0.076 0.265 0.064 0.246 0.061 0.24
“30s” dummy variable 0.299 0.458 0.339 0.474 0.333 0.472 0.303 0.461 0.298 0.457 0.295 0.456 0.282 0.45
“40s” dummy variable 0.367 0.482 0.425 0.495 0.405 0.491 0.461 0.5 0.357 0.479 0.365 0.482 0.377 0.485
“50s” dummy variable 0.251 0.434 0.168 0.375 0.183 0.387 0.176 0.382 0.27 0.444 0.275 0.447 0.28 0.449
“5 or less years of job teanure” dummy variable 0.163 0.369 0.177 0.382 0.198 0.399 0.139 0.347 0.138 0.345 0.135 0.341
“6 to 10 years of job tenure” dummy variable 0.195 0.396 0.271 0.445 0.237 0.426 0.2 0.401 0.197 0.398 0.186 0.389
“11 to 15 years of job tenure” dummy variable 0.155 0.362 0.171 0.377 0.158 0.365 0.212 0.41 0.165 0.371 0.163 0.369
“16 to 20 years of job tenure” dummy variable 0.155 0.362 0.1 0.301 0.14 0.347 0.109 0.313 0.143 0.35 0.148 0.355
“21 or more years of job tenure” dummy variable 0.332 0.471 0.28 0.45 0.267 0.443 0.339 0.475 0.357 0.479 0.369 0.483
“Junior high graduate” dummy variable 0.058 0.233 0.062 0.241 0.059 0.235 0.079 0.27 0.062 0.241 0.062 0.241
“High-school graduate” dummy variable 0.419 0.493 0.478 0.5 0.486 0.5 0.394 0.49 0.4 0.49 0.396 0.489
“Junior college/technical college graduate”
dummy variable 0.108 0.31 0.094 0.293 0.104 0.306 0.127 0.334 0.103 0.305 0.107 0.31
“University graduate/master’s degree” dummy
variable 0.353 0.478 0.354 0.479 0.333 0.472 0.382 0.487 0.372 0.483 0.373 0.484
“Other” dummy variable 0.063 0.243 0.012 0.108 0.018 0.132 0.018 0.134 0.062 0.241 0.062 0.241
“Clerical job” dummy variable 0.241 0.428 0.097 0.297 0.153 0.36 0.176 0.382 0.24 0.427
“Sales/service job” dummy variable 0.131 0.337 0.206 0.405 0.178 0.383 0.152 0.36 0.132 0.339
“Managerial job” dummy variable 0.065 0.247 0.029 0.169 0.046 0.209 0.042 0.202 0.064 0.244
“Other” dummy variable 0.563 0.496 0.667 0.472 0.623 0.485 0.63 0.484 0.564 0.496
“Existence of labor union at worksite” dummy
variable 0.48 0.5 0.481 0.5 0.44 0.497 0.461 0.5 0.484 0.5 0.472 0.499
“Female” dummy variable 0.221 0.415 0.041 0.199 0.066 0.249 0.067 0.25 0.232 0.423 0.224 0.417 0.217 0.412
“Construction industry” dummy variable 0.093 0.291 0.162 0.369 0.178 0.383 0.096 0.294 0.09 0.286 0.092 0.289
“Manufacturing industry” dummy variable 0.253 0.435 0.145 0.352 0.196 0.397 0.248 0.432 0.243 0.429 0.242 0.428
“Wholesale/retail/catering/hotel industry”
dummy variable 0.091 0.287 0.159 0.366 0.142 0.35 0.093 0.29 0.102 0.303 0.099 0.299
“Finance/insurance” dummy variable 0.053 0.225 0.065 0.247 0.043 0.204 0.053 0.224 0.057 0.231 0.056 0.23
“Transportation industry” dummy variable 0.061 0.239 0.139 0.346 0.127 0.334 0.06 0.237 0.057 0.231 0.057 0.232
“Medical/welfare” dummy variable 0.112 0.315 0.038 0.192 0.053 0.225 0.107 0.309 0.109 0.312 0.109 0.312
“Education/learning support industry” dummy
variable 0.051 0.219 0.103 0.305 0.064 0.244 0.051 0.221 0.054 0.227 0.055 0.228
“Other” dummy variable 0.287 0.452 0.189 0.392 0.196 0.397 0.292 0.455 0.287 0.453 0.29 0.454
“Holding a managerial post” dummy variable 0.364 0.481 0.389 0.488 0.412 0.493 0.503 0.502 0.508 4.693 0.496 4.75
Production index change rate (%) 0.974 4.269 -0.04 4.021 0.355 4.485
Total unemployment rate 4.373 0.408 4.369 0.405 4.331 0.396
“Married” dummy variable 0.824 0.382
Number of children 1.539 1.118 1.412 1.128 Estimation formula (8) Estimation formula (9) Estimation formula (1)A, (5)A, (6)A Estimation formula (1)B, (5)B, (6)B Estimation formula (2) Estimation formula (3),(4) Estimation formula (7) 0.347 0.476 0.34 0.474 N=2116 N=339 N=393 N=165 N=2069 N=1691 N=1768 0.365 0.261 0.44 0.278 0.448 0.249 0.433 0.206 0.405 0.158