in Zr-Cu-Al-based Amorphous Alloys
著者
Jian Qiang
year
2017
その他のタイトル
Zr-Cu-Al系非晶質合金における機械的に誘起された
構造若返り
学位授与大学
筑波大学 (University of Tsukuba)
学位授与年度
2017
報告番号
12102甲第8353号
URL
http://doi.org/10.15068/00150062
Mechanically-induced Structural Rejuvenation in
Zr-Cu-Al-based Amorphous Alloys
Jian Qiang
Mechanically-induced Structural Rejuvenation in
Zr-Cu-Al-based Amorphous Alloys
Jian Qiang
Doctoral Program in Materials Science and Engineering
Submitted to the Graduate School of
Pure and Applied Sciences
in Partial Fulfillment of the Requirements
for the Degree of Doctor of Philosophy in
Engineering
at the
i
Abstract
Amorphous alloys are non-crystalline materials without any long-range atomic orders. Unlike oxide glasses or polymers, the constituent atoms in amorphous alloys are interacting mainly via the metallic bonds. “Metallic glass” (MG) is a phrase that is almost interchangeable with “amorphous alloy”, except that the former specifically refers to the specimen made from melt quenching (MQ). Speaking of which, a high cooling rate in the quenching process is crucial as crystallization should be avoided. Because there are no lattice defects such as dislocations or grain boundaries to mediate plastic strain, most MGs fail catastrophically under uniaxial tension or compression; and the plastic strain is often localized in a major shear band in the width of tens of nanometers. On the other hand, the absence of lattice defects gives rise to a lot of outstanding properties such as a high strength, a large elastic limit, and good resistance to corrosion.
Similar to crystalline alloys whose microstructure and properties can be tailored by appropriate annealing or metal-forming processes, an MG of a specific composition can exist in many structural states depending on its thermal history and/or mechanical treatments. Upon annealing, an MG experiences structural relaxation into a lower energy state with a more ordered structure. When it comes to applications, structural relaxation should be avoided as it leads to embrittlement. Contrarily, tuning the atomic structure to a higher energy state with greater disorder (i.e. structural rejuvenation) is of great interest. Structural rejuvenation can be defined as the excitation of atomic configuration towards a higher energy level, and can be quantified by measuring the increase in relaxation enthalpy (ΔHrel). Recently, structural rejuvenation has been studied extensively in the
hope of improving plasticity and gaining a better understanding of the structure of MGs at an atomic level. Structural rejuvenation can be achieved by mechanical means such as elastostatic compression, cold-rolling, etc. Compared to these methods, severe plastic deformation techniques can drastically increase the strain level, therefore achieving a much higher level of rejuvenation. For instance, Meng et al. demonstrated that deformation of Zr50Cu40Al10 MG by high-pressure torsion (HPT) can lead to an increase in ΔHrel as large as
1500 J/mol (Appl. Phys. Lett. 101 (2012) 121914). Despite the intense research effort devoted to studying the structural rejuvenation, some issues remain unsolved.
First, the level of structural rejuvenation not only depends on processing conditions such as the strain level and the temperature of plastic deformation, but is also related to the nature of the processed MG. Greer and Sun (Philos. Mag. 96 (2016) 1644) have proposed that the dynamics of a composition with a higher liquid
ii
fragility are more heterogeneous, and thus could lead to an easier rejuvenation. However, insight on this issue is still lacking, because most studies on rejuvenation primarily focus on exploring new rejuvenation methods, or the microstructural or property changes in one particular composition. With the aim of finding a correlation between the chemical composition and structural rejuvenation, the level of rejuvenation of different HPT-deformed Zr-Cu-Al-based MGs was compared with other compositions reported in the literature.
Second, as mentioned earlier, amorphous alloys are usually fabricated by rapid-quenching of the melt. On the other hand, solid-state amorphization (SSA) offers another way to produce amorphous alloys, for example by severe plastic deformation using HPT. The mechanisms of the amorphous phase formation by MQ and by HPT deformation are quite different since there is no liquid-to-glass transition in the SSA. Thus, different structures and properties can be expected in the amorphous alloys fabricated by different methods. However, most reports about HPT-induced amorphization focused on its dependence on chemical composition; and less attention has been paid to the properties of the HPT-amorphized alloys, especially in comparison to the MG made by MQ. Recently, Yang et al. suggested by atomistic simulation that amorphous alloy obtained by SSA is slightly more disordered (i.e., rejuvenated) than the one obtained by MQ (Sci. Rep. 6 (2016) 29722). Specifically, the SSA produces amorphous phase with a lower atomic packing density and a higher energy state than the MQ amorphous phase. However, the confirmation of such rejuvenated amorphous alloy by solid experimental results, and the study of the microstructure-property relationships remain unexplored.
This thesis focuses on i) studying the composition dependence of mechanically-induced structural rejuvenation in MGs and ii) comparing the properties of different amorphous alloys obtained from different fabrication methods all the while providing evidence for concurrent rejuvenation accompanying SSA.
Contents
Chapter 1 Introduction ... 1
1.1 Amorphous alloys ... 1
1.1.1 Free volume ... 2
1.1.2 Short-range order and medium-range order ... 3
1.1.3 Potential energy landscape ... 5
1.1.4 Flexible volume ... 6
1.2 Structural relaxation and rejuvenation ... 7
1.3 Materials in use ... 12
1.3.1 Metallic glass... 13
1.3.2 Intermetallic compound ... 14
1.4 Research aim and scope ... 15
Chapter 2 Experimental procedures ... 17
2.1 Experimental process ... 17
2.2 Sample preparation and characterization ... 17
2.2.1 Tilt-casting ... 17
2.2.2 High-pressure torsion ... 18
2.2.3 X-ray diffraction ... 24
2.2.4 Differential scanning calorimetry ... 24
2.2.5 Vickers hardness ... 24
2.2.6 Microstructure observation... 25
2.2.7 Tensile test ... 25
2.2.8 Nanoindentation ... 26
2.2.9 Temperature during deformation ... 27
Chapter 3 Structural rejuvenation in Zr-Cu-Ni-Al metallic glasses... 28
3.2 Changes in thermal and mechanical properties induced by high-pressure torsion ... 30
3.2.1 Thermal analysis ... 31
3.2.2 Mechanical properties ... 39
3.3 Composition dependence of mechanically-induced structural rejuvenation ... 53
3.4 Summary ... 57
Chapter 4 Solid-state amorphization in a Zr-Cu-Al crystalline alloy ... 58
4.1 Solid-state amorphization ... 58
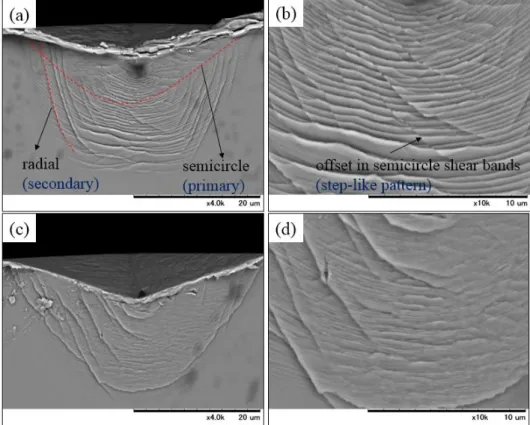
4.2 Microstructure observation ... 60
4.3 Evolution of thermal and mechanical properties: evidence for concurrent rejuvenation
during solid-state amorphization ... 65
4.3.1 Thermal analysis ... 65
4.3.2 Vickers indent and nanoindentation ... 67
4.3.3 Discussion ... 70
4.4 Solid-State amorphization by high-pressure torsion using different rotation speeds ... 76
4.5 Summary ... 82
Chapter 5 Conclusions ... 83
Reference ... 85
1
Chapter 1 Introduction
1.1 Amorphous alloys
Amorphous alloys are non-crystalline materials without long-range atomic order. Unlike in oxide glasses or polymers, the constituent atoms in amorphous alloys are interacting mainly via the metallic bonds. Conventionally, amorphous alloys can be fabricated by melt-quenching, whereby the microstructure of the metallic liquid can be largely preserved in the solid form. And amorphous alloys obtained from such methods are also called metallic glasses. Fig. 1.1 schematically shows the relation between the enthalpy/volume and the temperature of a glass-forming liquid upon cooling. The characteristic glass transition temperature refers to the inflection point of the cooling curve (the glass transition temperature can also be defined as the temperature at which the viscosity becomes 1013Pa·s [1]), which is specific to the composition as well as the thermal history.
In general, a higher cooling rate leads to a higher glass transition temperature. Fig. 1.1 also indicates that there should exist a lower limit for the glass transition temperature (Kauzmann temperature), otherwise the enthalpy of the amorphous alloy might fall below the level of its crystalline counterpart [1]. Besides melt-quenching, solid-state amorphization provides a different pathway to the amorphous phase through the accumulation of lattice defects. Possible methods to achieve solid-state amorphization include irradiation [2], mechanical alloying [3, 4], cold rolling [5, 6] and high-pressure torsion [7-9].
2
Because there are no lattice defects such as dislocation or grain boundary in amorphous alloys, they usually possess many unique properties such as a large elastic limit (~2%), high strength, good resistance to corrosion, thermo-plasticity, and for the Fe(Co)-based amorphous alloys, good soft magnetic properties [10, 11]. However, the lack of lattice defects also implies that there is no effective mechanism to mediate the plastic deformation at room temperature. Alternatively, deformation in amorphous alloys is realized by a process call shear transformation which is a cooperative rearrangement of atom clusters to accommodate the shear strain [12]. And the atoms that undergo such transformation make up a shear transformation zone (STZ), which is schematically shown in Fig. 1.2. It should be noted that STZ is not a natural existence like vacancies in crystalline alloys; STZ is merely a response to the external stimuli with an ill-defined boundary.
Fig. 1.2. Schematic illustration of a shear transformation zone in amorphous alloys subjected to shear strain.
The activation and propagation of STZs are autocatalytic in the sense that shear transformation is accompanied by the increase in the local level of disordering (such as generation of free volume or liquid-like clusters) [12], thus rendering the sheared regions less shear-resistant. As a result, the subsequent shear strain tends to happen near the already sheared region, i.e., the plastic flow would be highly localized in regions called shear bands. Studies have shown that STZs are more likely to be found in areas with certain atomic-level features [12], which can be interpreted from different perspectives introduced below.
1.1.1 Free volume
First of all, free volume has been a long standing concept that describes the microstructure and level of disordering of an amorphous material. By definition, free volume means the part of the thermal expansion, or excess volume that can be redistributed without energy change [13]. The mobility of the local atoms is dependent on the regional level of free volume in a manner that the diffusivity D scales with exp(-γv*/v
3
γ is a constant of the order of unity, v* is the minimum excess volume needed for an atom jump, v
f is the free
volume [14]. Thereby, a microstructure-property relationship can be established. The free volume concept was later developed by Spaepen [15]. He suggested that the competition between creation and annihilation of free volume was the dominating factor of the deformation behavior. If the stress is higher than a critical value, free volume annihilation will not keep up with the rate of free volume creation, leading to strain softening and localization. Theoretically, the amount of free volume of an amorphous alloy depends on its thermal history. For example, a faster cooling rate during melt quenching can result in a higher level of free volume (Fig. 1.1). As one of the most adopted concepts describing the microstructure of amorphous alloys, free volume can be easily quantified by measuring the difference in density or volume between the amorphous phase and the corresponding crystalline phase. However, the “free volume” concept itself is flawed in that it is built upon random packed hard sphere model that neglects the flexibility of the metallic bonds. Besides, experimental [16] and simulation [17] results have shown that the amount of free volume is actually not very sensitive to the cooling rate. Specifically, raising the cooling rate by approximately two orders of magnitude (rod sample vs. ribbon sample) would only lead to an increase in the free volume of about 0.1%.
1.1.2 Short-range order and medium-range order
Secondly, the atomic structure of amorphous alloys can be depicted better from the perspective of short-range order. Studied on atomic simulation over the years have concluded that although amorphous alloys are macroscopically uniform, they are not really homogenous. As a matter of fact, atoms in amorphous alloys exist in distinctively different atomic configurations at the length scale of nearest neighbor coordination, i.e., (topological) short-range order (SRO) [18]. Different types of SROs can be well described using the Voronoi index <n3, n4, n5, n6> with ni being the number of the i-edged polygons. Fig. 1.3 shows some of the common
SROs (purple) and corresponding Voronoi polyhedrons (yellow).
For example, in Zr-Cu binary amorphous alloys, the icosahedral SRO with the Voronoi index being <0, 0, 12, 0> is one of the most numerous. This SRO has a five-fold rotational symmetry and is most shear-resistant. This being said, a higher relative proportion of the icosahedral SRO can lead to a higher shear modulus, which offers a different microstructure-property relationship. The number of icosahedral SRO is also dependent on the thermal history of the amorphous alloy, similar to the free volume. Specifically, a high cooling rate can lead to a decrease of such SRO (Fig. 1.4) [19].
4
Fig. 1.3. Typical short-range orders (purple) and corresponding Voronoi polyhedrons (yellow) for amorphous
alloys. Z is the coordination number [14].
Fig. 1.4. Cooling rate dependence of the fraction of Cu-centered short-range order, and the configurational
potential energy (CPE) of the Cu64Zr36 amorphous alloy at room temperature [19].
In an actual MG that contains more than one element, there usually exist preferential atomic bonds between the solute and solvent elements (also known as “unlike bonds” in contrast to the solvent-solvent and solute-solute bonds), which generate certain degree of chemical ordering. These unlike bonds are more prevalent for atomic pairs between two elements with a larger difference in electronegativity [20]. Upon shearing, the proportion of the unlike bonds in the shear bands will be reduced [21]. In particular, simulated
5
results suggest that the Cu-Cu and Zr-Zr interatomic bonds for Cu64Zr36 and Cu36Zr64 amorphous alloys
increased after shear straining at the expense of the Cu-Zr interatomic bonds [21].
Beyond SRO, a relevant concept called medium-range order (MRO) has also been introduced that defines how different SROs are connected, such connection includes (with a descending level of disordering) vertex bonding, vertex sharing, edge sharing and face sharing [22]. A simulation study on binary Zr-Cu amorphous alloys has shown that the level of inter-connectivity is disrupted by shear straining, but the reduction in the size of MROs is more pronounced for the Cu-richer composition [21].
1.1.3 Potential energy landscape
Thirdly, amorphous alloys are thermally metastable with a higher potential energy than their crystalline counterparts, and such energy difference can be used as another structural indicator for amorphous alloys. The potential energy landscape is considered to be capable of providing a relatively simple theoretical framework that can be easily compared with experimental results (e.g. using differential scanning calorimetry) [23]. Specifically, the configurational potential energy is the energy level at which the corresponding configuration is frozen [14]. Therefore, the lower the configurational potential energy, the more extensive structural relaxation the metallic liquid has experienced before freezing, and the higher degree of structural ordering is developed in the amorphous alloys (Fig. 1.5). A given potential energy landscape consists of many saddle points (local energy minima), therefore amorphous alloys are not truly homogenous as they are composed of local structures with different energy states. Furthermore, each saddle point is separated from its neighbor by an energy barrier called activation energy, the height of which decides the shear modulus. This being said, a link between the microstructure and property becomes clear. A recent studying shows that the magnitude of energy barriers is also dependent on the cooling rate (similar to the amount of free volume and SROs) such that the higher the cooling rate, the lower the energy barrier for atomic hopping (also known as β-relaxation) [23]. Considering that the activation energy for β-relaxation and for the generation of STZs are closely related [24], the reduced energy barrier could also mean easier generation of STZs.
Although the potential energy landscape provides a rather straightforward description of an MG with a given composition and its structural heritage from the liquid state. The drawing of a specific landscape is oftentimes quite arbitrary without knowing anything about the curvature of each saddle point or the height of the energy barrier.
6
Fig. 1.5. Schematic illustration of an energy landscape. The horizontal axis represents all configurational
coordinates [1].
1.1.4 Flexible volume
Very recently, Ding et al. proposed a new structural indicator “flexible volume” that incorporates the vibrational degree of freedom [17]. Their proposal was based on the argument that the free volume alone is not sufficient to describe the properties of an MG. The properties are also related to how much free volume is available to accommodate thermal and mechanical changes. Inspired by the Lindemann melting criterion, the flexible volume (vflex) is set to be:
2
flex vib
v
a
(1.1)where a is the interatomic distance, and <μ2
vib> is the vibration mean square displacement (termed as <r2> in
the original paper). Their simulation also suggested that vflex scales well the shear modulus G such that:
B flex
k T
G
C
v
(1.2)where kB is the Boltzmann constant, T is the temperature and C is a constant for all MGs (~0.47).
They also claimed that the vflex shows a strong correlation with the commonly-used SRO polyhedrons in
the sense that the icosahedral <0, 0, 12, 0> SRO has an obviously larger vflex than the <0, 4, 4, 4> SRO despite
7
highest 10% vflex is 0.9 eV (equates to ~96 kJ/mol if multiplied by the Avogadro constant) higher than those
with the lowest 10% vflex.
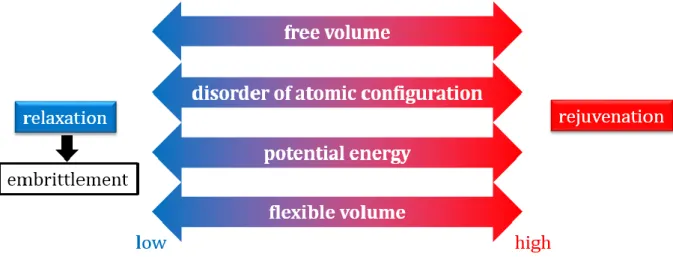
1.2 Structural relaxation and rejuvenation
Fig. 1.6. Changes of microstructure in structural relaxation and rejuvenation of amorphous alloys from
different perspectives.
When it comes to establishing a microstructure-property correlation, several parallel structural indicators are available. Each of them has their own merits and shortcomings. The free volume can be relatively easily quantified by measuring the difference in density, but it does not provide a clear picture from the atomic level. The concept of SRO may provide the information regarding how atoms are packed at the level of nearest coordination shell, but a direct evidence from experimental observation is still lacking. Although there is no structural indicator that can provide a holistic description of the microstructure, it is certain that an amorphous alloy of a specific composition can exist in many structural states depends on the thermal history and mechanical treatment. As mentioned before, amorphous alloys are thermodynamically metastable. Upon heating to the glass transition temperature (Tg), they are expected to experience structural relaxation where a
lower energy state closer to the equilibrium will be attained. Generally, structural relaxation of MGs can be characterized by differential scanning calorimetry (DSC) or dynamic mechanical analysis (DMA). In the
sub-Tg region, structural relaxation manifests itself as a broad exothermic DSC pattern, which is considered to
comprise at least two distinct relaxation mechanisms [25, 26]. The lower-temperature of this spectra can be attributed to the β-relaxation (Johari-Goldstein relaxation) [27]. Liu et al. suggested that the β-relaxation of Zr55Cu30Al10Ni5 can be attributed to the rearrangement of the solvent Zr atoms with large atomic radius [27].
8
On the other hand, in the sub-Tg region of a typical DMA scan, the β-relaxation appears as an independent
peak or a tail of primary α-relaxation (the glass transition). It has also been proposed that a pronounced β-relaxation is likely to be observed in an MG where the atomic pairs have similar negative enthalpies of mixing [28]. When it comes to application, structural relaxation should be avoided as it could lead to further embrittlement with the reduction of the possible activation sites for STZs. Meanwhile, structural relaxation usually results in heat release and densification. Structural relaxation can be interpreted from different viewpoints (Fig. 1.6), which can either mean a reduction of the free volume, an increase of the level of ordering, a decrease of the potential energy or flexible volume. Among these viewpoints, an explanation in the framework of free volume is the most adopted as it facilitates a rather easy description of atomic motion. However, it was built upon hard sphere model. In amorphous alloys, because of the harmonic nature of metallic bonds, atoms can squeeze through tight space without free volume when sufficient shear stress is applied [29]. It was demonstrated that diffusivity in metallic liquids is insensitive to pressure, whereas in the free volume theory diffusivity is expected to be suppressed by pressure. Nevertheless, free volume theory is the most adopted viewpoint as it permits a relatively easily quantification by establishing a linear relationship between the annihilated volume and enthalpy [30]. Structural relaxation has also been interpreted from other perspectives as well. For example, Kohda et al. suggested that structural relaxation is accompanied by an increasing level of chemical and topological short-range orders [31]. Moreover, Kahl et al. interpreted structural relaxation from the perspective of potential energy landscape where the β-relaxation associated with atomic hopping between each sub-basin was thought to be the underlying mechanism [32].
Fig. 1.7. Structural rejuvenation of amorphous alloys interpreted as (a) an increase of the volume or (b)
9
Fig. 1.8. (a) Changes of relaxation enthalpy (ΔHrelax) as a function of cooling rate for Zr55Al10Ni5Cu30 MG
pre-heated to 735 K (1.07 Tg) [33]. (b) Changes of the number of icosahedral SRO in a Cu-Zr MG as a
function of annealing (recovery) temperature at different cooling rates (Rqi) at (Rq1 is the slowest and Rq5 is
the fastest.) [34].
A reverse process of structural relaxation is the structural rejuvenation, which corresponds to an increase in free volume (Fig. 1.7(a)), or level of disordering or atomic configuration (Fig. 1.7(b)), or a higher potential energy. In general, structural rejuvenation can be achieved by two types of methods. The first one mainly involves thermal processes. For example, a pre-relaxed Zr55Cu30Ni5Al10 amorphous alloys can be rejuvenated
by first heated it to its supercooled liquid region, followed by fast cooling [33]. And the extent of rejuvenation (evaluated by the relaxation enthalpy) is positively related to the cooling rate (Fig. 1.8(a)). It was later found out by atomic simulation that structural rejuvenation in this case can be attributed to the increase of the icosahedral SRO and MRO (how the SROs are connected, Fig. 1.8(b)) [34]. More importantly, it is pointed out that heating the MG to its supercooled liquid region is required for the rejuvenation to happen. And the cooling rate from the supercooled liquid region must be higher than the initial cooling rate by which the metallic liquid was frozen. To certain degrees, rejuvenation by this thermal process resembles that of re-melting the MG and then quench at a higher cooling rate. Thermally induced rejuvenation can also be achieved in the cryogenic region by thermal-cycling the sample between the liquid nitrogen and room temperatures (Fig. 1.9) [35]. However, the mechanism for this phenomenon is still unclear. Ketov et al. themselves ascribed this phenomenon to a non-uniform coefficient of thermal expansion [35], whereas Greer and Sun later suggested that rejuvenation in this case was caused by an endothermic process which allows the sample to absorb energy
10
from the surrounding [36]. It is also interesting to notice that the relaxation enthalpy does not saturate or monotonously increase with increasing number of cycles. After 25 cycles, the relaxation enthalpy returns to the as-cast level.
Fig. 1.9. (a) Specific heat curves of La55Ni10Al35 MG rod and melt-spun La55Ni20Al25 MG ribbon after 15 and
10 thermal cycling between the liquid nitrogen and room temperatures, respectively. (b) Changes of relaxation enthalpy (ΔHrel) of La-based MG ribbon and rod as a function of number of cycles [35].
On the other hand, structural rejuvenation can also be realized by mechanical means. This part will be discussed in detail in chapter 3. Here, the rejuvenation of a Zr50Cu40Al10 amorphous alloy by high-pressure
torsion (HPT) is introduced as an example [37]. First of all, mechanically-induced rejuvenation is believed to be closely related to the generation of multiple STZs. Therefore, HPT can drastically increase the level of disordering as it can introduce a large amount of shear strain. As a matter of fact, the Zr50Cu40Al10 amorphous
alloys deformed by 50 rotations of HPT exhibited the largest relaxation enthalpy ever reported. Besides, structural rejuvenation in this amorphous alloy is accompanied by obvious strain-softening and a transition of the deformation mode from localized deformation with pronounced pop-in behavior in the nanoindentation loading curve to a more homogenous one. The restoration of elastic modulus and hardness, and more localized deformation with obvious shear banding by sub-glass-transition annealing also confirmed that the homogeneous plastic flow should be related to structural rejuvenation (Fig. 1.10). It was demonstrated by pair density function that rejuvenation in this case is caused by a net increase of the free volume, which is the result of the simultaneous generation of both shorter and longer interatomic bonds near the first coordination number (Fig. 1.11). Although thermally and mechanically induced rejuvenation are usually interpreted from different perspectives (as will be shown later in chapter 3, the relaxation spectra have different shapes for samples
11
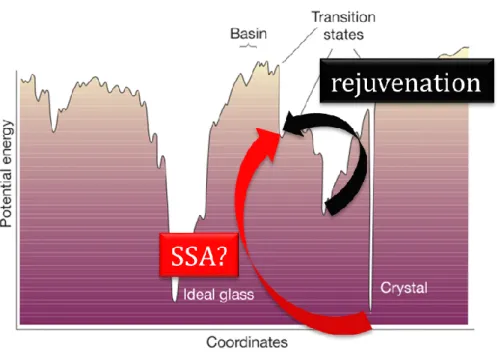
rejuvenated by different methods), there is no doubt that rejuvenation leads to a higher energy state (Fig. 1.12). Furthermore, from the viewpoint of the potential energy landscape, a natural question arises that whether such energy increase can be realized starting directly from the crystalline state. To rephrase, is the amorphous phase made from crystalline-to-amorphous transition (solid-state amorphization) different from the amorphous phase from the one made by melt quenching? For the purpose of solid-state amorphization, HPT is an effective method. Simply speaking, it is necessary to introduce a large amount of lattice defects such that the Gibbs free energy of the defected crystal surpasses that of the corresponding amorphous phase. This part will be explained in a greater length in chapter 4.
Fig. 1.10. (a) Changes of elastic modulus and nanoindentation hardness of Zr50Cu40Al10 MG as a function of
different rotation numbers (N) of HPT. The open symbols represent the HPT-deformed N = 50 sample after annealing at 673 K (Tg-70 K) for 1 hour. Scanning probe microscope (SPM) images of indents in the as-cast
(b) and HPT deformed state with N = 10 (c) and N = 50 (d). (e) Indent of the HPT-deformed N = 50 sample after annealing at 673 K (Tg-70 K) for 1 hour [37].
It should also be mentioned that HPT is a severe plastic deformation technique where the processed sample is deformed in a quasi-hydrostatic condition. This confined setup is suitable to prevent even brittle materials like amorphous alloys from cracking. A more detailed introduction of HPT is provided in chapter 2.
12
Fig. 1.11. Plot of the reference pair density function (PDF, ρ(r)) together with the PDF difference (Δρ(r))
obtained for the Zr50Cu40Al10 amorphous alloy deformed by 10 rotations of HPT at a position 3 mm from the
center [38].
Fig. 1.12. Changes in the potential energy after structural rejuvenation of amorphous alloys and (possibly)
solid-state amorphization (SSA) of crystalline alloys.
1.3 Materials in use
The starting materials for HPT are different in each chapter. Chapter 3 focuses on Zr-Cu-Al-based metallic glasses to study the mechanically-induced rejuvenation. In chapter 4, Zr-40at%Cu-10at%Al alloy composed
13
of multiple intermetallic phases is deformed by HPT to achieve solid-state amorphization.
1.3.1 Metallic glass
Glasses are solid materials whose atomic arrangements lack long-range order, and a metallic glass is such a solid in which the constituent elements are interacting via the metallic bonds. The term “metallic glass” is almost interchangeable with “amorphous alloy”, except that the former specifically refers to the specimen made from liquid quenching. The absence of lattice defects gives rise to a lot of outstanding properties that are unique to metallic glasses such as a high strength, a large elastic limit, high magnetic permeability and low coercive force (for FeCo-based alloys). Therefore, metallic glass has been at the center of materials research since its birth in the 1960s [39]. Because of the poor deformability that defies machining, metallic glasses are mostly fabricated by net-shape forming procedures, which is largely dependent on the intrinsic glass forming ability (GFA, a large critical size tmax or a low critical cooling rate Rc). Many studies in the late 1990s and early
this century have been devoted to discovering compositions with a large glass forming ability [40]. To date, several empirical rules can be referred to when exploring a good glass former. These rules include, a larger supercooled liquid region (ΔTx), a large Tg/Tm ratio (Tg: glass transition temperature; Tm: melting point) and so
forth. Fig. 1.13 summarizes some of the common metallic glass systems listing their Rc and ΔTx. It can be
understood from this figure that the Zr-Cu-Al metallic glasses are good candidates for scientific research because i) they usually possess good GFA which may even be on the order of 1 cm; ii) the usage of noble metals is not necessary to obtain good GFA; iii) the absence of metalloid elements (usually volatile during melting) could guarantee the repeatability of the experimental results and iv) as will be shown later, Zr-Cu metallic glasses are affluent in icosahedral short-range order (SRO) which is the most shear-resistant and ordered, and at the same time most discussed SRO. In this thesis (chapter 3), Zr50Cu40Al10, Zr55Cu30Ni5Al10
and Zr65Cu18Ni7Al10 metallic glasses are used to study the effect of mechanically-induced rejuvenation and the
consequential property changes. These compositions are chosen for the following reasons: i) good GFAs exceeding 1 cm, which is a prerequisite for HPT using the pre-designed anvils; ii) different Zr/Cu ratios representing different proportions of icosahedral SRO; iii) different room temperature ductility (Zr50Cu40Al10
< Zr55Cu30Ni5Al10 < Zr65Cu18Ni7Al10) [41, 42] indicating different shear band stability (note that
14
Fig. 1.13. The relationship between critical cooling rate (Rc), critical size (tmax) and the supercooled liquid
region (ΔTx) for various bulk amorphous alloys [43].
1.3.2 Intermetallic compound
Compared to solid solutions, intermetallic compounds should be more easily amorphized as a fixed stoichiometry ratio is usually mandatory. And a slight deviation from such ratio would lead to drastic increase in the Gibbs free energy and eventually the collapse of the lattice structure.
To facilitate a comparative study between the amorphous phases made by solid-state amorphization and melt quenching, the starting material was obtained by annealing an as-cast Zr50Cu40Al10 alloy in an argon-filled
tube at 1073 K for 72 hours. As will be shown in chapter 4, the annealed sample consists of multiple intermetallic compounds: ZrCu (one with a B2 structure and two martensites), Zr2Cu and τ5 (Zr(CuAl)2). The
affluent grain boundaries acting as sinks of lattice defects can significantly facilitate HPT-induced solid-state amorphization. The equiatomic ZrCu intermetallic compound goes through martensitic transformation (MT) from the cubic B2 structure to two monoclinic martensite phases at 443 K [44], one with a base structure (B19’) with P21/m symmetry and the other with a superstructure Cm symmetry. Seo and Schryvers suggested a
possible crystallographic relationship between the parent B2 phase and the product martensite phases [45]. That is, the basic martensite phase (B19’) can be obtained from the cubic B2 by shearing the (011)B2 planes in
15
the [100]B2 direction, thus forming the monoclinic angle. The [011]B2 [011]B2 directions will be elongated and
shortened, respectively. Besides these lattice distortions, the atoms are shuffled within each unit cell. In essence, the superstructure consists of four unit of the basic cell and some additional shuffling. The schematic diagram illustrating the crystallography relation between the B2, B19’ and Cm is shown in Figure 1.14.
Fig. 1.14. Schematic diagram illustrating the crystallography relation between (a) the austenite B2, (b) B19’
and (c) Cm [45].
1.4 Research aim and scope
Previous research has shown that severe plastic deformation induced by HPT can increase the level of disordering in bulk metallic glass samples. This phenomenon is termed “structural rejuvenation” in contrast to “structural relaxation” where a metallic glass enters a lower energy state when heated to a temperature prior to the onset temperature of crystallization [38]. Specifically in Zr50Cu40Al10 metallic glass, the structural
rejuvenation is accompanied by a reduction in the elastic modulus and hardness and more importantly a transition of the deformation mode from the localized deformation to a more homogeneous deformation without shear banding [37]. However, a systematic study of the influence of rejuvenation on the mechanical and thermal properties still remain unreported. Besides, if structural rejuvenation is a universal phenomenon, what does it depend on? What kind of metallic glass is more susceptible to structural rejuvenation? In chapter 3, these questions will be discussed.
In 2001, Valiev and Mukherjee first reported the formation of an amorphous phase in their attempt to grain-refine a NiTi intermetallic compound using HPT [46]. Since then, more focus has been paid on solid-state amorphization by HPT. In 2009, Sun et al. fabricated Cu-Zr metallic glasses using alternatively stacked pure metal sheets. However, the glass transition cannot be observed in thermal analysis [47]. In 2013, Meng et
16
al. fabricated almost fully amorphous samples using tilt-cast ingots of Zr50Cu50-xAlx (x = 4, 6, 10) alloys. Glass
transition was observed in all compositions and the glass transition temperatures agreed with those for rapidly quenched bulk metallic glass samples [7]. Nonetheless, the mechanical and thermal properties of the samples amorphized by HPT are still unknown, especially in comparison to the metallic glass sample made from liquid quenching. Chapter 4 will address these issues.
Before investigating any specific experimental results, chapter 2 will briefly introduce the general experimental procedures. The chapter 5 will summarize and conclude the thesis.
17
Chapter 2 Experimental procedures
2.1 Experimental process
The master ingots were prepared by casting. Before HPT, the as-cast cylindrical samples were sliced into disks and ground to a thickness of ~0.85 mm. After HPT, the mechanical and thermal properties, as well as the microstructure of the severely deformed samples were examined. The experimental process adopted in this thesis in shown in Fig. 2.1. Note that the diameter of the disk sample and the rotation speed shown in this picture only represent the most commonly-used case.
Fig. 2.1. Schematic illustration of the experimental process.
As introduced in the previous chapter, the shear strain of the HPT-deformed sample is larger at the rim of the disk and theoretically zero at the center. Therefore, it is necessary to clarify the position used for property characterization. For the phase identification using XRD, the HPT-deformed samples were ground to the median plane along the thickness direction, and polished by 1000 grid sand paper. For the thermal analysis, a sector of the disk (fan-shaped) was cut from the circular sample using a refine saw. The nanoindentation tests were performed at a position about 4 mm from the center of the disk at the cross section. For transmission microscope observation, the HPT-deformed sample was first ground to its median plane with a thickness of ~100 μm, from which Ф3 mm disks were then punched out. The thin area for the microscope observation was prepared by twin-jet. In order to remove the influence of heating, samples need polishing were mounted in epoxy resin (Struers EpoFix).
2.2 Sample preparation and characterization
2.2.1 Tilt-casting
18
the master alloy was completely re-melted several times to ensure that the elemental distribution is homogeneous in the melt. The metallic melt was then cast into a rod shape mold by tilting the hearth.
Fig. 2.2. Schematic illustration of the tilt-casting method [48].
2.2.2 High-pressure torsion
The idea of deforming a sample using a combination of high hydrostatic pressure and large shear strain was put forth in 1935 by P. W. Bridgman to study the polymorphic phase transformation [49]. Later on, he found out that the large hydrostatic pressure could drastically increase the ductility of the deformed sample [50]. This finding indicates the feasibility of applying HPT to even brittle samples. In the 1980s, people started to use HPT to fabricate materials with refined structures. The first of such reports is conducted by Valiev, in which he obtained superplastic Al with submicron grains [51]. Since then, most people seemed to use HPT as a tool to study the evolution of microstructure and properties as a function of strain level [52].
2.2.2.1 General principles for high-pressure torsion
Nowadays, the large hydrostatic pressure is usually realized by compressing a sample (typically in the shape of a thin disk) between two anvils (Fig. 2.3). The maximum pressure achievable during HPT depends on what the anvils are made of. For example, it is suggested that 8.5 GPa is the upper limit for anvils made of steel, 30 GPa for WC, 120 GPa for sintered-diamond and 320 GPa for single-crystal diamond [53]. Under the application of the hydrostatic pressure, a controllable shear strain can be exerted to the sample by simply rotating one of the anvils (commonly the bottom one) without incurring fracture. The anvil surfaces in contact with the sample are usually roughened to prevent slippage. If the sample material is free to flow in the radial direction between the two anvils, the setup is considered unconstrained (Fig. 2.3(a)). In order to achieve pressures higher than 2 GPa it is generally preferable to use constrained geometry, in which case a cavity will be machined in one or both the anvils to fit the sample (Fig. 2.3(b) and (c)).
19
Fig. 2.3. Schematic illustrations of HPT in unconstrained a) and constrained b), c) conditions [54]
.
2.2.2.2 Shear strain during high-pressure torsion
To start with, the strain (dl) of a disk sample in a radius of R deformed by a small rotation angle dθ is taken from the following equation:
dl = Rdθ
(2.1)
And then the incremental strain dγ can be calculated as follow [55]:
d d d l R
h h
(2.2)
where h is the thickness of the disk sample. If the thickness of the sample is taken to be constant during the deformation, the shear strain, γ, can then be calculated using the following equation in which N stands for the numbers of rotation. A simple illustration for this calculation is presented in Fig. 2.4.
2π
R NR
h h
(2.3)
In practice, the equivalent shear strain (ε) is used more often. Generally, the equivalent strain can be evaluated by several methods. The most common one is the von Mises shear strain which can be taken from the following [54]:
= / 3
20
Fig. 2.4. Schematic illustration for the calculation of strain during HPT.
However, the equation 2.4 in not valid for a strain larger than 0.8 [54], in which case the ε should be expressed using another way [52]:
ln( )
(2.5)
It is apparent from equation 2.2 that the edge of a sample would be subjected to a larger strain compared to the part at the center. The shear strain γ calculated using this equation is presented in Fig. 2.5 as a function of rotation number [54].
Fig. 2.5. Equivalent shear strain as a function of the number of rotations for positions with different distances
from the center of the sample [54].
As a matter of fact, the thickness of the sample will be slightly reduced after HPT. In this case, taking into consideration of the change in thickness (Δh), the ε can be calculated as described in ref. [56]:
2 1/ 2 0
ln[1 ( R) ] ln(h )
h h
(2.6)
21
simplified when θR>>h, which reveals the following equation:
0 0 0 2 2 2π ln( R) ln(h ) ln( Rh ) ln( NRh ) h h h h
(2.7)
It is clear from equation 2.3 that theoretically speaking, the strain at the center of the sample is not zero. It is just that this strain from compression is often neglected when the number of rotation is large. As different researchers may choose different calculating methods for the equivalent strain, it would be much straightforward to simply use the number of rotation without specifying the actual strain.
2.2.2.3 Application of high-pressure torsion
As mentioned earlier, Bridgman conducted a series of experiments on metallic and non-metallic elements [49]. He has observed grain refinement and increase in the shear stress in his samples, but his main interest was in the polymorphic phase formation under high pressure [49]. He has observed a number of interesting phase transformations such as the α to ω transformation in zirconium [57] and the amorphous to metallic transformation in selenium [49]. After Bridgman, HPT has been used to study other topics such as changes in crystallographic structure and improvement of mechanical properties [52].
Till now, the interest in HPT deforming on alloys and intermetallic compounds still remains, mainly because the mechanical and functional properties can be largely improved due to grain refinement [52]. For instance, Pushin and his colleagues demonstrated that processing the Ti49.4Ni50.6 alloy by 10 turns of HPT
rendered the sample partially amorphous with nanocrystalline embedded in the amorphous matrix. This microstructure resulted in a very high strength and good ductility [58]. Korznikov et al. also reported that processing TiAl intermetallic compound led to obvious cold-worked structure, and a transition from the ordered L10 structure to disorder HCP (A3) structure [59]. The disordering of the ordered phase is a
well-expected phenomenon for intermetallic compounds subjected to HPT [60].
More recently, HPT has also been applied to more complex systems such as metallic glass and high entropy alloy. HPT on metallic glass was initially conducted on Al-RE-TM system (RE: rare earth, TM: transition metal) which shows primary crystallization behavior upon heating [61, 62]. The end material of this thermal treatment after primary crystallization is a composite in which the α-Al nanocrystals are embedded in the remaining amorphous matrix. It was concluded by these researchers that HPT can aid the nanocrystallization, and therefore is a promising technique to produce metallic glass composites with a good combination of mechanical properties [61, 62]. It should be pointed out that since the Al-RE-TM system does
22
not have a good glass forming ability, the starting materials in the aforementioned studies were in the shape of ribbons made by melt-spinning. In 2010, using a very good glass former Zr50Cu40Al10, Dmowski et al. studied
the microstructure changes induced by HPT at the atomic level using high energy X-ray diffraction [38]. They found that HPT could relocate the constituent atoms such that the peak intensity increased on both the right and left side of the first coordination peak and the expanse of the first coordination peak itself. This indicated that both longer and shorter range orders were created, which is opposite to structural relaxation when a metallic glass sample is heated. They thereby adopted the expression - “rejuvenation”. The phenomenon of structural rejuvenation will be discussed later in depth. On the other hand, HPT on high entropy alloy is a rather new topic. Most studies so far were conducted on Al-Cr-Fe-Co-Ni or Co-Cr-Fe-Ni-Mn systems, which focused on grain refinement and improvement of mechanical properties [63-67]. It seems clear that nano-structured high entropy alloy with improved mechanical properties can be easily obtained, but subsequent annealing following HPT is necessary for obtaining an optimal combination of strength and ductility.
2.2.2.4 Advantages and disadvantages of high-pressure torsion
To begin with, HPT is a relatively simple and quick processing technique. The strain level can be easily evaluated by the above-mentioned equations. Besides, HPT calls for minimal supervision in that a large equivalent strain can be simply achieved by increasing the number of rotations without sample resetting. Second, HPT seems to be more effective in grain-refining compared to other SPD techniques. For example, HPT-deforming a pure Ni to an equivalent strain of ~6 reduced the grain size to ~170 nm, whereas deforming by equal-channel angular pressing (ECAP) to an equivalent strain of ~8 resulted in a larger grain size of ~350 nm [68]. Dutkiewicz et al. also observed a similar phenomenon in pure Ti that the grain sized refined by HPT was almost one order of magnitude smaller than that obtained by ECAP [69]. The results of their research are provided in Fig. 2.6. Todaka et al. attributed the more pronounced grain-refinement and the consequential larger increase in hardness to the strain gradient during HPT [70].
Compare to ECAP, which is the most developed SDP technique, a major shortcoming of HPT is the lack of capability to produce larger samples. Trials have been made to perform HPT on cylindrical samples as opposed to disk ones. Nonetheless, it often resulted in microstructure inhomogeneity along the vertical direction [60]. Meaningful attempts have also been made applying HPT to large disk samples [60] or ring samples [71]. It has been suggested that HPT-processed samples may have a better prospect of application as
23 mini-components (such as springs, mini-screws, staples) [60].
Fig. 2.6. The grain size of pure Ni subjected to different SPD techniques [69]. (ECAP: equal-channel angular
pressing; MA: mechanical alloying; HP: hot pressing; HE: hot extrusion; HPT: high-pressure torsion)
2.2.2.5 Processing condition in use
Each anvil used for HPT has a circular sinking of 10 mm in diameter. The circular sinking is concentric with the HPT rotating axis (Fig. 2.7). The sinking has a depth of 0.25 mm, such that the combined depths of the recesses for both top and bottom anvils was 0.5 mm. This value is smaller than the thickness of the disk samples (~0.85 mm), so as to allow a limited outflow of material during processing, preventing the direct contact of the two anvils. Such an event is undesirable both for reasons of premature wear and possible failure of the anvils, and for a considerable reduction in the pressure applied to the sample itself. Moreover, the material outflow creates the backpressure necessary for achieving a pseudo-hydrostatic condition of HPT [72].
Fig 2.7. Schematic illustration (a) and the actual setup (b) used in HPT experiments.
The deformation took place under a pressure of 5 GPa. In order to improve the contact between the sample and the anvils, the contact area was roughened to create a ragged surface. Prior to each deformation, the sinking
24 is cleaned with acetone.
2.2.3 X-ray diffraction
The crystalline phases of annealed samples were identified using X-ray diffraction (XRD, Rigaku TTR III) with Cu-Kα radiation (40 kV, 150 mA). Scanning was performed within the range of 20° - 100°, in steps
of 0.02° with a speed of 5°/min. All measurements were performed at room temperature. The analysis of the XRD pattern was conducted using PDXL and Maud software.
2.2.4 Differential scanning calorimetry
The thermal properties were examined using a Perkin-Elmer Diamond differential scanning calorimeter (DSC) in an argon atmosphere. Fig. 2.8 is the schematic illustration of the cell assembly of a DSC. The temperature difference (ΔT) between the sample and reference cells (S and R) is maintained at zero by a feedback mechanism as the temperature is increased or decreased at a constant scanning rate. The differential power that needs to be applied to the sample cell in order to maintain zero temperature difference is recorded continuously as a function of temperature.
Fig. 2.8. Schematic illustration of the cell of a DSC [73].
2.2.5 Vickers hardness
Vickers microhardness was carried out using a Shimadzu HMV-2 hardness indenter. The indentation period was 15 seconds with a load of 200gf. The tested surface was on the mirror-polished cross-section of the disk. The tests were performed along the radial direction with a 1 mm interval. The detail of the indented position is shown in Fig. 2.9.
25
Fig. 2.9. Schematic illustration of microhardness testing on the cross-section.
2.2.6 Microstructure observation
2.2.6.1 Optical microscopeOptical microscopy observations were performed on a Nikon Eclipse LV150 microscope equipped with a high-resolution camera.
2.2.6.2 Scanning electron microscope
An FEI Quanta 250 FEG scanning electron microscope (SEM) was used to examine the microstructure and elemental distribution. The samples used in these observations were mechanically polished to a mirror-like surface.
2.2.6.3 Transmission electron microscope
Transmission electron microscopy (TEM) was performed on a JEOL JEM-2100 or JEM-2100F transmission electron microscope with an accelerating voltage of 200 kV. Energy-dispersive X-ray spectroscopy was performed using a JEOL JEM-2100F to analyze the elemental distribution. The TEM samples were prepared by a Struers Tenupol-3 twin-jet machine with an electrolyte consisting of 20 vol% nitric acid and 80 vol% methanol operated at ~253 K.
2.2.7 Tensile test
Tensile samples with a shape as in Fig. 2.10(a), with a gauge of 3 mm in length, 1 mm in width and ~0.5 mm in thickness were cut from selected samples by electric discharge machining (also known as wire-cutting), such that the center of the gauge was positioned at a radial distance of 2.5 mm. Before the tensile tests, the samples were electro-polished in a mixture of 20 vol% nitric acid and 80 vol% methanol at 253 K to remove the residual stress from wire-cutting (Fig 2.10(b)).
The specimens were strained under tension using a Shimadzu Servopulser EHV-LV020k1-010 servo-hydraulic tester at an initial rate of 1×10⁻³/s (crosshead speed: 1×10⁻⁵ m/s) until failure. The elongation was
26
measured based on the distance between two markers stuck to the crossheads using a high-resolution video camera.
Fig. 2.10. (a) Schematic representation and (b) the actual shape of the tensile test sample (red line) and its
original position in the HPT disk (black circle).
2.2.8 Nanoindentation
Nanoindentation was performed on mirror-polished samples on a Hysitron Triboindenter TI950 using a Berkovich indenter. The indentation was conducted in the following sequence: loading to the maximum load of 5000 μN, holding at the maximum load (20 s) and then unloading. Three different loading rates were adopted: 25 μN/s, 250 μN/s and 2500 μN/s. The indentation measurements were carried out on an area 4 mm from the center of the disk on the cross section. A typical load-displacement curve is presented in Fig. 2.11. The hardness (H) and reduced elastic modulus (Er) were calculated by the Oliver and Pharr method [74].
where Pmax is the maximum load applied during nanoindentation, S is the initial slope of the unloading curve
(i.e. stiffness), Ac is the contact area, which can be determined from the calibrated indenter area function. max c P H A (2.8) r c
2
S
E
A
(2.9)27
Fig. 2.11 A typical load-displacement curve for nanoindentation test [74].
The Er is determined by the elastic modulus of the indenter (Ei) and the tested specimen (E) as: 2 2 i r i 1 1 1 E E E
(2.10)where vi and v represent the Poisson ratio of the indenter and the specimen, respectively. For a diamond indenter,
vi and Ei are 0.07 and 1140 GPa, respectively. Therefore, using the equation 2.10, the E of the sample can be
calculated. The plasticity of the specimen was evaluated using the plastic criterion:
Rw = hmax/hf (2.11)
where hmax is the maximum displacement, hf is the residual displacement [75]. The morphology of the intent
was examined by scanning probe microscopy.
2.2.9 Temperature during deformation
The temperature during HPT was monitored by a K-type thermocouple and a FLIR E40 infrared camera. The temperature measured by the camera is a few degrees higher than the reading from the thermal couple. This is caused by the fact that the thermal couple was embedded in the immovable anvil, not in direct contact with the sample.
28
Chapter 3 Structural rejuvenation in Zr-Cu-Ni-Al metallic glasses
3.1 Structural rejuvenation in metallic glass
Metallic glasses (MGs) possess many outstanding properties such as great strength, a high elastic limit and good resistance to corrosion that stem from their disordered atomic configuration. However, unlike crystalline alloys whose plastic deformation can be mediated by their intrinsic lattice defects, the mechanism of plastic deformation for MGs remains obscure. At present, “shear transformation” is one of the most accepted concepts explaining the plastic deformation behavior of MGs [12]. Argon proposed that shear transformation refers to a cooperative rearrangement of a cluster of atoms overcoming the saddle point of an energy barrier in the potential energy landscape [76]. This cooperative rearrangement can be regarded as an elemental event of plastic deformation, the accumulation of which eventually leads to the formation of a shear band. A concept that often travels with “shear transformation” is the “shear transformation zone”, which refers to the bunch of atoms participating in the shear event [77]. It is noteworthy that a shear transformation zone may not have a well-defined boundary, and it is only a response to the external force instead of a natural existence [12].
Similar to crystalline alloys whose microstructure and properties can be tailored by appropriate annealing or metal-forming processes, an MG of a specific composition can exist in many structural states depending on its thermal history and/or mechanical treatments [78, 79]. Upon annealing, an MG experiences structural relaxation into a lower energy state with a more ordered structure [36]. When it comes to applications, structural relaxation should be avoided as it leads to further embrittlement [36, 80]. On contrary, it is of great interest to tune the atomic structure to a more disordered state with a high energy level. Such excitation of the atomic configuration towards a higher energy level can be called structural rejuvenation, which can be quantified by measuring the rise in relaxation enthalpy (ΔHrel) [35, 36]. Recently, structural rejuvenation has
been studied extensively as an attempt to obtain a better understanding of the microstructure of MGs at an atomic level [33-35, 37, 38, 79-87].
As mentioned in the first chapter, structural rejuvenation can be induced by thermal processes: by heating the Zr55Al10Ni5Cu30 MG to a temperature slightly above the glass transition temperature (Tg) followed by a
rapid cooling [33] or thermal cycling La55Ni20Al25 MG ribbon between room and liquid nitrogen temperatures
[35]. Rejuvenation by re-entering the supercooled liquid region is somewhat straightforward as it is later attributed to the changes in icosahedral short-range order and medium range order [34]. In contrast,
29 rejuvenation by cryogenic cycling is not well understood.
Structural rejuvenation can also be achieved by mechanical means. Cyclic loading within the elastic limit, Louzguine-Luzgin et al. found an effect similar to structural rejuvenation at the center of a Zr61Cu27Fe2Al10
MG rod [79]. In addition, plastic straining can also cause rejuvenation as was observed in samples subjected to elastostatic compression [82], cold-rolling [83], laser peening [86] and even nano-scale forces exerted by atomic force microscopy [87]. Compared to these methods, high-pressure torsion (HPT) can drastically increase the strain, therefore drastically increases the level of rejuvenation. Very recently, Meng et al. demonstrated that deformation of Zr50Cu40Al10 (Zr50) MG by HPT can lead to an increase in ΔHrel as large as
1500 J/mol [37]. Structural rejuvenation induced by plastic deformation can generally be attributed to the topological and chemical disordering introduced by the massive formation of shear transformed zones.
The extent of rejuvenation should not only depend on the processing conditions (extrinsic factors) such as the strain level [37, 83] and the temperature [88], but is also related to the nature (intrinsic factors) of the processed MG. Ediger proposed that the dynamics of local regions of a glass forming liquid could vary by several orders of magnitude, especially for a fragile liquid [89]. This made Greer and Sun assume that a composition with a higher liquid fragility are more prone to rejuvenation [36]. However, insight on this issue is still lacking, because most studies on rejuvenation primarily focus on exploring new rejuvenation methods [35, 79, 86], or the changes in microstructure or property of one particular composition [33, 83, 90, 91]. The mechanically-induced structural rejuvenation is accompanied by multiple shear transformed zones [38].
In this chapter, structural rejuvenation was induced in Zr55Cu30Ni5Al10 (Zr55) and Zr65Cu18Ni7Al10 (Zr65)
MGs by HPT. The selection of these compositions was inspired by the fact that Zr65 has a rather good plasticity for MGs and Zr55 also exhibits marginal plasticity [41], whereas the Zr50 MG used for a previous study shows ~0 plasticity. As will be discussed later, different Zr/Cu ratios often indicate different fractions of characteristic SROs, which may facilitate a comparative study. The changes in thermal and mechanical properties resulting from structural rejuvenation were also examined. With the aim of finding a correlation between the chemical composition and structural rejuvenation, the level of rejuvenation of Zr55 and Zr65 MGs was compared with other compositions reported in the literature, regardless of whether they were mechanically and/or thermally processed.
30
3.2 Changes in thermal and mechanical properties induced by high-pressure
torsion
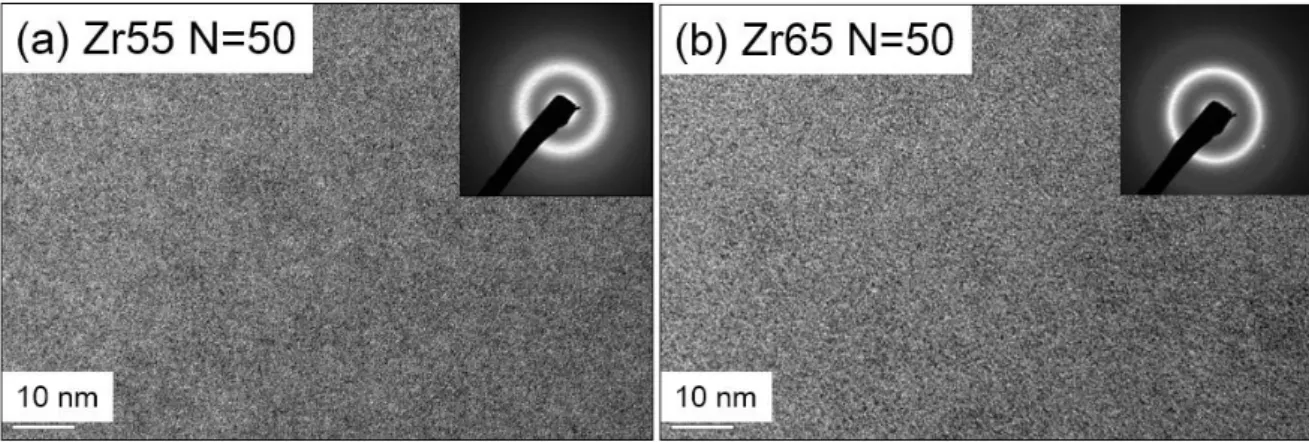
Fig. 3.1(a) and (b) show the XRD patterns of the Zr55 and Zr65 MGs before and after HPT, respectively. For all these samples, only a broad halo peak at 2θ ≈ 38° can be observed, typical for amorphous alloys. However, XRD analysis could not detect any obvious change in the peak width or shift of the peak position. The amorphicity of the samples was also confirmed by TEM. Fig. 3.2 shows TEM bright-field images and the corresponding diffraction patterns (inset) of the Zr55 and Zr65 samples deformed by 50 rotations of HPT (referred to as N = 50 hereafter). The salt-and-pepper contrast in the bright-field image and the broad halo in the diffraction pattern indicate that both the samples remained amorphous after HPT deformation, without any signs of crystallization.
Fig. 3.1. XRD patterns of the (a) Zr55 and (b) Zr65 samples before and after HPT.
Fig. 3.2. Bright-field TEM images of Zr55 (a) and Zr65 (b) samples deformed by N = 50 rotations of HPT.
31
3.2.1 Thermal analysis
3.2.1.1 Isochronal and isothermal DSC tests for Zr55
Fig. 3.3 shows the isochronal DSC curves of the Zr55 samples before and after HPT. It can be seen that the crystallization mode remains the same after HPT, there is only one exothermic peak for all the samples. In regards to the characteristic temperatures, the glass transition temperature (Tg) is unchanged (~682 K), however,
both the onset (Tx) and peak (Tp) temperatures of crystallization become lower, as is plotted as a function of
the number of rotations (N) in Fig. 3.4. This suggests that the thermal stability of the Zr55 MG was slightly deteriorated by HPT.
Fig. 3.3. DSC curves of the Zr55 samples before and after HPT. The insets show the detail of the DSC curves
in the vicinity of the onset and peak temperature, respectively.
Fig. 3.4. Changes of onset crystallization temperature (Tx) and peak crystallization temperature (Tp) as a
32
To quantitatively analyze this idea, the activation energy of crystallization was calculated using the logarithmic Kissinger equation [92]:
a 2 a ln E lnZR T RT E (3.1)
where Ф is the heating rate, T is the specific temperature (Tx for the calculation here), R is the gas constant, Ea
is the apparent activation energy and Z is the frequency factor evaluating the times of collision of the atoms participating in the crystallization reaction. The fitted lines are shown in Fig. 3.5, together with the DSC curves of the as-cast and N = 50 HPT samples heated at different scanning rates. The slight increase in Ea from 312±14
kJ/mol to 323±11 kJ/mol after HPT for Zr55 MG lies in the margin of fitting error, suggesting that the energy barrier between each saddle point of the potential energy landscape is almost the same. On the other hand, the value of Z is also very similar for the samples before and after HPT (R·Ea·e39.0±2.2 and R·Ea·e40.7±1.7 min-1),
indicating the Kissinger method is not accurate enough to reveal the difference in the thermal stability.
Fig. 3.5. The Kissinger plots of the as-cast and N = 50 HPT Zr55 MG samples. The insets are the DSC
curves at different heating rates for these two samples.
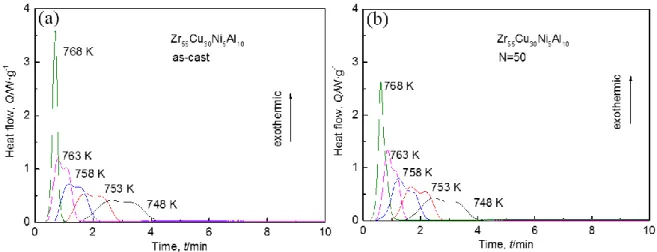
Therefore, isothermal DSC tests were conducted on as-cast and N = 50 HPT-deformed Zr55 samples. Fig. 3.6 shows the isothermal DSC curves for the as-cast and N = 50 HPT samples. It is clear for both samples that the duration of crystallization was shorter at a higher temperature. And a higher temperature could lead to a
33
sharper exothermic peak as well as a shorter incubation time for crystallization.
Fig. 3.6. Isothermal DSC curves of the Zr55 sample (a) in the as-cast state and (b) deformed by N = 50 HPT.
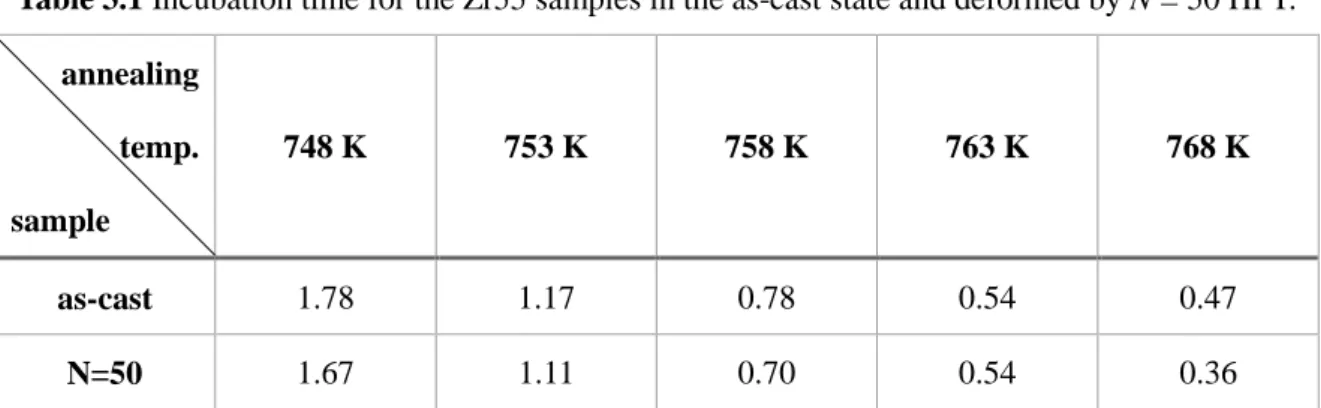
The incubation time for crystallization is defined as the time it takes to reach 1% crystallization (the heat release reaches 1% of the total amount). Fig 3.7 shows the relative volume fraction of the crystallized fraction as a function of the annealing time (t). It is apparent that the incubation time decreased with isothermal annealing temperature. Moreover, it can be seen that the N = 50 HPT Zr55 sample exhibited a faster crystallization than the as-cast one. The exact value of the incubation time is also listed in Table 3.1, confirming that the thermal stability decreased after HPT.
Fig. 3.7. Relative volume fraction of the crystallized phase as a function of the annealing time for the Zr55
34
Table 3.1 Incubation time for the Zr55 samples in the as-cast state and deformed by N = 50 HPT.
annealing temp. sample 748 K 753 K 758 K 763 K 768 K as-cast 1.78 1.17 0.78 0.54 0.47 N=50 1.67 1.11 0.70 0.54 0.36
The crystallization kinetics in isothermal heating is studied using the Kolmogorov-Johnson-Mehl-Avrami equation (KJMA) [93]:
ln( ln(1 x))nlnknln(t
) (3.2) where τ corresponds to a time lag (incubation time), n is the Avrami exponent and k is a kinetic coefficient. The KJMA plot of ln[-ln(1-x)-1]against ln(t-τ) should be a straight line with a slope of n. The fitted curves andAvrami exponents for the Zr55 samples in the as-cast state and deformed by N = 50 HPT are shown in Fig. 3.8. The result shows that the crystallization process can be divided into two stages. From 743 K to 758 K (Tg+100
K), the n ≈ 2, indicating that the crystallization process is initiated by one-dimensional nucleation and growth [93]. As the temperature increases, the crystallization process will gradually evolve to two-dimensional (n ≈ 3) and or even three-dimensional (n ≈ 4) nucleation and growth as reported in ref. [93]. It is worth noticing that HPT did not significantly alter the crystallization process of the Zr55 MG, the different n obtained at different annealing temperatures for the as-cast and N = 50 samples could only be a result of the fitting error.
Fig. 3.8. Avrami plots of ln[ln(1-x)-1] versus ln(t-τ) at different temperatures obtained from isothermal DSC
35 3.2.1.2 Isochronal and isothermal DSC tests for Zr65
Fig. 3.9. DSC curves of the Zr65 samples before and after HPT. The insets show the detail of the DSC curves
in the vicinity of the onset and peak temperature, respectively.
Compared to Zr55, the changes of the characteristic temperatures and crystallization mode of the Zr65 MG after HPT were more obvious. Fig. 3.9 shows the isochronal DSC curves of the Zr65 samples before and after HPT. The Tg remained unchanged (~651 K), similar to the Zr55 MG. However, the crystallization mode
changed gradually from a single-peak to two-peak reaction with increasing N, and the Tx was significantly
lowered. The worsening of the thermal stability signified by the narrowing of the supercooled liquid region (ΔTx = Tx-Tg) can be quantitatively analyzed using equation 3.1. Fig. 3.10 presents the Kissinger plots of the
as-cast and N = 50 HPT Zr65 MG samples. The Ea decreased from 205±7 kJ/mol to 150±17 kJ/mol after HPT,
suggesting the energy barrier between each saddle point of the potential energy landscape was considerably lowered.
![Fig. 1.4. Cooling rate dependence of the fraction of Cu-centered short-range order, and the configurational potential energy (CPE) of the Cu 64 Zr 36 amorphous alloy at room temperature [19]](https://thumb-ap.123doks.com/thumbv2/123deta/8499564.923024/11.892.234.662.581.871/cooling-dependence-fraction-centered-configurational-potential-amorphous-temperature.webp)
![Fig. 2.3. Schematic illustrations of HPT in unconstrained a) and constrained b), c) conditions [54]](https://thumb-ap.123doks.com/thumbv2/123deta/8499564.923024/26.892.123.777.113.343/fig-schematic-illustrations-hpt-unconstrained-constrained-b-conditions.webp)
![Fig. 2.6. The grain size of pure Ni subjected to different SPD techniques [69]. (ECAP: equal-channel angular pressing; MA: mechanical alloying; HP: hot pressing; HE: hot extrusion; HPT: high-pressure torsion) 2.2.2.5 Processing condition in use](https://thumb-ap.123doks.com/thumbv2/123deta/8499564.923024/30.892.186.706.155.425/subjected-different-techniques-mechanical-extrusion-pressure-processing-condition.webp)